

Neutron Scattering in Biology - Fitter Gutberlet and Katsaras
.pdf60 N. Niimura
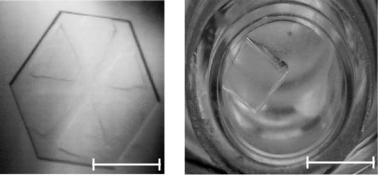
to grow. However, we have found that one rational way to find the proper conditions to grow large single crystals is to establish the complete crystallization phase diagram, which includes determining the solubility curve [38]. Generally speaking, a large single crystal can be grown under supersaturated conditions close to the solubility boundary. As a matter of fact, the large single crystals of cubic porcine insulin, human lysozyme and a DNA oligomer that have been used in our studies have been grown using this method. The phase diagrams of the DNA oligomer [38] and cubic porcine insulin [22] are shown in Fig. 3.16. The corresponding crystals which are obtained on the basis of these phase diagrams are shown in Fig. 3.17, respectively. This method is applicable to grow not only large single crystals, but also crystals of high quality, which is essential for high-resolution crystallographic studies.
3.7 Conclusions and Future Prospects
A neutron protein crystallography experiment is still a time-consuming experiment at current. For example, when a single crystal of 1 mm3 in volume, the unit cell of the lattice of which is less than 100 ˚A, is available, it takes 3 or 4 weeks to collect a 1.5 ˚A resolution data set. If the neutron intensity at the sample position would be increased by a factor of 100, the above mentioned restrictions (size of a single crystal, unit cell size of the lattice constant, data collection time) of neutron protein crystallography would become much more relaxed.
(a)
DNA (mM)
5 |
|
|
4 |
|
|
3 |
A |
B |
|
|
amorphous precipitate |
1 |
crystals |
or disordered crystals |
|
||
|
|
1C
|
|
nothing |
|
|
0 |
500 |
1000 |
1500 |
2000 |
0 |
MgCl2 (mM)
(b)
25
(mg/ml)20 15
Insulin10 5
00 50 100 150 200 250
Na2HPO4 (mM)
Fig. 3.16. The experimentally determined phase diagram. (a) The solubility of the DNA decamer d(CCATTAATGG) vs. MgCl2 concentration. The broken lines show the boundary between regions: a circle, a triangle, and a cross in the phase diagram correspond to the presence of crystals, amorphous precipitate and clear solutions (i.e., no crystals), respectively. Solutions were kept in an incubator at 6◦C for 20 days with an MPD concentration of 30% (v/v) and pH of 7.0 (bu er solution of 0.1 M sodium cacodylate). (b) The solubility of the cubic porcine insulin vs. Na2HPO4 concentration. A circle and a cross mean the presence and absence of cubic porcine insulin crystals in the crystallization. Solutions were kept in an incubator at 25◦C for 7 days with 0.01 M Na3-EDTA bu er solution
3 Neutron Protein Crystallography |
61 |
(a) |
(b) |
1mm |
5mm |
Fig. 3.17. The large crystals of the DNA decamer (a) and cubic porcine insulin (b) obtained on the basis of the phase diagrams in Fig. 3.16a, b, respectively
The J-PARC project in Japan for a 1 MW spallation neutron source and the SNS in the USA for a 2 MW spallation neutron source, which both now are under construction, will become capable to meet the above requirements in neutron intensity. In both projects, J-PARC and SNS, the construction of dedicated neutron di ractometers for protein crystallography (named BIX-P1 and MaNDi, respectively) is scheduled. At these new instruments, the neutron intensity at the sample position will become 50–100 times higher than at the current BIX-type di ractometers.
Acknowledgments
The studies presented were carried out as a part of a “Development of New Structural Biology Including Hydrogen and Hydration” Project, funded by the Organized Research Combination System (ORCS) and promoted by the Ministry of Education, Culture, Sports, Science and Technology of Japan.
References
1.N. Niimura, Y. Karasawa, I. Tanaka, J. Miyahara, K. Takahashi, H. Saito,
S.Koizumi, M. Hidaka, Nucl. Instrum. Methods. A 349, 521–525 (1994)
2.Y.K. Haga, S. Kumazawa, N. Niimura, J. Appl. Cryst. 32, 878–882 (1999)
3.Y.K. Haga, K. Neriishi, K. Takahashi, N. Niimura, Nucl. Instrum. Methods Phys. Res. A 487, 504–510 (2002)
4.N. Niimura, Y. Minezaki, T. Nonaka, J-C. Castanga, F. Cipriani, P. Hoghoj, M.S. Lehmann, C. Wilkinson, Nat. Struct. Biol. 4, 909–914 (1997)
5.N. Niimura, I. Tanaka, Y. Minezaki, Y. Karasawa, I. Tanaka, K. Miki, M. Sato,
M.Hidaka, Minakawa, Y. Morii, Physica B 213–214, 786–789 (1995)
6.S. Fujiwara, Y. Karasawa, I. Tanaka, Y. Minezaki, Y. Yonezawa, N. Niimur, Physica B 241–243, 207–209 (1998)
62N. Niimura
7.I. Tanaka, K. Kurihara, T. Chatake, N. Niimura, J. Appl. Cryst. 35, 34–40 (2002)
8.I. Tanaka, K. Kurihara, Y. Haga, Y. Minezaki, S. Fujiwara, S. Kumazawa, N. Niimura, J. Phys. & Chem. Solids 60, 1623–1626 (1999)
9.K. Kurihara, I. Tanaka, M. Refai-Muslih, A. Ostermann, N. Niimura, J. Synchr. Rad. 11, 68–71 (2004)
10.N. Niimura, Curr. Opin. Struct. Biol. 9, 602–608 (1999)
11.J.R. Helliwell, Nat. Struct. Biol. 4, 874–876 (1997)
12.N.V. Raghavan, A. Woldawer, Methods Exp. Phys., Part C 23, 335–365 (1987)
13.B.P. Schoenborn, Methods Enzymol. 114, 510–529 (1985)
14.A.A. Kossiako , Annu. Rev. Biochem. 54, 1195–1227 (1985)
15.I. Tsyba, R. Bau, Chemtracts 15, 233–257 (2002)
16.N. Niimura, T. Chatake, A. Ostermann, K. Kurihara, I. Tanaka, Z. Kristallogr. 218, 96–107 (2003)
17.N. Niimura, T. Chatake, K. Kurihara, M. Maeda, Cell Biophys. Biochem. 40, 351–370 (2004)
18.A. Ostermann, I. Tanaka, N. Engler, N. Niimura, F.E. Parak Biohpys. Chem. 95, 183–193 (2002)
19.K. Kurihara, I. Tanaka, T. Chatake, M.W.W. Adams, F.E. Jenny Jr., N. Moiseeva, R. Bau, N. Niimura, Proc. Natl. Acad. Sci. USA, 101, 11215–11210 (2004)
20.T. Chatake, K. Kurihara, I. Tanaka, I. Tsyba, R. Bau, F.E. Jenny Jr., M.W.W. Adams, N. Niimura, Acta Cryst. D 60, 1364–1373 (2004)
21.M. Maeda, S. Fujiwara, Y. Yonezawa, N. Niimura, J. Phys. Soc. Jpn. Suppl. A 70, 403–405 (2001)
22.M. Maeda, T. Chatake, I. Tanaka, A. Ostermann, N. Niimura, J. Synchr. Rad. 11, 41–44 (2004)
23.H. Matsuo, M. Oe, F. Sakiyama, K. Narita, J. Biochem. 72, 1057–1060 (1972)
24.C. Bon, M.S. Lehmann, C. Wilkinson, Acta Cryst. D 55, 978–987 (1999)
25.W. Gu, B.P. Schoenborn, Proteins 22, 20–26 (1995)
26.S. Mason, A.G. Bentley, G.J. McIntyre, Deuterium exchange in lysozyme at 1.4A resolution, in: Neutrons in Biology, ed. by B.P. Schoenborn. (Plenum Press, New York, London, 1984), pp. 323–334
27.E.N. Baker, R.E. Hubbard, Prog. Biophys. Molec. Biol. 44, 97–179 (1984)
28.G.R. Desiraju, T. Steiner, The Weak Hydrogen Bond (Oxford University Press, New York, 1999)
29.R. Preissner, U. Egner, W. Saenger, FEBS Lett. 288, 192–196 (1991)
30.S. Longhi, M. Czjzek, V. Lamzin, A. Nicolas, C. Cambillau, J. Mol. Biol. 268, 779–799 (1997)
31.T. Sandalova, G. Schneider, H. Kack, Y. Lindqvist, Acta Cryst. D 55, 610–624 (1999)
32.P.R. Blake, J.B. Park, Z.H. Zhou, D.R. Hare, M.W.W. Adams, M.F. Summers, Protein Sci. 1, 508–21 (1992)
33.W. Gu, A.E. Garcia, B.P. Schoenborn, Basic Life Science 64, 289–298 (1996)
34.B.V. Daniels, B.P. Schoenborn, Z.R. Korszun, Basic Life Science 64, 325–331 (1996)
35.T. Chatake, A. Ostermann, K. Kurihara, F.G. Parak, N. Niimura, Proteins: Struct. Funct. Genet. 50, 516–523 (2003)
36.S. Arai, T. Chatake, Y. Minezaki, N. Niimura, Acta Cryst. D 58, 151–153 (2002)

4
Neutron Protein Crystallography:
Technical Aspects and Some Case Studies
at Current Capabilities and Beyond
M. Blakeley, A.J.K. Gilboa, J. Habash, J.R. Helliwell, D. Myles, J. Raftery
4.1 Introduction
The present major driving forces of life science at the molecular and cellular scale are functional genomics and proteomics. Information on the specific functions of many more if not all proteins encoded in human and other genomes is seen as desirable. Major obstacles to these aims are the vast complexity of the individual proteins and the even more delicate interaction of di erent proteins and other biomolecules to form (transient) functional complexes.
Neutrons have a unique role to play in determining the structure and dynamics of biological macromolecules and their complexes. The similar scattering magnitude from hydrogen, deuterium, carbon, nitrogen and oxygen means that the e ect of atomic vibration in lowering the visibility of these atoms in Fourier maps is no worse for the hydrogen/deuterium atoms. Moreover, the negative scattering length of hydrogen allows the well-known H/D contrast variation method to be applied. Also there is not a radiation damage problem using neutrons as the di raction probe, unlike X-rays, which readily allows room temperature neutron data collection. Clearly, even with these advantages, the low flux of existing neutron facilities means that neutron protein crystallography (nPX) is not going to be a high throughput technique due to long measuring runs (e.g., currently typically between 1 and 4 weeks for a data set). However, the proteomics programmes of research are going to make many more candidate proteins accessible for nPX studies. Thus there is a renewed and growing interest in nPX studies today. The importance rests on knowing the details of the hydrogen and water substructure, which are involved in all the molecular processes of life virtually. This experimental structural information is mostly incomplete when studied by X-rays alone. Also many enzyme reactions involve hydrogen. So there is great potential for wide application of nPX if the technical capability can be found.
There are two major hurdles for wide application of neutron protein crystallography; first the size of crystals routinely available vs. the sizes required,
64 M. Blakeley et al.
and second a molecular weight ceiling of typically 40 kDa. Neutron source and apparatus developments could make an important impact here, e.g., enhancement plans for LADI at the ILL in Grenoble, a proposed LMX instrument on ISIS2 and the new (MAcromolecular Neutron Di raction Instrument) MANDI planned for the new 1.4 MW USA source SNS. More routine use of full deuteration of the protein through microbiological expression of proteins for bacteria grown on deuterated media is possible and will make a major impact. For example it was recently shown [1] that a 1.7 ˚A neutron study of fully deuterated myoglobin was more e ective than a 1.5 ˚A X-ray study in finding even the relatively static hydrogens (as deuteriums). At ILL in Grenoble, a new European funded perdeuteration Laboratory has recently come on line for a focus for protein production of fully deuterated proteins, which will improve signal-to-noise by an order of magnitude as well as opening-up new contrast variation experiments.
4.2 Data Collection Perspectives
Synergies between neutron and synchrotron radiation (SR) Laue crystallography, namely a commonality of knowledge of Laue geometry irrespective of radiation type, opened up a new path in neutron protein crystallography data collection [2–4]. The gain in speed over monochromatic neutron techniques has been notable with the advantage also allowing smaller crystals and bigger unit cells to be investigated. However, this is at the expense of signal-to-noise in the di raction pattern. Nevertheless very high resolution studies (1.5 ˚A) on small proteins have been undertaken in times of 10–14 days. Narrow bandpass Laue and/or fully deuterated protein significantly improves S/N. On LADI the geometric limit of resolution is 1.4 ˚A and the molecular weight ceiling is around 40 kDa in practice due to spot overlap congestion for the fixed radius and the crystal cross-sections commonly in use (up to 3 mm). In the limit, monochromatic techniques can also remain attractive at neutron reactor sources [5]. This is generally at the expense of longer data collection times (typically 30–60 days per monochromatic data set), even with large area coverage neutron image plates, and is restricted to rather small protein unit cells.
Another technical frontier involves the size of crystal that can be studied with current neutron image plate (IP) di ractometers. It is not always true that very big protein crystals cannot be grown and apparatus should be developed which would allow sample cross-sections of between 5 mm and 1 cm to be harnessed [6]. The crux of the new apparatus would be to allow for much bigger neutron di raction spot sizes than hitherto imagined. Also the new MANDI planned for the new USA source SNS and, when funded, the proposed 5 MW European Spallation Source (ESS) would o er further gains.
4 Neutron Protein Crystallography |
65 |
Glu8
1.253(9)
1.275(9) |
1.52 |
2.58
1.324(10)
1.170(9)
Asp28
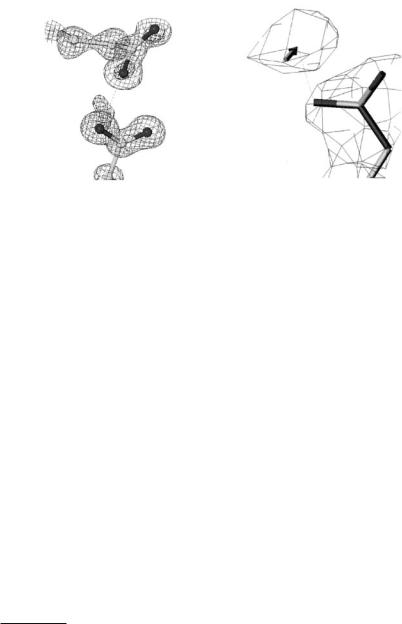
Fig. 4.1. Finding protein carboxy side chain hydrogens via (left) X-ray derived electron density maps and precise bond distances (standard uncertainty values in brackets) and (right) via neutron-derived nuclear density maps
4.3 Realizing a Complete Structure:
The Complementary Roles of X-ray
and Neutron Protein Crystallography
Whilst the determination of hydrogens in proteins is now feasible with ultrahigh/atomic resolution protein SR X-ray crystallography (Fig. 4.1) mobility of hydrogens can kill their di raction signal. Since neutron protein crystallography determination of deuteriums at around 2 ˚A or better resolution matches that at 1.0 ˚A by SR X-rays, then more mobile hydrogens are determinable by the neutron approach [7] (Table 4.1). Indeed the bound solvent is a whole category of deuterium atoms which are more e ciently sought by neutron techniques [7].
Atomic resolution is usually taken to be crystal structure studies where the X-ray di raction data is still reasonable1 at 1.2 ˚A and where, thus, the electron density shows resolved atoms. However, as emphasized in [8] with concanavalin A studied at 0.94 ˚A, the X-ray data to parameter ratio at atomic resolution (1.2 ˚A) is “only” around 2. Also, although the model structure dictionary restraints add data making an overall X-ray + restraints data to parameter ratio of 3, some of these restraints are not appropriate, e.g., for carboxyl side chains where the nonprotonated dictionary assumption is not correct. At resolutions better than 0.95 ˚A however, the X-ray data number has grown su cient to allow the X-ray data to dominate the dictionary restraints
1The criteria for the data being reasonable ie observed to any given resolution usually include criteria like the resolution where F/σ(F ) crosses a value of 2 plus the completeness of data should be >50%. Sometimes the resolution where the Rmerge(I) rises above 20% is also used. These are useful practical data quality indicators after all the e orts to make the best data collection experiments (choice of crystal, exposure time, temperature, etc.)

66 M. Blakeley et al.
Table 4.1. Bound water comparison for the 2.4 ˚A neutron room-temperature structure and 0.94 ˚A X-ray cryo-structure [7, 8]
|
total no. |
common waters D2O |
D–O H2O |
H–O |
|
of waters |
˚ |
|
|
|
(within 1 A) |
|
|
|
neutron structure |
148 |
62 |
20 |
|
(room temp.) |
|
|
|
|
X-ray structure |
319 |
88 |
15 |
35 |
(cryotemp.) |
|
|
|
|
|
|
|
|
|
where necessary in the structure, i.e., such as carboxy side chains. The emphasis at such resolutions, called ultrahigh for want of a better term, involves checking of bond distances and their standard uncertainties to define e.g., the presence or absence of a hydrogen, rather than the electron density map shape used at atomic resolution. At better resolutions than 0.95 ˚A, the X-ray data to parameter ratio improves further obviously. At much better resolutions still ( 0.7 ˚A), the valence electron density becomes discernible and the emphasis switches back to the density, or rather the electron density along with bond distances. In these “smaller-molecule-crystallography accuracy” situations there is a di erence from small molecule crystallography practice in that it is in fact not possible to remove the dictionary restraints because individual atoms or groups of atoms (such as on loops on the protein) do not di ract to the edges of the pattern and the dictionary structure restraints are essential to stop those parts of the structure “falling apart”. It is in these more mobile parts of the protein structure that the role of neutron protein crystallography in completing the protein structure protonation details is clearly needed.
It is also a fair question to ask just how many protein crystal structures can be studied at 0.95 ˚A X-ray di raction resolution or better. Only time and experience will reveal the answer to that along with answering the similar question of how many protein crystal structures will become available per annum as neutron sources and instruments for nPX improve and as more fully deuterated proteins are crystallized.
4.4 Cryo-Neutron Protein Crystallography
Due to the inherent low flux of neutron sources, large crystals are at present essential for high-resolution neutron crystallographic studies. Since neutrons do not cause radiation damage there has not been a pressing need to combine cryoprotection of crystals with a large volume. However, there is the advantage to be gained from cryo-crystallography of the reduction of atomic mobility that would lead to reduction in B-values and enhanced density definition. Furthermore collecting data at cryo-temperatures can also reduce background scattering (di use scattering), and therefore can aid the signal-to-noise ratio and hence the resolution limit. Cryo-crystallography also opens up the possibility of freeze trapping of intermediates in biological reactions triggered in
4 Neutron Protein Crystallography |
67 |
a protein crystal. So, the idea of combining neutron and cryo-crystallography advantages together is of considerable interest.
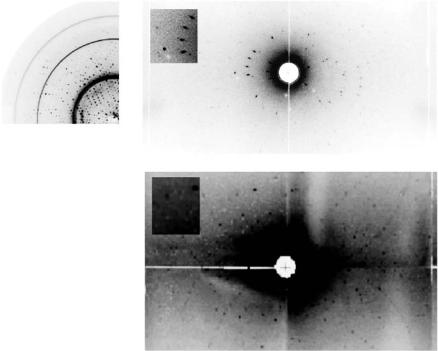
There are, however, several problems that can occur by cooling the crystal. Cooling can create disorder in the molecule or unit cell, which reduces data quality as quantified by atomic and overall molecule B-factors, and so degrades the resolution limit and therefore reduces accuracy of electron or nuclear density maps. The whole crystal usually also becomes more mosaic and the monochromatic rocking width or Laue pattern spot size of reflections increases. Thus reflections can sink into the background more quickly than if they are “sharp”. Again this manifests as a reduction of resolution limit in effect but is generally less severe than deterioration of the protein B-factors just referred to. In extreme cases, cooling the crystal can cause complete cracking and dislocations, making data collection impossible. The imperfections in a crystal can be described by a simple mosaic-block model, and that describes three characteristic parameters. These parameters are the size s of the mosaic blocks, the angular spread ω of the blocks and the variation in cell dimensions δa between blocks. A common e ect observed by cooling macromolecular crystals is an increase in mosaicity. Small crystals at room temperature generally have small mosaicities (<0.02◦), with this value being increased by the characteristics of the X-ray beam. When cooled, protein crystals generally have mosaicities of 0.2◦ or more. It seems to have been generally assumed that freezing large crystals is not possible. It has been shown that it is possible to freeze and collect high resolution X-ray (1.65 ˚A on a rotating anode, Fig. 4.2a) and neutron (2.5 ˚A on LADI) data from large concanavalin A protein crystals ( 5 and 2 mm3) as examples [9]. These data have allowed a combined “X+n” protein structure analysis to be undertaken [10] as performed previously with room temperature X-ray and neutron data sets [7]. Figure 4.2b, c compare an LADI image for concanavalin A recorded at 15 K with one at room temperature and where the high quality spot shape at both temperatures is evident. These results demonstrate the potential of protein cryo-crystallography with neutrons thus combining the advantages of the neutron and cryo-approaches for studying the structural details of bound water hydrogens (as deuteriums) and of protonation states of amino acid side carboxyl side chains. Perhaps most exciting of all this opens up the possibility of time-resolved neutron freeze-trap protein crystallography. Reviews of X-ray time-resolved protein crystallography are given in [9] and [11].
4.5 Current Technique, Source,
and Apparatus Developments
At the neutron reactor source in Grenoble, the most powerful in the world, there is a coordinated millennium instrument refurbishment going on. This includes upgrades to the biological crystallography relevant instruments, namely D19 (a monochromatic neutron di ractometer with enlarged area
68M. Blakeley et al.
(a)(b)
(c)
Fig. 4.2. (a) X-ray 0.05◦ rotation di raction image from a frozen crystal of concanavalin A of volume 2 mm3 showi ng di raction to 1.65 ˚A resolution. Approximately 80% of this crystal di racted to high resolution like this. Neutron LADI di raction data was recordable to 2.5 ˚A resolution from this identical crystal. (b) LADI image recorded from a concanavalin A crystal at 15 K. (c) Likewise from another concanavalin A crystal but at room temperature. Both are accompanied by insets showing an enlarged view of individual spots. From [10]
detector coverage (thus improving data collection e ciency), and the LAue DI ractometer (LADI) which will have a new neutron image plate reader, new guide-optics and a higher flux location yielding gains of 10 or more in sensitivity + flux (thus reducing data collection time or allowing smaller crystal samples to be used or larger molecular weight proteins to be investigated or combinations thereof).
A vital next step beckons using the time-of-flight Laue approach, feasible at a spallation neutron source. This type of source employs accelerated proton pulses, which strike a target such as mercury. Neutrons are ejected (spallated) out of the target also in pulses and over a broad continuum of wavelengths. Laue spots containing overlapping Bragg reflections can be resolved by the time of arrival at the detector, and likewise noise pile up reduced, delivering a better signal to noise than can be realized using Laue techniques at steady state (reactor) sources. This approach has now recently been successfully
4 Neutron Protein Crystallography |
69 |
exploited in protein crystallography at the Los Alamos Neutron Scattering Centre (LANSCE) [12]. A time-of-flight Laue protein crystallography facility with neutrons is planned at the SNS which will operate at 2 MW. The proposed ESS at 5 MW has been estimated [13] to reach the same average flux (in fact 0.5) as the ILL Grenoble 58 MW reactor neutron beam flux but with the addition of the benefit of the time-of-flight neutron measuring approach, which can “gate out” the noise falling onto a reflection spot intensity in ordinary Laue exposures i.e., which is without time-of-flight gating.
4.6 Plans for the ESS and nPX
The ESS Project Team studies recently allowed a review and assessment of future potentialities for nPX, quoting from [14]: “In high throughput structural biology research, the best sample size is rarely above 100 ×100 ×100 m. It is essential for neutron protein crystallography to find source, instrument and sample (deuteration) combinations to face this challenge. There is also a barrier to the application of high resolution neutron structural study posed by molecular weight, which determines the unit cell volume, of large biological complexes. Such weakly scattering crystals cannot be studied currently. If, however, we combine the ESS source and instrument improvements, and improved knowledge of the protein preparation and crystallogenesis for the growth of large crystals, the unit cell size capability could reach (250 ˚A)3.” ...
“In the first case (then), a brighter neutron source, well-focussed beams and smaller-pixel detectors will be in the design (of the first nPX instrument). To meet the second challenge, one has to continue to harness the expertise of the crystallogenesis community to produce big crystals. Thus larger beams and bigger-pixel detectors are needed. This is a di erent (nPX) instrument. Also we should harness longer wavelengths to enhance the scattering-e ciency- with-wavelength-e ect as well. A methane moderator tailored to wavelengths 1.5–5 ˚A should be investigated.” These extracts show the scope imagined for nPX with such a new source and the nPX instrument solutions envisaged. The ESS is seen as a long-term goal for Europe, meaning that it was only recently still “not yet approved” for funding. As an example of the technical challenge currently Fig. 4.3 shows the protein crystal sample sizes and unit cell volumes marked for the cases of references [6,7,15] with [7] within current capability, [6] at the current limit and [15] well beyond current capabilities. Fig. 4.4 shows the LADI di raction pattern for [6] with 50 kDa in the crystal asymmetric unit of concanavalin A with glucose bound (I213 a = 167.8 ˚A).
4.7 Conclusions and Future Prospects
The role of structural data in drug discovery in the pharmaceutical industry will increase when it is much more routine that hydrogen atoms and bound water deuterium atoms positional information can be incorporated.