

- •About the Authors
- •Dedication
- •Authors’ Acknowledgments
- •Table of Contents
- •Introduction
- •What’s Not (And What Is) in This Book
- •Mac attack!
- •Who Do We Think You Are?
- •How This Book Is Organized
- •Part I: AutoCAD 101
- •Part II: Let There Be Lines
- •Part III: If Drawings Could Talk
- •Part IV: Advancing with AutoCAD
- •Part V: On a 3D Spree
- •Part VI: The Part of Tens
- •But wait . . . there’s more!
- •Icons Used in This Book
- •A Few Conventions — Just in Case
- •Commanding from the keyboard
- •Tying things up with the Ribbon
- •Where to Go from Here
- •Why AutoCAD?
- •The Importance of Being DWG
- •Seeing the LT
- •Checking System Requirements
- •Suddenly, It’s 2013!
- •AutoCAD Does Windows (And Office)
- •And They’re Off: AutoCAD’s Opening Screens
- •Running with Ribbons
- •Getting with the Program
- •Looking for Mr. Status Bar
- •Let your fingers do the talking: The command window
- •The key(board) to AutoCAD success
- •Keeping tabs on palettes
- •Down the main stretch: The drawing area
- •Fun with F1
- •A Simple Setup
- •Drawing a (Base) Plate
- •Drawing rectangles on the right layers
- •Circling your plate
- •Nuts to you
- •Getting a Closer Look with Zoom and Pan
- •Modifying to Make It Merrier
- •Hip-hip-array!
- •Stretching out
- •Crossing your hatches
- •Following the Plot
- •A Setup Roadmap
- •Choosing your units
- •Weighing up your scales
- •Thinking annotatively
- •Thinking about paper
- •Defending your border
- •A Template for Success
- •Making the Most of Model Space
- •Setting your units
- •Making the drawing area snap-py (and grid-dy)
- •Setting linetype and dimension scales
- •Entering drawing properties
- •Making Templates Your Own
- •Setting Up a Layout in Paper Space
- •Will that be tabs or buttons?
- •View layouts Quick(View)ly
- •Creating a layout
- •Copying and changing layouts
- •Lost in paper space
- •Spaced out
- •A view(port) for drawing in
- •About Paper Space Layouts and Plotting
- •Managing Your Properties
- •Layer one on me!
- •Accumulating properties
- •Creating new layers
- •Manipulating layers
- •Using Named Objects
- •Using AutoCAD DesignCenter
- •Copying layers between drawings
- •Controlling Your Precision
- •Keyboard capers: Coordinate input
- •Understanding AutoCAD’s coordinate systems
- •Grab an object and make it snappy
- •Other Practical Precision Procedures
- •Introducing the AutoCAD Drawing Commands
- •The Straight and Narrow: Lines, Polylines, and Polygons
- •Toeing the line
- •Connecting the lines with polyline
- •Squaring off with rectangles
- •Choosing your sides with polygon
- •(Throwing) Curves
- •Going full circle
- •Arc-y-ology
- •Solar ellipses
- •Splines: The sketchy, sinuous curves
- •Donuts: The circles with a difference
- •Revision clouds on the horizon
- •Scoring Points
- •Commanding and Selecting
- •Command-first editing
- •Selection-first editing
- •Direct object manipulation
- •Choosing an editing style
- •Grab It
- •One-by-one selection
- •Selection boxes left and right
- •Perfecting Selecting
- •AutoCAD Groupies
- •Object Selection: Now You See It . . .
- •Get a Grip
- •About grips
- •A gripping example
- •Move it!
- •Copy, or a kinder, gentler Move
- •A warm-up stretch
- •Your AutoCAD Toolkit
- •The Big Three: Move, Copy, and Stretch
- •Base points and displacements
- •Move
- •Copy
- •Copy between drawings
- •Stretch
- •More Manipulations
- •Mirror
- •Rotate
- •Scale
- •Array
- •Offset
- •Slicing, Dicing, and Splicing
- •Trim and Extend
- •Break
- •Fillet and Chamfer and Blend
- •Join
- •When Editing Goes Bad
- •Zoom and Pan with Glass and Hand
- •The wheel deal
- •Navigating your drawing
- •Controlling your cube
- •Time to zoom
- •A View by Any Other Name . . .
- •Looking Around in Layout Land
- •Degenerating and Regenerating
- •Getting Ready to Write
- •Simply stylish text
- •Taking your text to new heights
- •One line or two?
- •Your text will be justified
- •Using the Same Old Line
- •Turning On Your Annotative Objects
- •Saying More in Multiline Text
- •Making it with Mtext
- •It slices; it dices . . .
- •Doing a number on your Mtext lists
- •Line up in columns — now!
- •Modifying Mtext
- •Gather Round the Tables
- •Tables have style, too
- •Creating and editing tables
- •Take Me to Your Leader
- •Electing a leader
- •Multi options for multileaders
- •How Do You Measure Up?
- •A Field Guide to Dimensions
- •The lazy drafter jumps over to the quick dimension commands
- •Dimension associativity
- •Where, oh where, do my dimensions go?
- •The Latest Styles in Dimensioning
- •Creating and managing dimension styles
- •Let’s get stylish!
- •Adjusting style settings
- •Size Matters
- •Details at other scales
- •Editing Dimensions
- •Editing dimension geometry
- •Editing dimension text
- •Controlling and editing dimension associativity
- •Batten Down the Hatches!
- •Don’t Count Your Hatches. . .
- •Size Matters!
- •We can do this the hard way. . .
- •. . . or we can do this the easy way
- •Annotative versus non-annotative
- •Pushing the Boundary (Of) Hatch
- •Your hatching has no style!
- •Hatch from scratch
- •Editing Hatch Objects
- •You Say Printing, We Say Plotting
- •The Plot Quickens
- •Plotting success in 16 steps
- •Get with the system
- •Configure it out
- •Preview one, two
- •Instead of fit, scale it
- •Plotting the Layout of the Land
- •Plotting Lineweights and Colors
- •Plotting with style
- •Plotting through thick and thin
- •Plotting in color
- •It’s a (Page) Setup!
- •Continuing the Plot Dialog
- •The Plot Sickens
- •Rocking with Blocks
- •Creating Block Definitions
- •Inserting Blocks
- •Attributes: Fill-in-the-Blank Blocks
- •Creating attribute definitions
- •Defining blocks that contain attribute definitions
- •Inserting blocks that contain attribute definitions
- •Edit attribute values
- •Extracting data
- •Exploding Blocks
- •Purging Unused Block Definitions
- •Arraying Associatively
- •Comparing the old and new ARRAY commands
- •Hip, hip, array!
- •Associatively editing
- •Going External
- •Becoming attached to your xrefs
- •Layer-palooza
- •Creating and editing an external reference file
- •Forging an xref path
- •Managing xrefs
- •Blocks, Xrefs, and Drawing Organization
- •Mastering the Raster
- •Attaching a raster image
- •Maintaining your image
- •Theme and Variations: Dynamic Blocks
- •Lights! Parameters!! Actions!!!
- •Manipulating dynamic blocks
- •Maintaining Design Intent
- •Defining terms
- •Forget about drawing with precision!
- •Constrain yourself
- •Understanding Geometric Constraints
- •Applying a little more constraint
- •AutoConstrain yourself!
- •Understanding Dimensional Constraints
- •Practice a little constraint
- •Making your drawing even smarter
- •Using the Parameters Manager
- •Dimensions or constraints — have it both ways!
- •The Internet and AutoCAD: An Overview
- •You send me
- •Send it with eTransmit
- •Rapid eTransmit
- •Bad reception?
- •Help from the Reference Manager
- •Design Web Format — Not Just for the Web
- •All about DWF and DWFx
- •Autodesk Design Review 2013
- •The Drawing Protection Racket
- •Autodesk Weather Forecast: Increasing Cloud
- •Working Solidly in the Cloud
- •Free AutoCAD!
- •Going once, going twice, going 123D
- •Your head planted firmly in the cloud
- •The pros
- •The cons
- •Cloudy with a shower of DWGs
- •AutoCAD 2013 cloud connectivity
- •Tomorrow’s Forecast
- •Understanding 3D Digital Models
- •Tools of the Trade
- •Warp speed ahead
- •Entering the third dimension
- •Untying the Ribbon and opening some palettes
- •Modeling from Above
- •Using 3D coordinate input
- •Using point filters
- •Object snaps and object snap tracking
- •Changing Planes
- •Displaying the UCS icon
- •Adjusting the UCS
- •Navigating the 3D Waters
- •Orbit à go-go
- •Taking a spin around the cube
- •Grabbing the SteeringWheels
- •Visualizing 3D Objects
- •Getting Your 3D Bearings
- •Creating a better 3D template
- •Seeing the world from new viewpoints
- •From Drawing to Modeling in 3D
- •Drawing basic 3D objects
- •Gaining a solid foundation
- •Drawing solid primitives
- •Adding the Third Dimension to 2D Objects
- •Creating 3D objects from 2D drawings
- •Modifying 3D Objects
- •Selecting subobjects
- •Working with gizmos
- •More 3D variants of 2D commands
- •Editing solids
- •Get the 2D Out of Here!
- •A different point of view
- •But wait! There’s more!
- •But wait! There’s less!
- •Do You See What I See?
- •Visualizing the Digital World
- •Adding Lighting
- •Default lighting
- •User-defined lights
- •Sunlight
- •Creating and Applying Materials
- •Defining a Background
- •Rendering a 3D Model
- •Autodesk Feedback Community
- •Autodesk Discussion Groups
- •Autodesk’s Own Bloggers
- •Autodesk University
- •The Autodesk Channel on YouTube
- •The World Wide (CAD) Web
- •Your Local ATC
- •Your Local User Group
- •AUGI
- •Books
- •Price
- •3D Abilities
- •Customization Options
- •Network Licensing
- •Express Tools
- •Parametrics
- •Standards Checking
- •Data Extraction
- •MLINE versus DLINE
- •Profiles
- •Reference Manager
- •And The Good News Is . . .
- •APERTURE
- •DIMASSOC
- •MENUBAR
- •MIRRTEXT
- •OSNAPZ
- •PICKBOX
- •REMEMBERFOLDERS
- •ROLLOVERTIPS
- •TOOLTIPS
- •VISRETAIN
- •And the Bonus Round
- •Index
Chapter 16: The Plot Thickens 355
Creating your first plot style table can be a harrowing experience because you have so many options. Just remember that your most likely reason for creating one is to map screen colors to plotted lineweights (as we describe in greater detail in the next section). Also remember that you may be able to minimize your effort by getting a CTB or STB file from the person who created the drawing that you want to plot.
In Chapter 6, we recommend that you limit yourself to the first 9 Standard AutoCAD Colors when defining layers, and not a patchwork of the 255 colors that AutoCAD makes available. If you follow our advice, your work to create a color-dependent plot style table will be much reduced because you’ll have to assign plot properties for only 9 colors, rather than worrying about 255 of them.
For systematic testing of your CTB files, you can download the file named plot_screening_and_fill_patterns.dwg from the AutoCAD 2010
Sample Files group at www.autodesk.com/autocad-samples (LT users, feel free to help yourselves to this file too — it’s not included with the down-
loads at www.autodesk.com/autocadlt-samples). This drawing shows an array of color swatches for all 255 AutoCAD colors. The layouts (such as Grayscale and Screening 25%) demonstrate how different CTB files attached to the same layout produce radically different results.
Named plot styles hold a lot of promise, but there are at least a couple of places — dimensions and tables, for example — where they don’t work as well as traditional color-based plotting. Dimension properties allow you to assign different colors to dimension lines, extension lines, and text. The purpose for this is to allow different parts of a dimension object to print with different lineweights; for example, you can have your dimension text print with a medium lineweight, the same as your annotation text, while keeping extension and dimension lines to a fine lineweight. But because named plot styles are based on objects or layers, you don’t have that lineweight control over individual dimension components. The same limitation applies to tables, where you can set your text to be one color and your grid lines to be another.
If you really get carried away and decide to take advantage of the 16 millionodd colors in AutoCAD’s True Color or Color Book modes, you’re not going to be controlling lineweights with color-dependent plot styles. CTB plot styles affect the lineweights only of objects that use the traditional 255 colors of the AutoCAD Color Index set. If you want True Color or Color Book colors, use object lineweights or named plot styles to control plotted lineweight.
Plotting through thick and thin
Long ago, manual drafters developed the practice of drawing lines of different thicknesses — lineweights — to distinguish different kinds of objects.
www.it-ebooks.info

356 Part III: If Drawings Could Talk
Manual drafters did it with different technical ink pen nib diameters or with different hardnesses of pencil lead and varying degrees of pressure on the pencil. Because a computer mouse usually doesn’t come with mouse balls of different diameters (and we’re going to resist the urge to jump in with a comment about mouse reproduction, especially because these days, most mice are optical), AutoCAD developers had to figure out how to let users indicate lineweights onscreen and on a plot. They came up with two different ways to indicate lineweight:
Mapping onscreen colors to plotted lineweights: We describe this common approach in Chapter 6.
Displaying lineweights onscreen to match what the user can expect to see on the plot: This approach appeared in AutoCAD 2000.
Controlling plotted lineweights with object lineweights
Plotting object lineweights is trivial, assuming that the person who created the drawing first took the trouble to assign a lineweight property to layers or objects (see Chapter 6 for details). Just make sure that the Plot Object Lineweights check box in the expanded Plot dialog box is selected. You may also want to deselect the Plot with Plot Styles check box because plot styles can override the object lineweights with different plotted lineweights. You can also make these settings in the Page Setup dialog box for the appropriate Layout or Model tab. To access the Page Setup Manager, right-click the Quick View Layouts button on the status bar and choose Page Setup Manager.
Plotting with plodders
Color-as-color and lineweight-as-lineweight |
and subcontractors who haven’t upgraded. In |
|
seem like great ideas, but Autodesk knew when |
summary, the ripple effect of those who need |
|
it added object lineweights back in 1999 that |
to or want to continue using colors-mapped-to- |
|
longtime users of AutoCAD weren’t going to |
lineweights is lasting a long time. Don’t be sur- |
|
abandon the old colors-mapped-to-lineweights |
prised if you find yourself going with the flow |
|
approach overnight. Thus you can still control |
for a while. |
|
plotted lineweight by display color in AutoCAD. |
The default setting in AutoCAD 2013 is to plot |
|
AutoCAD veterans, by and large, have chosen |
||
object lineweights, so that’s the easiest method |
||
to stick with the old way for now. They’ve |
if you don’t have to consider the historical |
|
done so for a variety of reasons, including |
practices or predilections of other people with |
|
inertia, plotting procedures and drawings built |
whom you exchange drawings. Mapping screen |
|
around the old way, third-party applications |
colors to lineweights requires some initial work |
|
that don’t fully support the newer methods, and |
on your part, but after you’ve set up the mapping |
|
the need to exchange drawings with clients |
scheme, the additional effort is minimal. |
|
|
|
www.it-ebooks.info

Chapter 16: The Plot Thickens 357
If you want object lineweights to control plotted lineweights, make sure that the Plot Object Lineweights check box is selected in the Plot Options area of the Plot or Page Setup dialog box. If you don’t want to plot the lineweights assigned to objects, you must deselect both the Plot Object Lineweights and Plot with Plot Styles check boxes in the Plot or Page Setup dialog box. Selecting Plot with Plot Styles selects Plot Object Lineweights as well.
Controlling plotted lineweights with screen colors
To map screen colors to plotted lineweights, you need a color-dependent plot style table (CTB file), as we describe in the earlier section, “Plotting with style.” If you’re plotting a drawing created by someone else, that someone else may be able to supply you with the appropriate CTB file — or, at least, with a PCP or PC2 file from which you can create the CTB file quickly. At the very least, the
creator of the drawing should be able to give you a printed chart showing which plotted lineweight to assign to each AutoCAD screen color. Use the instructions in the “Plotting with style” section to copy or create the required CTB file.
Unfortunately, no industry-wide standards exist for mapping screen colors to plotted lineweights. Different offices do it differently. That’s why it’s so useful to receive a CTB, PCP, or PC2 file with drawings that someone sends you.
After you have the appropriate CTB file stored in your Plot Styles folder, follow these steps to use it:
1.Click the Quick View Layouts button on the status bar to open the Quick View Layouts panel. Move the mouse pointer to the image of model space or the layout that you want to plot.
As you move the pointer over each image panel, icons for the PLOT and PUBLISH commands appear at the upper corners.
2.Click the Plot button in the upper-left corner of the selected image.
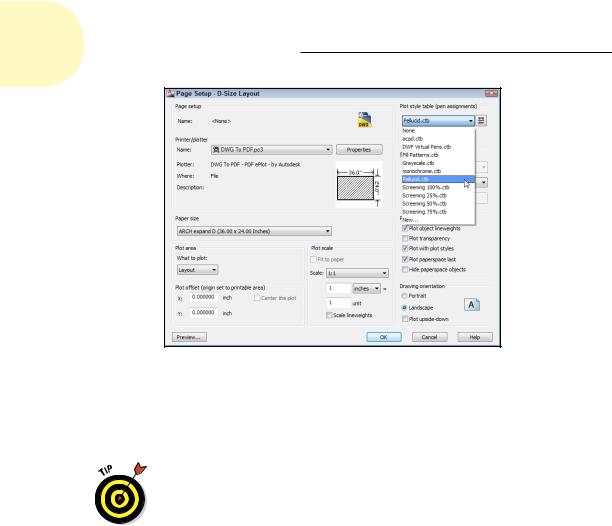
The Plot dialog box opens. Click the More Options button if the dialog box doesn’t open in expanded mode, as shown in Figure 16-8.
3.In the Plot Style Table (Pen Assignments) area on the Plot dialog box, select the CTB file from the drop-down list, as shown in Figure 16-8.
This action attaches the plot style table (CTB file) to the layout or model space tab that you clicked in Step 1.
4.Click the Apply to Layout button.
AutoCAD records the plot setting change with the current layout’s configuration information. Assuming that you save the drawing, AutoCAD uses the CTB that you selected as the default plot style when you (or other people) plot that layout in the future.
5.Continue with the plotting procedures described earlier in this chapter.
www.it-ebooks.info
358 Part III: If Drawings Could Talk
Figure 16-8: Selecting a plot style table that maps screen colors to plotted lineweights.
If your drawing uses a named plot style table instead of a color-dependent plot style table, you follow the same procedure, except that you select an STB file instead of a CTB file in Step 3.
You can tell whether the current drawing was set up to use color-dependent plot styles or named plot styles by looking at the Properties panel on the Ribbon’s Home tab. If the upper-right drop-down list is grayed out, shows ByColor, and doesn’t display a tooltip, the drawing uses color-dependent plot styles. If this list isn’t grayed out and displays the Plot Style tooltip, the drawing uses named plot styles.
Plotting in color
Plotting the colors that you see onscreen requires no special tricks. In the absence of a plot style table (that is, if you selected None from the dropdown list in the Plot Style Table [Pen Assignments] area in the Plot or Page Setup dialog box), AutoCAD sends color information as it appears onscreen to the plotter. As long as your output device can plot in color, what you see should be what you get.
If you attach a plot style table to the layout that you’re plotting (as described in thepreceding section), you can — if you really want to — map screen colors to different plotted colors. In most cases, you don’t want that kind of confusion.
Instead, leave the Color property in the plot style table set to Use Object Color.
www.it-ebooks.info
Chapter 16: The Plot Thickens 359
If your goal is not to plot color, make sure that you set the Color property for all plot styles to Black. If you try to plot colors on a monochrome device, you may find that objects appear in various shades of gray, with lighter colors mapped to lighter shades of gray and darker colors to darker shades of gray. This process of mapping colors to shades of gray is dithering, and it usually is not what you want in a CAD drawing. To override it, use the Plot Style Table Editor, as described in the section “Creating plot styles,” earlier in this chapter, to set the Color option for all colors to Black. (The default setting
is Use Object Color.) If you don’t already have a plot style table that you want to use, select monochrome.ctb for color-based plot styles or select monochrome.stb for named plot styles — both of which come with AutoCAD — from the drop-down list in the Plot Style Table (Pen Assignments) area of the Plot dialog box.
When in doubt, send it out
Whether you plot to scale or not, with different lineweights or not, or in color or not, consider using a service bureau for some of your plotting. In-house plotting on your office’s output devices is great for small check plots on faster laser or inkjet printers. Large-format plotting, on the other hand, can be slow and time consuming. If you need to plot lots of drawings, you may find yourself spending an afternoon loading paper, replenishing ink cartridges, and trimming sheets.
Good plotting service bureaus have big, fast, expensive plotters that you can only dream about owning. Also, they’re responsible for babysitting those fancy devices, feeding them, and fixing them. As a bonus, service bureaus can make blueline prints from your plots if you need to distribute hard-copy sets to other people.
The only downside is that you need to coordinate with a service bureau to make sure that it gets what it needs from you and can deliver the kinds of plots you need. Some service bureaus plot directly from your DWG files while others ask you to make PLT (plot) files. Some service
bureaus specialize in color plotting while others are more comfortable with monochrome plotting and making blueline copies.
When you’re choosing a service bureau, look for one that traditionally has served drafters, architects, and engineers. These service bureaus tend to be more knowledgeable about AutoCAD, and they should have more plotting expertise than the desktop-publishing, printing, and copying shops.
Whomever you choose, do some test plots well before the day that important set of drawings is due. Talk to the plotting people and get a copy of their plotting instructions. Have the service bureau create some plots of a couple of your typical drawings and make sure that they look the way you want them to.
If you do lots of plotting with a service bureau, look into whether you can charge it to your clients as an expense (just like bluelines or copying).
www.it-ebooks.info