

Статистика пожаров / Центр пожарной статистики CTIF / ctif_report10_world_fire_statistics_2005
.pdfWorld fire statistics / Мировая пожарная статистика / Weltfeuerwehrstatistik
Table 9.3: Intentional vehicle fires in selected countries
Таблица 9.3: Умышленные пожары на транспорте в некоторых странах
Tabelle 9.3: Brandstiftung bei Bränden im Transportbereich in ausgewählten Staaten
ENG |
Country |
|
|
Number of intentional vehicle fires and their part (%) of all vehicle fires |
|
|
|
|||||||||||
|
|
1993 |
% |
1994 |
% |
1995 |
% |
1996 |
% |
1997 |
% |
1998 |
% |
1999 |
|
% |
2000 |
% |
RUS |
Страна |
|
Число |
умышленных пожаров на транспорте и их доля (%) от всех пожаров на транспорте |
|
|||||||||||||
|
|
1993 |
% |
1994 |
% |
1995 |
% |
1996 |
% |
1997 |
% |
1998 |
% |
1999 |
|
% |
2000 |
% |
GER |
Staat |
|
Anzahl |
der |
Brandstiftungen im Transportbereich und ihr Anteil (%) an allen Tranport-Bränden |
|
||||||||||||
|
|
1993 |
% |
1994 |
% |
1995 |
% |
1996 |
% |
1997 |
% |
1998 |
% |
1999 |
|
% |
2000 |
% |
1 |
USA |
68200 |
|
66600 |
|
66300 |
|
74400 |
18 |
64500 |
16,2 |
66500 |
17,5 |
58600 |
|
15,9 |
46500 |
13,3 |
2 |
UK |
39800 |
|
34300 |
|
35400 |
|
38300 |
52,6 |
36400 |
51,2 |
42700 |
|
56200 |
|
62,2 |
|
|
Table 9.4: Trends in civilian fire deaths in intentional fires in selected countries in 1993 - 1999
Таблица 9.4: Погибшие при умышленных пожарах в некоторых странах в 1993 - 1999 годах
Tabelle 9.4: Brandtote bei Brandstiftungen in ausgewählten Staaten für 1993-1999
ENG |
Country |
|
|
Number of fire deaths in intentional fires and their part (%) of all fire deaths |
|
|
|||||||||||
|
|
1993 |
% |
|
1994 |
% |
1995 |
% |
1996 |
% |
1997 |
% |
1998 |
% |
|
1999 |
% |
RUS |
Страна |
Число погибших от умышленных пожаров и их доля (%) от общего числа жертв пожаров |
|||||||||||||||
|
|
1993 |
% |
1994 |
% |
1995 |
% |
1996 |
% |
1997 |
% |
1998 |
% |
|
1999 |
% |
|
GER |
Staat |
|
Brandtotenzahlen bei Brandstiftungen und ihr Anteil (%) an der Gesamtzahl der Brandtoten |
|
|||||||||||||
|
|
1993 |
% |
|
1994 |
% |
1995 |
% |
1996 |
% |
1997 |
% |
1998 |
% |
|
1999 |
% |
1 |
USA |
889 |
18,9 |
|
561 |
12,8 |
817 |
17,4 |
757 |
14,9 |
709 |
17,1 |
682 |
16,5 |
|
622 |
16,9 |
2 |
Russia |
1160 |
8,5 |
|
1025 |
6,5 |
966 |
6,5 |
873 |
5,5 |
790 |
5,7 |
640 |
4,7 |
|
622 |
4,2 |
3 |
Japan |
322 |
26,3 |
|
322 |
23,9 |
247 |
17,9 |
283 |
14,0 |
322 |
15,0 |
367 |
17,5 |
|
356 |
16,7 |
4 |
UK |
85 |
12,1 |
|
90 |
14,0 |
108 |
14,7 |
108 |
15,2 |
94 |
13,0 |
84 |
12,8 |
|
94 |
15,1 |
5 |
Canada |
39 |
9,4 |
|
45 |
10,8 |
46 |
10,5 |
34 |
8,4 |
55 |
12,0 |
78 |
21,1 |
|
84 |
19,8 |
6 |
New Zealand |
|
|
|
|
|
|
|
5 |
15,6 |
3 |
5,8 |
9 |
19,1 |
|
|
|
7 |
Korea South |
|
|
|
105 |
18,9 |
156 |
27,3 |
127 |
21,6 |
116 |
20,6 |
112 |
22,2 |
|
|
|
Table 9.5: Trends in civilian fire injuries in intentional fires in selected countries in 1993 - 1999
Таблица 9.5: Травмированные при умышленных пожарах в некоторых странах в 1993 - 1999 годах
Tabelle 9.5: Verletzte Personen bei Brandstiftungen in ausgewählten Staaten für 1993-1999
ENG |
Country |
|
|
Number of fire injuries in intentional fires and their part (%) of all injuried |
|
|
|||||||||||
|
|
|
|
|
|
|
|
|
|
|
|
|
|
|
|
||
|
|
1993 |
% |
1994 |
% |
1995 |
% |
1996 |
% |
1997 |
% |
1998 |
|
% |
|
1999 |
% |
|
|
|
|
Число травмированных при умышленных пожарах и их доля (%) |
|
|
|||||||||||
RUS |
Страна |
|
|
|
от общего числа травмированных при пожарах |
|
|
|
|
||||||||
|
|
1993 |
% |
1994 |
% |
1995 |
% |
1996 |
% |
1997 |
% |
1998 |
|
% |
|
1999 |
% |
|
|
|
|
Anzahl |
der |
bei Brandstiftungen verletzten Personen und ihr Anteil (%) |
|
|
|||||||||
GER |
Staat |
|
|
|
an der Gesamtzahl aller bei Bränden verletzten Personen |
|
|
|
|
||||||||
|
|
1993 |
% |
1994 |
% |
1995 |
% |
1996 |
% |
1997 |
% |
1998 |
|
% |
|
1999 |
% |
1 |
USA |
3583 |
11,8 |
3451 |
12,7 |
2862 |
11,1 |
2917 |
11,4 |
2335 |
9,8 |
2705 |
|
11,7 |
|
2275 |
10,4 |
2 |
UK |
2353 |
|
2822 |
|
2759 |
|
2940 |
|
2718 |
|
2811 |
|
|
|
2796 |
15,4 |
3 |
Canada |
214 |
|
188 |
|
193 |
|
217 |
|
166 |
|
181 |
|
|
|
144 |
6,3 |
4 |
Korea South |
|
|
208 |
15,7 |
271 |
16,4 |
259 |
15,8 |
259 |
15,9 |
288 |
|
16,2 |
|
|
|
10.  - Economic-statistical evaluation of "costs" of fires in the world
The WFSC conducts an annual study, using economic statistics, of the “costs” of fire, including both the losses resulting from fires (direct and indirect damage) and the expenditures made to prevent or reduce losses (e.g., public firefighting forces, fire insurance , and construction features and systems to protect against fire). All costs are normalized for comparison by conversion to percentages of GNP of every country.
The WFSC studies from 1970 through 1999 are the basis of the economic and statistical evaluation of fire «cost» in the modern world in table 10.1 and fig. 10.1.
From table 10.1 it follows that the average total «cost» of fires for the listed 24 countries is 0,8% of GNP. If we take into account the economic
evaluation of deaths and injuries at fires, including pain and suffering, and also the additional cost of scientific research in the field of fire safety, fire technical literature publication, and so on, then the average total «cost» of fires will come to about 1% of GNP.
Table 10.1 lists countries in order of total «cost» of fire. The authors of this report have developed an additional index, «expenditure / losses», which balances fire losses against expenditures to avoid losses. The average of this index for all listed countries is 2,2. This means that on average the expenditures on fire loss prevention and mitigation are approximately twice as large as the actual fire loss. For some countries (e.g. Japan,
Report №10 – CFS of CTIF |
40 |
INTERSCHUTZ 2005 |

World fire statistics / Мировая пожарная статистика / Weltfeuerwehrstatistik
the US and Canada) the index is considerably |
higher (see the right column in table 10.1). |
10.  - Экономико-статистические оценки «стоимости» пожаров в мире
ВЦПС разработал удобную, на наш взгляд, схему экономико-статистической оценки «стоимости» пожаров, учитывающую как общественные потери от пожаров (прямой и косвенный ущербы), так и затраты на борьбу с ними (стоимость содержания пожарной охраны, страхования от пожаров и систем противопожарной защиты зданий). Все эти величины для удобства сравнения выражают в долях валового национального продукта (ВНП) каждой страны.
Обобщение результатов многолетних исследований (за 1970-1999 гг.) ВЦПС позволило нам дать следующую экономикостатистическую оценку «стоимости» пожаров в современном мире (табл. 10.1 и рис. 10.1).
Из табл. 10.1, в частности, следует (нижняя строка), что средняя суммарная «стоимость» пожаров для указанных 24 стран составила 0,8% ВНП. Если учесть экономические оценки гибели и травмирования людей при пожарах, а также дополнительную суммарную стоимость научных исследований в области пожарной безопасности, выпуск пожарно-технической литературы и пр., то общая «стоимость» пожаров составит около 1% ВНП в каждой стране.
Заметим, что именно по суммарной «стоимости» пожаров и проранжированы страны в табл. 10.1. Введенный нами показатель «затраты/потери» для всей совокупности стран равен 2,2. Это означает, что в среднем в каждой стране затраты на борьбу с пожарами (С3+С4+С5) более чем в 2 раза
превышают потери от них (С1+С2). Для отдельных стран (Япония, США, Канада и др.) значения этого показателя существенно выше (см. правый столбец табл. 10.1). Такова «стоимость» пожаров в последней трети ХХ века.
|
A - 14 % |
E - 35 % |
|
|
B - 26 % |
D - 20% |
C - 5 % |
|
Fig. 10.1: Economic-statistical evaluation of "costs" of fire (average for 1970-1999 years)
Рис. 10.1: Экономико-статистические оценки «стоимости» пожаров» (сред. за 1970-1999 гг.)
Bild 10.1: Wirtschaftlich-statistische Einschätzung der "Kosten" der Brände (Mittelwerte für 19701999)
A - Fire insurance /Страхование/ Feuerversicherung
B- Direct losses /Прямой ущерб/ Direkter Schaden
C- Indirect losses /Косвен. Ущерб/ Indirekter Schaden D- Cost of fire service /Содержание ПО/ Unterhalt der Feuerwehren
E- Fire protection in buildings / ППЗ зданий/ Vorbeugender Brandschutz in Gebäuden
10.  - Wirtschaftlich-statistische Einschätzung der "Kosten" der Brände
Das WFSC hat ein unserer Meinung nach praktikables Schema zur wirtschaftlich-statistischen
Einschätzung der “Kosten” von Bränden entwickelt, das sowohl die gesellschaftlichen Verluste durch Brände (direkter und indirekter Brandschaden) als auch die Ausgaben für Brandschutz (Unterhalt der Feuerwehren, Feuerversicherung und Vorbeugender Brandschutz) berücksichtigt. Alle Größen werden aus Gründen der Vergleichbarkeit in Anteilen des Bruttoinlandproduktes (BIP) eines jeden Staates angegeben.
Die Zusammenfassung der Ergebnisse langjähriger Datenerhebungen des WFSC (Zeitraum von 1970 bis 1999) erlaubte es uns, folgende wirtschaftlich-statistische Einschätzung der „Kosten” von Bränden“ in der gegenwärtigen Welt zu geben (Tabelle 10.1 und Bild 10.1).
Aus Tabelle 10.1 folgt, dass die mittleren Gesamt-“Kosten” der Brände in den aufgeführten 24 Staaten 0,8 % des BIP betragen (letzte Zeile der Tabelle). Wenn zusätzlich der wirtschaftliche
Faktor von Brandtoten und –verletzten sowie zusätzliche Gesamtausgaben für den Bereich der wissenschaftlichen Forschungen im Bereich der Brandsicherheit (einschließlich Brandschutzliteratur u.ä.) eingerechnet werden, so erhöhen sich die Gesamt-“Kosten” der Brände auf ca. 1 % des BIP jedes Staates.
Anzumerken ist, dass sich die Rangfolge der Staaten in Tabelle 10.1 namentlich an den Gesamt-“Kosten” der Brände orientiert.
Die von uns eingeführte Kennzahl “Ausgaben/Verluste” beträgt für die Gesamtheit aller berücksichtigten Staaten 2,2. Das bedeutet, dass im Mittel in einem Staat die Ausgaben für den Kampf gegen Brände (С3+С4+С5) etwa 2mal so hoch sind, wie die durch Brände entstehenden Verluste (С1+С2). Für einzelne Staaten (z. B. Japan, USA, Kanada) ist der Wert der Kennzahl noch wesentlich höher (siehe rechte Spalte der
Tabelle 10.1).
Das sind die “Kosten” der Brände im letzten Drittel des ºº. Jahrhunderts.
Report №10 – CFS of CTIF |
2 |
INTERSCHUTZ 2005 |

World fire statistics / Мировая пожарная статистика / Weltfeuerwehrstatistik
Table 10.1: Economic-statistical evaluation of "costs" of fire (average for 1970-1999 years)
Таблица 10.1: Экономико-статистические оценки «стоимости» пожаров (средние за 1970-1999 гг.)
Tabelle 10.1: Wirtschaftlich-statistische Einschätzung der "Kosten" der Brände (Mittelwert für 1970-1999)
|
|
|
Cost in portion of GDP ( % ) |
|
5 |
|
|||
|
|
|
|
Сi |
Expenditure / |
||||
|
|
|
|
|
|
|
i = 1 |
Losses |
|
ENG |
Country |
Direct |
Inderect |
Cost of fire |
Fire |
Fire |
|||
|
|||||||||
protection in |
|
(С3+С4+С5)/ |
|||||||
|
|
losses |
losses |
service |
insurance |
|
|||
|
|
|
(C1+C2) |
||||||
|
|
|
|
|
buildings |
|
|
||
|
|
С1 |
С2 |
С3 |
С4 |
С5 |
|
|
|
|
|
|
Стоимость в долях ВНП ( % ) |
|
5 |
|
|||
|
|
|
|
Сi |
Затраты/ |
||||
|
|
|
|
|
|
|
|||
RUS |
Страна |
Прямой |
Косвен. |
Содержание |
|
Страхо- |
i = 1 |
Потери |
|
|
|
||||||||
пожарной |
ППЗ зданий |
|
(С3+С4+С5)/ |
||||||
|
|
ущерб |
ущерб |
охраны |
|
вание |
|
(C1+C2) |
|
|
|
|
|
|
|
|
|||
|
|
С1 |
С2 |
С3 |
С4 |
С5 |
|
|
|
|
|
|
Kosten in BSP-Anteilen ( % ) |
|
5 |
|
|||
|
|
|
|
Сi |
Ausgaben / |
||||
|
|
|
|
|
|
|
i = 1 |
Verluste |
|
GER |
Staat |
Direkter |
Indirekter |
Unterhalt |
VB in |
Feuerver- |
|||
|
|||||||||
|
(С3+С4+С5)/ |
||||||||
|
|
Schaden |
Schaden |
Feuerwehren |
Gebäuden |
sicherung |
|
||
|
|
|
(C1+C2) |
||||||
|
|
|
|
|
|
|
|
||
|
|
С1 |
С2 |
С3 |
С4 |
С5 |
|
|
|
1 |
Belgium |
0,43 |
0,113 |
0,16 |
0,21 |
0,26 |
1,173 |
1,2 |
|
2 |
Denmark |
0,29 |
0,048 |
0,1 |
0,41 |
0,12 |
0,968 |
1,9 |
|
3 |
Norway |
0,33 |
0,019 |
0,14 |
0,33 |
0,13 |
0,949 |
1,7 |
|
4 |
Luxemburg |
0,53 |
0,133 |
0,09 |
- |
0,17 |
0,923 |
- |
|
5 |
Canada |
0,2 |
0,022 |
0,26 |
0,27 |
0,14 |
0,892 |
3,0 |
|
6 |
Switzerland |
0,18 |
0,079 |
0,11 |
0,37 |
0,15 |
0,889 |
2,4 |
|
7 |
USA |
0,18 |
0,012 |
0,26 |
0,33 |
0,08 |
0,862 |
3,5 |
|
8 |
UK |
0,19 |
0,044 |
0,25 |
0,17 |
0,14 |
0,794 |
2,4 |
|
9 |
New Zealand |
0,25 |
- |
0,17 |
0,16 |
0,21 |
0,790 |
1,9* |
|
10 |
Japan |
0,12 |
0,016 |
0,31 |
0,23 |
0,11 |
0,786 |
4,8 |
|
11 |
Netherlands |
0,19 |
0,031 |
0,16 |
0,22 |
0,15 |
0,751 |
2,4 |
|
12 |
Sweden |
0,23 |
0,019 |
0,23 |
0,16 |
0,07 |
0,709 |
1,8 |
|
13 |
Singapore |
0,09 |
- |
0,03 |
0,55 |
0,03 |
0,700 |
4,7* |
|
14 |
Hungary |
0,1 |
0,029 |
- |
0,56 |
0,01 |
0,699 |
- |
|
15 |
Chehia |
0,09 |
0,037 |
0,36 |
0,18 |
0,01 |
0,677 |
4,0 |
|
16 |
Italy |
0,21 |
0,015 |
0,06 |
0,33 |
0,06 |
0,675 |
2,0 |
|
17 |
France |
0,24 |
0,043 |
0,08 |
0,15 |
0,12 |
0,633 |
1,2 |
|
18 |
Finland |
0,19 |
0,022 |
0,2 |
- |
0,06 |
0,472 |
- |
|
19 |
Austria |
0,19 |
0,029 |
0,11 |
- |
0,14 |
0,469 |
- |
|
20 |
Slovenia |
0,09 |
0,016 |
0,06 |
0,13 |
0,08 |
0,376 |
2,5 |
|
21 |
Germany |
0,18 |
0,036 |
0,07 |
- |
0,08 |
0,366 |
- |
|
22 |
Poland |
0,13 |
- |
0,19 |
- |
- |
0,320 |
- |
|
23 |
Australia |
0,25 |
- |
- |
- |
- |
0,250 |
- |
|
24 |
Spain |
0,15 |
- |
- |
- |
0,05 |
0,200 |
- |
|
|
Avrg./Cред./Mittl. |
0,21 |
0,04 |
0,16 |
0,28 |
0,11 |
0,800 |
2,2 |
|
* - Estimation under average meaning C2 / Оценка при среднем значении С2 / Schätzung mit Mittelwert C2
11.  - Fire experience at the beginning of the 21th century
Using the previously cited fire experience data and projecting based on population, we can now estimate total reported fire experience in the world at the beginning of the XXI.century. See table 11.1 and figs. 11.1 - 11.5.
Table 11.1 presents data from 77 countries containing 4,6 bln. inh., i.e., almost ¾ of the total population of the Earth. This table presents 36 countries of Europe (almost all European countries), 28 countries of Asia, 7 countries of North and South America, 3 countries of Africa and also Australia, New Zealand and Papua New Guinea. In these countries almost 5,5 mln. fires and approximately 55 thous. fire deaths are reported to fire services annually.
Projection based on population implies that 7-8 mln. fires and 70-80 thous. fire deaths are reported annually on the Earth at the beginning of XXI.century. The same methods suggest that 0,5- 0,7 mln. fire injuries are registered on Earth annually, based on projections from fewer countries. Note that the Southern Hemisphere is considerably under-represented in the available data and may show different patterns and fire experience rates.
Fig. 11.1 shows that 55 (71,4%) countries of the 77 providing data have average fires per 1000 inh. no higher than 3 a year, and for 45 countries (59% of all submitted countries) this parameter is no higher than two. In 30 countries,
Report №10 – CFS of CTIF |
42 |
INTERSCHUTZ 2005 |
World fire statistics / Мировая пожарная статистика / Weltfeuerwehrstatistik
mainly in Asia and Africa, the number of fires per 1000 inh. does not exceed 1 a year. At the high end, in such countries as the UK, the US, France, Estonia, Ireland, Barbados, New Zealand, Malta, Luxembourg, Latvia, Cyprus, and Lithuania, this parameter is at least 4.
Fig. 11.2 shows average fire deaths per 100000 inh. per year. Eight of the nine countries with the highest rates are republics of the former Soviet Union; the ninth is Serbia. The other 68 countries have fire death rates relative to population of at most two.
Fig. 11.3 shows fire deaths per 100 fires in 77 countries.
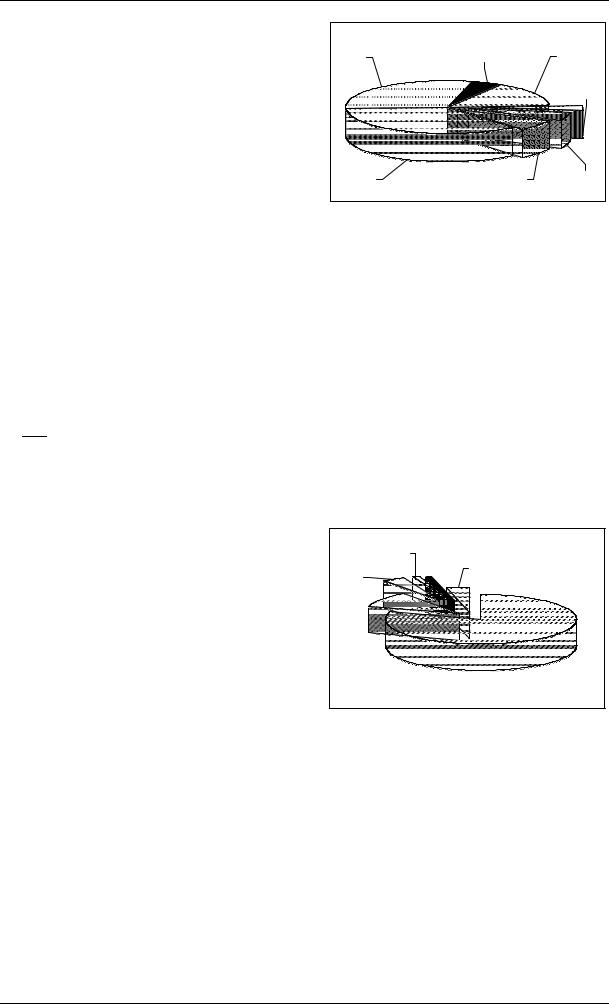
Fig. 11.4 shows fires by fire origin, while fig. 11.5 shows fire deaths by fire origin in the countries of the world.
Fig. 11.6 shows fires by means of extinguishment.
B - 30% |
C - 5% |
D - 15% |
|
|
E - 3% |
A - 35% |
G - 7% |
F - 5% |
Fig. 11.4: General distribution of fires by fire origin in countries of the world
Рис. 11.4: Обобщенное распределение пожаров по местам возникновения в странах мира
Bild 11.4: Verdichtete Struktur der Brandeinsätze der Staaten der Welt
A - Grass, bush, rubbish/Трава, кусты, мусор/Gras, Müll B - Dwelling/Жилые здания/Wohnungen
C - Other buildings/Другие здания/Andere Gebäude D - Vehicle/Автотранспорт/Autotransport
E - Other transport/Другой транспорт/Anderer Transport F - Forests/в лесах/Wald
G - Other/Другие/Sonstige
11.  - Обстановка с пожарами в странах мира в начале XXI. века
Обобщая и усредняя рассмотренные выше статистические данные о пожарах и их жертвах в различных странах, мы можем теперь оценить обстановку с пожарами в странах мира в начале XXI. века. Она представлена в табл.
11.1и на рис. 11.1 - 11.5.
Втабл. 11.1 содержатся данные о 77 странах мира, в которых проживает 4,6 млрд. чел., т.е. почти ¾ всего населения Земли. Здесь представлены 36 стран Европы (практически все европейские страны, за исключением нескольких малых стран), 28 стран Азии, 7 стран Америки, 3 страны Африки, Австралия, Новая Зеландия и Папуа Новая Гвинея.
Вэтих странах в настоящее время ежегодно регистрируется почти 5,5 млн. пожаров, при которых погибает примерно 55 тыс. человек.
Отсюда можно сделать вывод, что на Земле в начале 21 века ежегодно бывает не менее 7-8 млн. пожаров, при которых погибает 70-80 тыс. человек. Учитывая приведенные выше данные о травматизме, можно предположить, что на планете ежегодно при пожарах травмируется 0,5-0,7 млн. человек.
Из рис. 11.1 видно, что 55 стран из 77 (т.е. 71,4%) имеют за год среднее число пожаров на 1000 чел. не превышающее 3, а для 45 стран ( 59% всех представленных стран) этот показатель не больше двух. В 30 странах, в основном Азии и Африки, число пожаров на 1000 чел. в год не превосходит 1. В таких странах как Великобритания, США, Франция, а также - Эстония, Ирландия, Барбадос, Новая
Зеландия, Мальта, Люксембург, Латвия, Кипр, |
|
Литва этот показатель имеет значение не |
|
меньше 4. |
|
D - 1% |
|
E - 1% |
F - 4% |
C - 4% |
|
B - 10% |
|
|
A - 80% |
Fig. 11.5: Distribution of fire deaths by fire origin in the countries of the world
Рис. 11.5: Обобщенное распределение гибели людей по объектам пожаров в странах мира
Bild 11.5: Verdichtete Verteilung der Brandtotenzahlen nach Brandobjekten in den Staaten
A - Dwellings/Жилые здания/Wohnungen
B - Other buildings/Другие здания/Andere Gebäude C - Vehicle/Автотранспорт/Autotransport
D - Other transport/Другой транспорт/Anderer Transport
E – Forest/в лесах/Wald
F - Other/Другие/Sonstiges
На рис. 11.2 представлены данные о среднем числе погибших за год при пожарах на 100 тыс. чел. Здесь первые сверху девять стран
Report №10 – CFS of CTIF |
43 |
INTERSCHUTZ 2005 |

World fire statistics / Мировая пожарная статистика / Weltfeuerwehrstatistik
республики бывшего Советского Союза и |
мире по основным объектам пожаров, а на рис. |
||
Сербии. Все остальные 68 стран имеют |
11.5 отражено обобщенное распределение жертв |
||
значения этого показателя не более двух. |
пожаров по объектам пожаров в мире. |
||
|
|
На рис. 11.3 представлено |
На рис. 11.6 – распределение пожаров |
распределение числа погибших на 100 пожаров |
по способам и средствам их тушения. |
||
в 77 странах. На рис. 11.4 приведено |
|
||
ориентировочное распределение пожаров в |
|
||
11. |
|
- Brandsituation in den Staaten zu Beginn des XXI. Jahrhunderts |
|
|
|||
Die statistische Verdichtung der oben beschriebenen Kenngrößen über die Brände und die Brandopfer in den verschiedenen Staaten ermöglicht es uns, nun die Brandsituation in den Staaten der Erde zu Beginn des XXI. Jahrhunderts insgesamt einzuschätzen. Die zusammenfassende Beurteilung der Situation ist in Tabelle 11.1 und Bild 11.1 – 11.5 dargestellt.
Tabelle 11.1 enthält die Daten aus 77 Staaten der Welt, in denen 4,6 Mrd. Menschen, d.h. fast ¾ der Weltbevölkerung, leben. Hier sind 36 Staaten Europas (praktisch alle Länder mit Ausnahme einiger kleiner Staaten), 28 Staaten Asiens, 7 Staaten Amerikas, 3 Staaten Afrikas sowie Australien, Neuseeland und Papua-Neu Guinea vertreten. In diesen Staaten werden gegenwärtig jährlich fast 5,5 Millionen Brände registriert, bei denen etwa 55.000 Menschen ihr Leben verlieren.
Hieraus ist die Schlussfolgerung zulässig, dass auf der Erde zu Beginn des XXI. Jahrhunderts jährlich nicht weniger als 7-8 Millionen Brände registriert werden, bei denen 70-80.000 Brandtote zu beklagen sind. Unter Berücksichtigung der oben gemachten Ausführungen zur Anzahl der Brandverletzten, ist die Annahme gerechtfertigt, dass auf unserem Planeten jährlich 0,5-0,7 Millionen Brandverletzte zu beklagen sind.
Bild 11.1 verdeutlicht, dass 55 der 77 angeführten Staaten, d.h. 71.4%, im Jahresmittel eine Brandrate von nicht mehr als 3 Bränden je 1.000 Einwohner aufweisen. Für 45 Staaten, d.h. für 59% aller vorgestellten Staaten, ist die Brandrate nicht größer als 2 Brände je 1.000 Einwohner. In 30 Staaten, hauptsächlich Länder Asiens und Afrikas, beträgt die Brandrate jährlich nicht mehr als 1 Brand je 1.000 Einwohner. In einer Reihe von Staaten – Großbritannien, den USA, Frankreich und sogar in Estland, Irland, auf Barbados, Neuseeland, auf Malta, in Luxemburg, Lettland, auf Zypern und Litauen - ist die Brandrate größer 4 Brände je 1.000 Einwohner.
In Bild 11.2 wird die mittlere jährliche Brandtotenrate je 100.000 Einwohner vorgestellt.
Die ersten neun oberen Plätze nehmen Republiken der ehemaligen Sowjetunion und Serbien ein. Alle anderen 68 Staaten weisen eine Brandtotenrate von nicht mehr als 2 auf.
E - 1% |
F - 0% |
G - 5% |
D - 3% |
|
|
|
|
A - 35% |
C - 17% |
|
|
B - 39% |
|
|
Fig. 11.6: Distribution of fires by means of their extinguishment in the countries of the world
Рис. 11.6: Обобщенное распределение потушенных пожаров по средствам тушения в странах мира
Bild 11.6: Verteilung der verwendeten Geräte bei der Brandbekämpfung
A - Small equipments/Первичными средствами / Kleinlöschgeräte
B- 1 jet/1-м стволом/1 Strahlrohr
C- 2-3 jets/2-3-мя стволами/2-3 Strahlrohre
D- More than 3 jets/более 3-х стволов/mehr als 3 Strahlrohre
E- Foam jets/Пенн.стволами/Schaumrohre
F- Powder jets/Порошковые стволы/Pulverrohre
G- Before arrival fire units/до прибытия пожарных/vor
Eintreffen der Feuerwehr
Bild 11.3 stellt die Brandtotenrate bezogen auf je 100 Brände für 77 Staaten vor. In Bild 11.4 wird die wahrscheinliche Verteilung der Brände auf die grundlegenden Brandobjekte und in Bild 11.5 die Verteilung der Opferzahlen nach Brandobjekten präsentiert. Abschließend spiegelt Bild 11.6 die Verteilung der wesentlichen Löschmittel und Löschmethoden bei der Brandbekämpfung wider.
Report №10 – CFS of CTIF |
44 |
INTERSCHUTZ 2005 |

World fire statistics / Мировая пожарная статистика / Weltfeuerwehrstatistik
Estonia
UK
Ireland
Barbados
USA
Israel
Portugal
France
New Zealand
Australia
Malta
Bulgaria
Luxemburg
Italy
Latvia
Lithuania
Cyprus
Poland
Austria
Greece
Denmark
Netherlands
Hungary
Sweden
Norway
Brunei
Slovenia
Belarus
Germany
Finland
Switzerland
Belgium
Canada
Slovakia
Croatia
Czechia
Kuwait
Russia
Iceland
Brasil
Cuba
Singapore
Serbia
Ukraine
South Africa
Spain
Turkey
Georgia
Mexico
Kazakhstan
Korea South
Mongolia
Iran
Moldova
Taiwan
Malaysia
Uzbekistan
Kyrgyzstan
Armenia
Romania
Tunis
Algeria
Japan
Nicaragua
Azerbaijan
Iraq
Syria
Sri Lanka
Thailand
Tajikistan
India
China
Indonesia
Korea North
Papua New Guinea
Laos
Vietnam
0 |
1 |
2 |
3 |
4 |
5 |
6 |
7 |
8 |
9 |
Fig. 11.1: Average annual number of fires per 1000 inh. in the countries
Рис. 11.1: Среднее число пожаров в год на 1000 чел. в странах
Bild 11.1: Mittlere Brandanzahl je Jahr pro 1000 Einwohner
Report №10 – CFS of CTIF |
45 |
INTERSCHUTZ 2005 |

World fire statistics / Мировая пожарная статистика / Weltfeuerwehrstatistik
Russia
Estonia
Latvia
Belarus
Ukraine
Lithuania
Kazakhstan
Moldova
Serbia
South Africa
Kyrgyzstan
Japan
Slovenia
Denmark
Mongolia
Poland
Hungary
Sweden
USA
Cyprus
Bulgaria
India
Brunei
Canada
Norway
Ireland
Finland
Taiwan
Korea South
Georgia
France
UK
New Zealand
Czechia
Slovakia
Romania
Austria
Croatia
Uzbekistan
Belgium
Sri Lanka
Mexico
Italy
Australia
Germany
Spain
Greece
Azerbaijan
Malta
Portugal
Switzerland
Syria
Korea North
Kuwait
Israel
Iran
Netherlands
Tajikistan
Barbados
Iceland
Tunis
Malaysia
Indonesia
Nicaragua
Armenia
Turkey
Brasil
Cuba
Luxemburg
Iraq
China
Algeria
Singapore
Papua New
Vietnam
Thailand
Laos
0 |
2 |
4 |
6 |
8 |
10 |
12 |
Fig. 11.2: Average number of fire deaths a year per 100000 inh. in the countries
Рис. 11.2: Среднее число погибших в год на 100000 чел. в странах
Bild 11.2: Mittlere Brandtotenzahlen je Jahr pro 100000 Einwohner
Report №10 – CFS of CTIF |
46 |
INTERSCHUTZ 2005 |

World fire statistics / Мировая пожарная статистика / Weltfeuerwehrstatistik
Russia
India
Ukraine
Moldova
Vietnam
Kazakhstan
Belarus
Japan
Korea North
Sri Lanka
Kyrgyzstan
Latvia
Mongolia
Indonesia
Serbia
South Africa
Tajikistan
Taiwan
Syria
Lithuania
Romania
Estonia
Azerbaijan
Korea South
Uzbekistan
Georgia
Papua New Guinea
China
Nicaragua
Mexico
Canada
Iraq
Slovenia
Tunis
Czechia
Spain
Iran
Finland
Brunei
Armenia
Slovakia
Laos
Sweden
Denmark
Hungary
Malaysia
Norway
Croatia
Belgium
Poland
Algeria
Cyprus
Bulgaria
Turkey
Germany
Thailand
Kuwait
Switzerland
Austria
USA
Iceland
Cuba
Brasil
France
New Zealand
Greece
Italy
Ireland
Australia
UK
Netherlands
Singapore
Malta
Portugal
Israel
Barbados
Luxemburg
0 |
1 |
2 |
3 |
4 |
5 |
6 |
7 |
Fig. 11.3: Average number of fire deaths a year per 100 fires in the countries
Рис. 11.3: Среднее число погибших в год на 100 пожаров в странах
Bild 11.3: Mittlere Brandtotenzahlen je Jahr pro 100 Brände
Report №10 – CFS of CTIF |
47 |
INTERSCHUTZ 2005 |

World fire statistics / Мировая пожарная статистика / Weltfeuerwehrstatistik
Table 11.1: Total reported fire experience in the world at the beginning of the 21th century
Таблица 11.1: Обобщенные данные по числу пожаров и погибших в странах мира в начале XXI. века
Tabelle 11.1: Gesamtübersicht zur Brandsituation auf der Welt zu Beginn des XXI. Jahrhunderts
|
|
Population |
Average number per year: |
Average number |
Average number of fire deaths: |
||
ENG |
Country |
thous.inh. |
fires |
fire deaths |
of fires |
per |
per |
|
|
|
thous. |
inh. |
per 1000 inh. |
100000 inh. |
100 fires |
|
|
Население |
Среднее |
число в год: |
Среднее число |
Среднее число |
погибших в год: |
RUS |
Страна |
тыс. чел. |
пожаров, |
погибших, |
пожаров |
на |
на |
|
|
|
тыс. |
чел. |
на 1000 чел. |
100000 чел. |
100 пож. |
|
|
Einwohner |
Mittelwert je Jahr: |
Mittlere |
Mittlere |
Brandtotenanzahl: |
|
GER |
Staat |
in 1000 |
Brände |
Brandtote |
Brandanzahl |
auf |
auf |
|
|
|
in 1000 |
|
je 1000 Einw. |
100000 Einw. |
100 Brände |
1 |
China |
1300000 |
250 |
2500 |
0,2 |
0,2 |
1,0 |
2 |
India |
1030000 |
200 |
13000 |
0,2 |
1,3 |
6,5 |
3 |
USA |
283000 |
1700 |
3700 |
6,0 |
1,3 |
0,2 |
4 |
Indonesia |
232000 |
35 |
700 |
0,2 |
0,3 |
2,0 |
5 |
Brasil |
175000 |
250 |
500 |
1,4 |
0,3 |
0,2 |
6 |
Russia |
145000 |
250 |
17000 |
1,7 |
11,7 |
6,8 |
7 |
Japan |
128000 |
61 |
2100 |
0,5 |
1,6 |
3,4 |
8 |
Mexico |
103000 |
100 |
750 |
1,0 |
0,7 |
0,8 |
9 |
Germany |
83000 |
200 |
550 |
2,4 |
0,7 |
0,3 |
10 |
Vietnam |
81000 |
1,3 |
70 |
0,0 |
0,1 |
5,4 |
11 |
Turkey |
67000 |
70 |
200 |
1,0 |
0,3 |
0,3 |
12 |
Iran |
66130 |
45 |
250 |
0,7 |
0,4 |
0,6 |
13 |
Thailand |
62000 |
15 |
40 |
0,2 |
0,1 |
0,3 |
14 |
UK |
60000 |
500 |
630 |
8,3 |
1,1 |
0,1 |
15 |
France |
59000 |
330 |
650 |
5,6 |
1,1 |
0,2 |
16 |
Italy |
58000 |
250 |
400 |
4,3 |
0,7 |
0,2 |
17 |
Ukraine |
49000 |
58 |
3500 |
1,2 |
7,1 |
6,0 |
18 |
Korea South |
48000 |
41 |
530 |
0,9 |
1,1 |
1,3 |
19 |
South Africa |
44000 |
50 |
850 |
1,1 |
1,9 |
1,7 |
20 |
Spain |
40000 |
45 |
260 |
1,1 |
0,7 |
0,6 |
21 |
Poland |
39000 |
145 |
550 |
3,7 |
1,4 |
0,4 |
22 |
Canada |
32000 |
60 |
400 |
1,9 |
1,3 |
0,7 |
23 |
Algeria |
32000 |
16 |
60 |
0,5 |
0,2 |
0,4 |
24 |
Uzbekistan |
25000 |
16 |
200 |
0,6 |
0,8 |
1,3 |
25 |
Iraq |
24000 |
8 |
50 |
0,3 |
0,2 |
0,6 |
26 |
Malaysia |
23000 |
15 |
70 |
0,7 |
0,3 |
0,5 |
27 |
Romania |
22500 |
13 |
200 |
0,6 |
0,9 |
1,5 |
28 |
Taiwan |
22500 |
15 |
250 |
0,7 |
1,1 |
1,7 |
29 |
Korea North |
22000 |
3 |
100 |
0,1 |
0,5 |
3,3 |
30 |
Australia |
19500 |
100 |
130 |
5,1 |
0,7 |
0,1 |
31 |
Sri Lanka |
19500 |
5 |
150 |
0,3 |
0,8 |
3,0 |
32 |
Syria |
17000 |
5 |
80 |
0,3 |
0,5 |
1,6 |
33 |
Kazakhstan |
16500 |
16 |
700 |
1,0 |
4,2 |
4,4 |
34 |
Netherlands |
16000 |
50 |
60 |
3,1 |
0,4 |
0,1 |
35 |
Cuba |
11200 |
15 |
30 |
1,3 |
0,3 |
0,2 |
36 |
Greece |
10700 |
37 |
65 |
3,5 |
0,6 |
0,2 |
37 |
Czechia |
10300 |
18 |
105 |
1,7 |
1,0 |
0,6 |
38 |
Belgium |
10300 |
20 |
80 |
1,9 |
0,8 |
0,4 |
39 |
Belarus |
10200 |
25 |
900 |
2,5 |
8,8 |
3,6 |
40 |
Hungary |
10100 |
30 |
140 |
3,0 |
1,4 |
0,5 |
41 |
Serbia |
10000 |
13 |
250 |
1,3 |
2,5 |
1,9 |
42 |
Portugal |
10000 |
55 |
50 |
5,5 |
0,5 |
0,1 |
43 |
Tunis |
9800 |
5 |
30 |
0,5 |
0,3 |
0,6 |
44 |
Sweden |
8900 |
25 |
120 |
2,8 |
1,3 |
0,5 |
45 |
Austria |
8000 |
30 |
70 |
3,8 |
0,9 |
0,2 |
46 |
Bulgaria |
7900 |
35 |
100 |
4,4 |
1,3 |
0,3 |
47 |
Azerbaijan |
7800 |
3 |
40 |
0,4 |
0,5 |
1,3 |
48 |
Switzerland |
7300 |
15 |
35 |
2,1 |
0,5 |
0,2 |
49 |
Tajikistan |
6700 |
1,5 |
25 |
0,2 |
0,4 |
1,7 |
50 |
Israel |
6000 |
35 |
25 |
5,8 |
0,4 |
0,1 |
51 |
Laos |
5800 |
0,4 |
2 |
0,1 |
0,0 |
0,5 |
52 |
Slovakia |
5400 |
10 |
50 |
1,9 |
0,9 |
0,5 |
53 |
Denmark |
5350 |
17 |
80 |
3,2 |
1,5 |
0,5 |
54 |
Finland |
5200 |
11 |
60 |
2,1 |
1,2 |
0,5 |
55 |
Georgia |
5200 |
5 |
55 |
1,0 |
1,1 |
1,1 |
56 |
Papua New Guinea |
5100 |
0,5 |
5 |
0,1 |
0,1 |
1,0 |
57 |
Nicaragua |
5000 |
2 |
15 |
0,4 |
0,3 |
0,8 |
58 |
Kyrgyzstan |
4800 |
3 |
80 |
0,6 |
1,7 |
2,7 |
59 |
Norway |
4500 |
12 |
55 |
2,7 |
1,2 |
0,5 |
60 |
Singapore |
4500 |
6 |
7 |
1,3 |
0,2 |
0,1 |
61 |
Moldova |
4430 |
3 |
175 |
0,7 |
4,0 |
5,8 |
62 |
Croatia |
4350 |
8 |
35 |
1,8 |
0,8 |
0,4 |
63 |
Ireland |
3900 |
30 |
45 |
7,7 |
1,2 |
0,2 |
64 |
New Zealand |
3900 |
21 |
40 |
5,4 |
1,0 |
0,2 |
65 |
Lithuania |
3600 |
15 |
235 |
4,2 |
6,5 |
1,6 |
66 |
Armenia |
3350 |
2 |
10 |
0,6 |
0,3 |
0,5 |
67 |
Mongolia |
2700 |
2 |
40 |
0,7 |
1,5 |
2,0 |
68 |
Latvia |
2400 |
10 |
250 |
4,2 |
10,4 |
2,5 |
69 |
Kuwait |
2300 |
4 |
10 |
1,7 |
0,4 |
0,3 |
70 |
Slovenia |
2000 |
5 |
30 |
2,5 |
1,5 |
0,6 |
71 |
Estonia |
1450 |
12 |
160 |
8,3 |
11,0 |
1,3 |
72 |
Cyprus |
765 |
3 |
10 |
3,9 |
1,3 |
0,3 |
73 |
Luxemburg |
445 |
2 |
1 |
4,5 |
0,2 |
0,1 |
74 |
Malta |
400 |
2 |
2 |
5,0 |
0,5 |
0,1 |
75 |
Brunei |
400 |
1 |
5 |
2,5 |
1,3 |
0,5 |
76 |
Iceland |
300 |
0,5 |
1 |
1,7 |
0,3 |
0,2 |
77 |
Barbados |
275 |
2 |
1 |
7,3 |
0,4 |
0,1 |
|
Total/Итого/Gesamt |
4642300 |
5470,2 |
54704 |
1,2 |
1,2 |
1,0 |
Report №10 – CFS of CTIF |
48 |
INTERSCHUTZ 2005 |

World fire statistics / Мировая пожарная статистика / Weltfeuerwehrstatistik
12.  - Statistics of the fire service in the countries of the world
Tab. 12.1 and figs. 12.1 - 12.3 show numbers and rates of firefighters in the fire services of 41 countries.
The combined population of these countries is 2,6 bln. inh. (40% of the population of the Earth). In these countries 4,3 mln. fires are reported annually (57% of all fires). The fire services in these countries include 16,4 mln. firefighters, with 1,5 mln. career firefighters (80 thous. part time) and 14,9 mln. volunteers. These
fire services also have 170 thous. fire stations, 200 thous. engines and almost 18 thous. ladders.
Fig. 12.1 shows the number of inhabitants per firefighter (career or volunteer). The overall average is 164 inh.
Fig. 12.2 shows the distribution of inhabitants per career firefighter, where the average is 2000 inh.
Fig. 12.3 shows the distribution per volunteer firefighter, where the average is 174 inh.
12. |
|
- Параметры противопожарных служб в странах мира |
|
|
|
В табл. 12.1 и на рис. 12.1 - 12.3 |
На рис. 12.1 представлено |
отражены абсолютные и относительные |
распределение числа жителей на 1 пожарного в |
||
параметры противопожарных служб 41 страны |
странах мира (сюда входят и |
||
мира. |
|
профессиональные, и добровольные пожарные, |
|
|
|
В них проживают почти 2,6 млрд. |
и так называемые совместители, которым |
человек (41% населения Земли), в которых |
оплачивается только работа на пожарах). |
||
ежегодно регистрируют 4,3 млн. пожаров (57% |
Среднее число жителей на одного пожарного в |
||
всех пожаров на планете). С этими пожарами |
этом случае составляет 164 человек. |
||
всего борются не менее 16,4 млн. пожарных, из |
На рис. 12.2 изображено аналогичное |
||
которых примерно 1,5 млн. профессионалов, 80 |
распределение, на одного профессионального |
||
тыс. совместителей и 14,9 млн. добровольцев. |
пожарного. В этом случае среднее число |
||
Таким образом, профессионалы составляют 10% |
жителей приходящихся на профессионального |
||
от общего числа пожарных в этих странах. Это |
пожарного, в рассмотренных 41 странах равно |
||
содружество пожарных располагает не менее, |
почти 2000 человек. |
||
чем 170 тыс. пожарных депо, 200 тыс. |
На рис. 12.3 изображено аналогичное |
||
автонасосов (автоцистерн) и 18 тыс. |
распределение, на одного добровольного |
||
автолестниц (коленчатых и подъемников). |
пожарного (среднее значение составляет 174 |
||
|
|
|
человека). |
12. |
|
- Parameter der Feuerwehren in den Staaten |
|
|
|
||
Tabelle 12.1 und Bild 12.1 - 12.3 stellen die absoluten und relativen Parameter der Feuerwehren in 41 Staaten der Welt vor.
In diesen Staaten leben fast 2,6 Milliarden Menschen (41% der Weltbevölkerung). Dort werden jährlich 4,3 Mio. Brände, d.h. 57% aller Brände auf unserem Planeten, registriert. Mit der Brandbekämpfung sind nicht weniger als 16,4 Millionen Feuerwehrleute, davon etwa 1,5 Mio. Berufsfeuerwehrleute, 80.000 Feuerwehrleute in Teilzeit und 14,9 Mio. Freiwillige Feuerwehrleute, beschäftigt. Somit beträgt der Anteil der Berufsfeuerwehrleute 10% an der Gesamtpersonalstärke der Feuerwehren in diesen Staaten. Dieser Feuerwehrgemeinschaft stehen nicht weniger als 170.000 Feuerwachen, 200.000 Löschfahrzeuge (LF, TLF) und 18.000 Hubrettungsgeräte (Drehleitern, Hubsteiger) zur Verfügung.
Bild 12.1 stellt die Einwohnerrate je 1 Feuerwehrmann in den Staaten der Erde vor. Hierbei wurden sowohl Berufsfeuerwehrleute, Freiwillige Feuerwehrleute als auch die Teilzeitfeuerwehrleute (sie erhalten eine Bezahlung nur für die Zeit des Brandeinsatzes) berücksichtigt. Die mittlere Einwohnerrate je 1 Feuerwehrmann (FM) beträgt unter diesen Bedingungen 164 Einwohner je 1 FM.
Bild 12.2 stellt die analoge Einwohnerrate je 1 Berufsfeuerwehrmann in den Staaten der Erde vor. Die mittlere Einwohnerrate je 1 Feuerwehrmann (FM) beträgt unter diesen Bedingungen für die 41 betrachteten Staaten fast 2.000 Einwohner je 1 FM.
Bild 12.3 zeigt die analoge Einwohnerrate je 1 Freiwilliger Feuerwehrmann in den Staaten der Erde. Die mittlere Einwohnerrate je 1 Feuerwehrmann (FM) beträgt unter diesen Bedingungen fast 174 Einwohner je 1 FM.
Report №10 – CFS of CTIF |
49 |
INTERSCHUTZ 2005 |