

2.3. Analysis of company’s current assets for the previous periods
Consider the structure of the company's balance sheet (see Appendix 2), namely, the proportion of current assets to total assets of the enterprise.
As it can be seen at the figures 2.3.1 and 2.3.2, proportion of current assets in balance sheet structure is more than 70%, with the largest portion of current assets of accounts receivable. This can be explained by the fact that state and departmental businesses constitute the bulk of customers of the enterprise.
Figure 2.3.1. Structure of balance sheet of SPETSSTROY-SVYAZ Ltd for 2005-2009
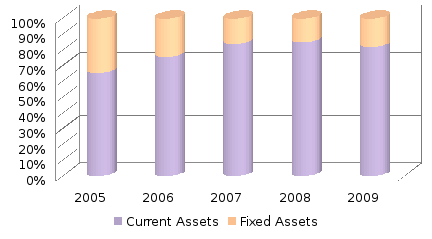
Figure 2.3.2. Structure of current assets of SPETSSTROY-SVYAZ Ltd for 2005-2009
In order to study the structure of current assets the total structure (the proportion of stocks in total assets, receivables in current assets, cash in current assets, etc.) and internal (the proportion of stocks of work in progress in the overall value of stocks, long-term receivables debt in the total value of accounts receivable, etc.) are to be evaluated.
In 2005 the largest share in total current assets took receivables (short term). In 2006 this indicator increased by 62%. This shows that the organization increased its sales over the period. Favorable here is that the receivables are short-term (current). However at less significant change in the proportion of the absolute value of receivables in the coming years has increased. And in 2009 it was 426% of the amount in 2005, with sales in 2009 amounted to 157% of sales in 2005.
For a more detailed analysis it is necessary to investigate the quantity, composition, structure and dynamics of its individual species, their turnover. Analyzed production requires stocks, as evidenced by the share of stocks in the total value of current assets.
Figure 2.3.3. Dynamics of change of the proportion of components of current assets
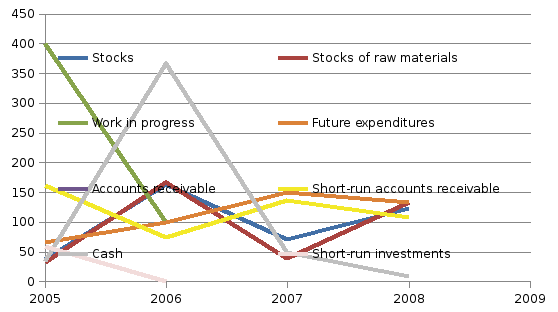
It can be observed at figure 2.3.3 that in 2007 the largest changes referred to the share of cash. When considering sales for a calendar year seasonality can be observed. In the first quarter customers form a portfolio, and in the fourth quarter there are the highest sales. In 2007, a large amount of cash was received in the last days of the year, making it difficult to use it.
It can also be noticed that in 2008 great changes have taken place in the dynamics of proportion change of work in progress. In 2007 in the enterprise there was implemented a new type of activity, development activities (R & D). Residues in progress - is an incomplete implementation phase of R&D. Since this type of activity is on average 5% in total sales the figures for the unfinished product does not have a major impact on the turnover of working capital.
The primary measure of effectiveness of working capital is the rate of turnover. Calculation of turnover of any assets is held by dividing the revenue of the period by the average value of these assets over the period. Since the company's revenue is formed as cumulative total for the year and the cost of an asset is the torque figure (i.e. the value on the balance sheet date), the comparison of turnover indicators for different time intervals (for example, a year and the first quarter) is incorrect. In this regard, an analysis of turnover indicators based on annual data for 2005-2009 is held.
Table 2.3.1. Main turnover ratios
|
Turnover ratio |
Calculation |
2005 |
2006 |
2007 |
2008 |
2009 |
|
Revenues from sales |
R |
174 518 |
224 694 |
231 177 |
300 786 |
273 712 |
|
Rate of turnover of current assets |
d3=R/CA |
4,77 |
3,27 |
2,3 |
2,78 |
3,12 |
|
Rate of turnover in inventories |
d4=Сosts/Reserves |
12,13 |
19,54 |
9,74 |
16,13 |
14,03 |
|
The average time of turnover of accounts receivable |
d5=365/d6 |
35,64 |
84,69 |
89,02 |
99,46 |
96,82 |
|
Accounts receivable turnover |
d6 = В/(LTAR+STAR) |
10,24 |
4,31 |
4,1 |
3,67 |
3,77 |
|
The average time of turnover of material resources |
d7=365/d4 |
30,09 |
18,68 |
37,47 |
22,63 |
26,02 |
|
Duration of turnover of accounts payable |
d9=365/d8 |
74,19 |
120,07 |
82,77 |
142,58 |
97,07 |
Turnover ratio reflects the turnover rate of the material resources of the company during the analyzed period (how many rubles of turnover (revenue) account for every ruble of this type of asset).
Turnover of current assets or rate of turnover is a key indicator of the effectiveness of management, business activities and organization. Ratio characterizes the efficiency of use of all current assets, regardless of the source of their involvement, shows how much money units of products sold brought each monetary unit of current assets. In 2007-2008, the company increased revenue, but nonetheless turnover ratio of current assets has not increased. This is due to an increase in the average period of accounts receivable turnover. In 2008-2009, it was more than 3 months.
Inventory turnover ratio shows number of turns of reserves and expenses for the period analyzed. Ratio indicates the rate at which stocks move into the category of receivables resulting from the sale of finished products. Slow inventory turnover indicates the presence of obsolete stocks. Over the period 2007-2009 average period of turnover in inventories tended to decline, despite the fact that in 2009 supply of raw materials and increased.
Accounts receivable turnover indicates its rate of turnover. The term of receivables turnover indicates how many days on average takes debt repayment. At the end of 2009 term of turnover of receivables was 97 days. This figure increased by 2.7 times compared with 2005 despite the fact that revenues from sales for the period increased by only 1.6 times. This negatively characterizes the activities of the company.
Capital in process of production include: work in progress, semi-proper development and deferred expenses. Consider future expenditures:
Table 2.3.2. Proportion of future expenditures
|
Proportion |
2005 |
2006 |
2007 |
2008 |
2009 |
|
Licenses |
13,9 |
9,86 |
7,59 |
9,4 |
6,12 |
|
Certification |
78,87 |
79,3 |
70,85 |
59,46 |
81,55 |
|
Costs for participation in govermental tenders |
0 |
1,39 |
1,14 |
1,56 |
0,77 |
|
Insurance |
1,05 |
2,96 |
3,36 |
3,93 |
2,8 |
|
Software |
0 |
6,33 |
11,16 |
21,9 |
8,66 |
Figure 2.3.4. Future expenditures for 2005-2009
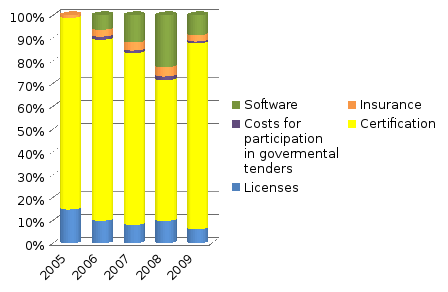
It can be seen in figure 2.3.4 that almost all kinds of future expenditures of the enterprise transfer their value to newly created products in the form overhead costs. The greatest share amounts to certification and licensing. The total share of these costs in revenue increased from 0.5% to 1% in 4 considered years. Large company's costs of certification and licensing of developed and manufactured products indicate that the state exercises strict control over the quality of wireline equipment in Russia.