
Varian Microeconomics Workout
.pdf
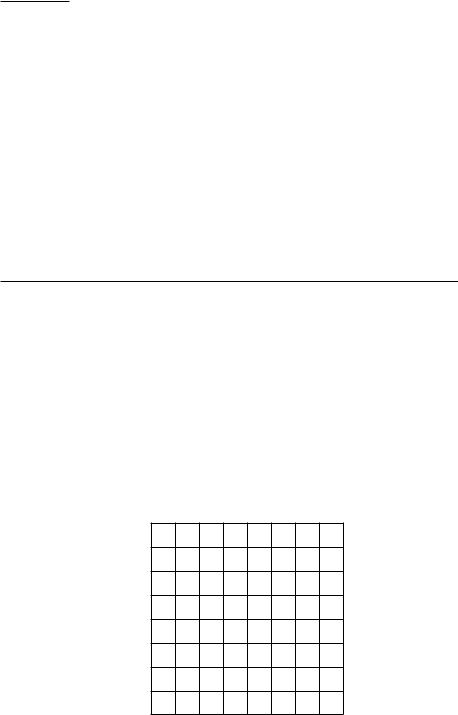
(a) On the graph below, use blue ink to draw the demand curve and the
supply curve. The equilibrium market price is |
|
|
|
and the equilib- |
|||||||||
rium quantity sold is |
|
|
|
|
|
|
|
|
|
|
|
. |
|
Price |
|
|
|
|
|
||||||||
40 |
|
|
|
|
|
|
|
|
|
|
|
|
|
|
|
|
|
|
|
|
|
|
|
|
|
||
30 |
|
|
|
|
|
|
|
|
|
|
|
|
|
|
|
|
|
|
|
|
|
|
|
|
|
||
|
|
|
|
|
|
|
|
|
|
|
|
||
20 |
|
|
|
|
|
|
|
|
|
|
|
|
|
|
|
|
|
|
|
|
|
|
|
|
|
||
|
|
|
|
|
|
|
|
|
|
|
|
||
10 |
|
|
|
|
|
|
|
|
|
|
|
|
|
|
|
|
|
|
|
|
|
|
|
|
|
||
|
|
|
|
|
|
|
|
|
|
|
|
||
|
|
|
|
|
|
|
|
|
|
|
|
|
|
|
|
|
|
|
|
|
|
|
|
|
|
|
|
050 100 150 200
Quantity of cod¯sh
(b) A quantity tax of $2 per unit sold is placed on salted cod¯sh. Use red ink to draw the new supply curve, where the price on the vertical axis remains the price per unit paid by demanders. The new equilibrium
price paid by the demanders will be |
|
and the new price received |
|||||
by the suppliers will be |
|
The equilibrium quantity sold will be |
|||||
|
|
|
|
|
|
|
. |
|
|
|
|
|
|
|
|
(c) The deadweight loss due to this tax will be |
|
On your |
|||||
|
|||||||
graph, shade in the area that represents the deadweight loss. |
|
|
|||||
16.5 (0) The demand function for merino ewes is D(P ) = 100=P , and the supply function is S(P ) = P .
(a) What is the equilibrium price? |
|
. |
(b) What is the equilibrium quantity? |
|
. |
(c) An ad valorem tax of 300% is imposed on merino ewes so that the price paid by demanders is four times the price received by suppliers. What is the equilibrium price paid by the demanders for merino ewes now?
What is the equilibrium price received by the suppliers for
merino ewes? |
|
What is the equilibrium quantity? |
|
. |
16.6 (0) Schrecklich and LaMerde are two justi¯ably obscure nineteenthcentury impressionist painters. The world's total stock of paintings by Schrecklich is 100, and the world's stock of paintings by LaMerde is 150. The two painters are regarded by connoisseurs as being very similar in style. Therefore the demand for either painter's work depends both on its own price and the price of the other painter's work. The demand function for Schrecklichs is DS(P ) = 200¡4PS ¡2PL, and the demand function for LaMerdes is DL(P ) = 200 ¡ 3PL ¡ PS, where PS and PL are respectively the price in dollars of a Schrecklich painting and a LaMerde painting.
(a) Write down two simultaneous equations that state the equilibrium condition that the demand for each painter's work equals supply.
.
(b) Solving these two equations, one ¯nds that the equilibrium price of
Schrecklichs is |
|
and the equilibrium price of LaMerdes is |
|
. |
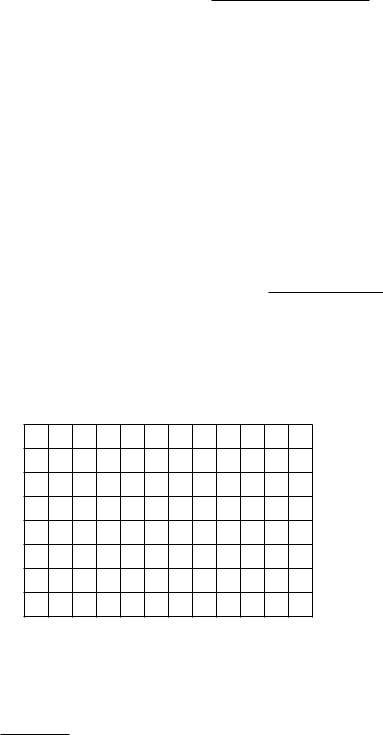
(c) On the diagram below, draw a line that represents all combinations of prices for Schrecklichs and LaMerdes such that the supply of Schrecklichs equals the demand for Schrecklichs. Draw a second line that represents those price combinations at which the demand for LaMerdes equals the supply of LaMerdes. Label the unique price combination at which both markets clear with the letter E.
PL
40
30
20
10
0 |
10 |
20 |
30 |
40 |
|
|
|
|
PS |
(d) A ¯re in a bowling alley in Hamtramck, Michigan, destroyed one of the world's largest collections of works by Schrecklich. The ¯re destroyed a total of 10 Schrecklichs. After the ¯re, the equilibrium price of Schreck-
lichs was |
|
and the equilibrium price of LaMerdes was |
|
. |
(e) On the diagram you drew above, use red ink to draw a line that shows the locus of price combinations at which the demand for Schrecklichs equals the supply of Schrecklichs after the ¯re. On your diagram, label the new equilibrium combination of prices E0.
16.7 (0) The price elasticity of demand for oatmeal is constant and equal to ¡1. When the price of oatmeal is $10 per unit, the total amount demanded is 6,000 units.
(a) Write an equation for the demand function.
Graph this demand function below with blue ink. (Hint: If the demand curve has a constant price elasticity equal to ², then D(p) = ap² for some constant a. You have to use the data of the problem to solve for the constants a and ² that apply in this particular case.)
Price
20 |
|
|
|
|
|
|
15 |
|
|
|
|
|
|
10 |
|
|
|
|
|
|
5 |
|
|
|
|
|
|
0 |
2 |
4 |
6 |
8 |
10 |
12 |
|
|
|
|
Quantity (thousands) |
||
(b) If the supply is perfectly inelastic at 5,000 units, what is the equilib-
rium price? Show the supply curve on your graph and label the equilibrium with an E.
(c) Suppose that the demand curve shifts outward by 10%. Write down
the new equation for the demand function. |
|
Suppose |
that the supply curve remains vertical but shifts to the right by 5%. Solve
for the new equilibrium price |
|
and quantity |
|
. |

(d) By what percentage approximately did the equilibrium price rise?
Use red ink to draw the new demand curve and the new supply curve on your graph.
(e) Suppose that in the above problem the demand curve shifts outward by x% and the supply curve shifts right by y%. By approximately what
percentage will the equilibrium price rise? |
|
. |
16.8 (0) An economic historian* reports that econometric studies indicate for the pre{Civil War period, 1820{1860, the price elasticity of demand for cotton from the American South was approximately ¡1. Due to the rapid expansion of the British textile industry, the demand curve for American cotton is estimated to have shifted outward by about 5% per year during this entire period.
(a) If during this period, cotton production in the United States grew by 3% per year, what (approximately) must be the rate of change of the
price of cotton during this period? |
|
. |
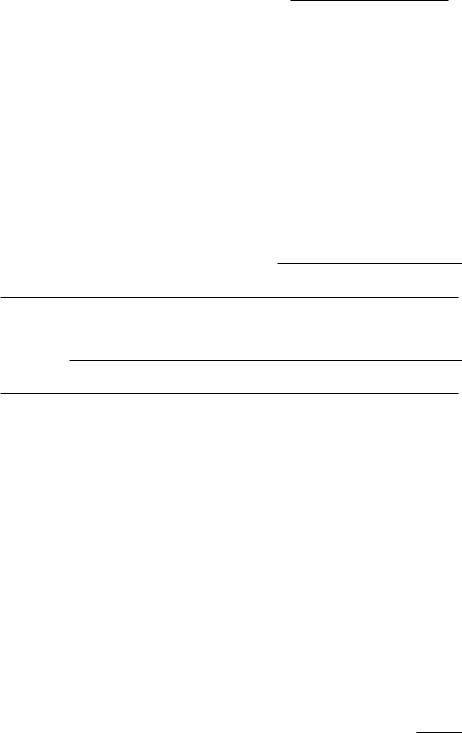
(b) Assuming a constant price elasticity of ¡1, and assuming that when the price is $20, the quantity is also 20, graph the demand curve for
cotton. What is the total revenue when the price is $20?
What is the total revenue when the price is $10? |
|
. |
Price of cotton
40
30
20
10
0 |
10 |
20 |
30 |
40 |
|
|
Quantity of cotton |
||
* Gavin Wright, The Political Economy of the Cotton South, W. W. Norton, 1978.
(c) If the change in the quantity of cotton supplied by the United States is to be interpreted as a movement along an upward-sloping long-run supply curve, what would the elasticity of supply have to be? (Hint: From 1820
to 1860 quantity rose by about 3% per year and price rose by |
|
% |
per year. [See your earlier answer.] If the quantity change is a movement along the long-run supply curve, then the long-run price elasticity must
be what?) |
|
. |
(d) The American Civil War, beginning in 1861, had a devastating e®ect on cotton production in the South. Production fell by about 50% and remained at that level throughout the war. What would you predict
would be the e®ect on the price of cotton?
.
(e) What would be the e®ect on total revenue of cotton farmers in
the South?
.
(f) The expansion of the British textile industry ended in the 1860s, and for the remainder of the nineteenth century, the demand curve for American cotton remained approximately unchanged. By about 1900, the South approximately regained its prewar output level. What do you think
happened to cotton prices then? |
|
. |
16.9 (0) The number of bottles of chardonnay demanded per year is $1; 000; 000 ¡ 60; 000P , where P is the price per bottle (in U.S. dollars). The number of bottles supplied is 40; 000P .
(a) What is the equilibrium price? |
|
What is the equilibrium |
||
quantity? |
|
|
. |
|
(b) Suppose that the government introduces a new tax such that the wine maker must pay a tax of $5 per bottle for every bottle that he
produces. What is the new equilibrium price paid by consumers?
|
What is the new price received by suppliers? |
|
What is |
||
|
|
||||
the new equilibrium quantity? |
|
|
. |
||
16.10 (0) The inverse demand function for bananas is Pd = 18 ¡ 3Qd and the inverse supply function is Ps = 6+Qs, where prices are measured in cents.
(a) If there are no taxes or subsidies, what is the equilibrium quantity?
What is the equilibrium market price? |
|
. |
(b) If a subsidy of 2 cents per pound is paid to banana growers, then in equilibrium it still must be that the quantity demanded equals the quantity supplied, but now the price received by sellers is 2 cents higher than the price paid by consumers. What is the new equilibrium quantity?
What is the new equilibrium price received by suppliers?
What is the new equilibrium price paid by demanders?
.
(c) Express the change in price as a percentage of the original price.
If the cross-elasticity of demand between bananas and apples is +.5, what will happen to the quantity of apples demanded as a consequence of the banana subsidy, if the price of apples stays constant?
(State your answer in terms of percentage change.) |
|
. |
16.11 (1) King Kanuta rules a small tropical island, Nutting Atoll, whose primary crop is coconuts. If the price of coconuts is P , then King Kanuta's subjects will demand D(P ) = 1; 200 ¡ 100P coconuts per week for their own use. The number of coconuts that will be supplied per week by the island's coconut growers is S(p) = 100P .
(a) The equilibrium price of coconuts will be |
|
and the equilib- |
||
rium quantity supplied will be |
|
|
. |
|
(b) One day, King Kanuta decided to tax his subjects in order to collect coconuts for the Royal Larder. The king required that every subject who consumed a coconut would have to pay a coconut to the king as a tax. Thus, if a subject wanted 5 coconuts for himself, he would have to purchase 10 coconuts and give 5 to the king. When the price that is received by the sellers is pS, how much does it cost one of the king's
subjects to get an extra coconut for himself? |
|
. |
(c) When the price paid to suppliers is pS, how many coconuts will the king's subjects demand for their own consumption? (Hint: Express pD in
terms of pS and substitute into the demand function.)
.
(d) Since the king consumes a coconut for every coconut consumed by the subjects, the total amount demanded by the king and his subjects is twice the amount demanded by the subjects. Therefore, when the price received by suppliers is pS, the total number of coconuts demanded per
week by Kanuta and his subjects is |
|
|
|
|
|
. |
|
|
|
|
|
|
|||
(e) Solve for the equilibrium value of pS |
|
|
, the equilibrium total |
||||
|
|
||||||
number of coconuts produced |
|
|
, and the equilibrium total number |
||||
of coconuts consumed by Kanuta's subjects. |
|
|
. |
||||
(f) King Kanuta's subjects resented paying the extra coconuts to the king, and whispers of revolution spread through the palace. Worried by the hostile atmosphere, the king changed the coconut tax. Now, the shopkeepers who sold the coconuts would be responsible for paying the tax. For every coconut sold to a consumer, the shopkeeper would have
to pay one coconut to the king. This plan resulted in
coconuts being sold to the consumers. The shopkeepers got
per coconut after paying their tax to the king, and the consumers paid a
price of |
|
per coconut. |
16.12 (1) On August 29, 2005, Hurricane Katrina caused severe damage to oil installations in the Gulf of Mexico. Although this damage could eventually be repaired, it resulted in a substantial reduction in the short run supply of gasoline in the United States. In many areas, retail gasoline prices quickly rose by about 30% to an average of $3.06 per gallon.
Georgia governor Sonny Perdue suspended his state's 7.5 cents-a- gallon gas tax and 4% sales tax on gasoline purchases until Oct. 1. Governor Perdue explained that, \I believe it is absolutely wrong for the state to reap a tax windfall in this time of urgency and tragedy." Lawmakers in several other states were considering similar actions.
Let us apply supply and demand analysis to this problem. Before the hurricane, the United States consumed about 180 million gallons of gasoline per day, of which about 30 million gallons came from the Gulf of Mexico. In the short run, the supply of gasoline is extremely inelastic and is limited by re¯nery and transport capacity. Let us assume that the daily short run supply of gasoline was perfectly inelastic at 180 million gallons before the storm and perfectly inelastic at 150 million gallons after the storm. Suppose that the demand function, measured in millions of gallons per day, is given by Q = 240 ¡ 30P where P is the dollar price, including tax, that consumers pay for gasoline.
(a) What was the market equilibrium price for gasoline before the hurri-
cane? |
|
After the hurricane? |
|
. |
|
|
(b) Suppose that both before and after the hurricane, a government tax of 10 cents is charged for every gallon of gasoline sold in the United States. How much money would suppliers receive per gallon of gasoline before the
hurricane? |
|
After the hurricane? |
|
. |
(c) Suppose that after the hurricane, the federal government removed the gas tax. What would then be the equilibrium price paid by consumers?
|
|
How much money would suppliers receive per gallon of gaso- |
|||||
line? |
|
|
How much revenue would the government lose per day |
||||
by removing the tax? |
|
|
What is the net e®ect of removing |
||||
the tax on gasoline prices? |
|
|
Who are the gainers |
||||
and who are the losers from removing the tax?
.
(d) Suppose that after the hurricane, the ten-cent tax is removed in some states but not in others. The states where the tax is removed constitute just half of the demand in the United States. Thus the demand schedule in each half of the country is Q = 120 ¡ 15P where P is the price paid by consumers in that part of the country. Let P ¤ be the equilibrium price for consumers in the part of the country where the tax is removed. In equilibrium, suppliers must receive the same price per gallon in all parts of the country. Therefore the equilibrium price for consumers in states that keep the tax must be $P ¤ + $0:10. In equilibrium it must be that the total amount of gasoline demanded in the two parts of the country equals the total supply. Write an equation for total de-
mand as a function of P ¤. Set demand equal to supply and solve for the price paid by consumers in the states
that remove the tax |
|
and for the price paid by consumers in |
||
|
||||
states that do not remove the tax. |
|
How much money |
||
do suppliers receive per gallon of gasoline sold in every state?
How does the tax removal a®ect daily gasoline consumption in
each group of states?
.

(e) If half of the states remove the gasoline tax, as described above, some groups will be better o® and some worse o® than they would be if the tax were left in place. Describe the gains or losses for each of the following groups.
Consumers in the states that remove the tax |
|
|
|
|
||
|
|
|
. |
|||
|
|
|
|
|
|
|
Consumers in other states |
|
|
|
. |
||
Gasoline suppliers |
|
|
|
. |
||
Governments of the states that remove the tax |
|
|
|
|||
|
|
|
|
|
|
. |
Governments of states that do not remove the tax |
|
|||||
|
|
|||||
|
|
|
|
|
|
. |
