
Varian Microeconomics Workout
.pdf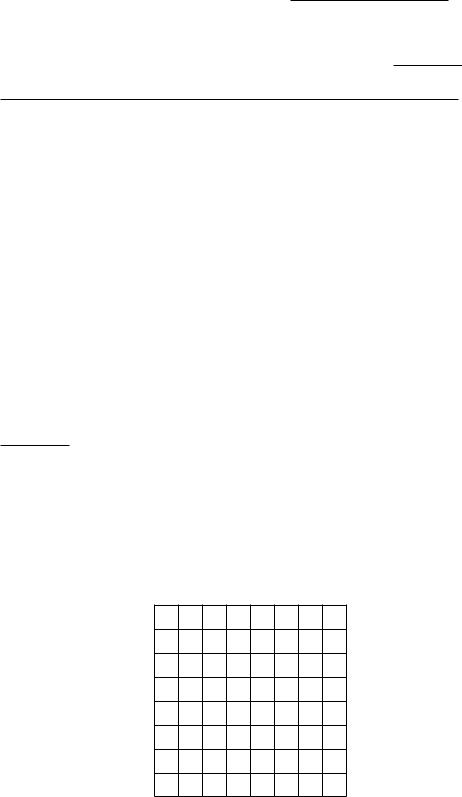
(a) Suppose that Molly's income is m1 in period 1 and m2 in period 2.
Write down her budget constraint in terms of present values.
.
(b) We want to compare this budget constraint to one of the standard
form. In terms of Molly's budget constraint, what is p1? |
|
What |
||||
|
||||||
is p2? |
|
What is m? |
|
|
. |
|
|
|
|
||||
(c) If a = :2, solve for Molly's demand functions for consumption in each period as a function of m1, m2, and r. Her demand function for con-
sumption in period 1 is c1 = |
|
|
|
|
Her demand function |
|||||
|
|
|
|
|||||||
for consumption in period 2 is c2 = |
|
|
|
|
|
. |
|
|||
|
|
|
|
|
||||||
(d) An increase in the interest rate will |
|
|
her period-1 con- |
|||||||
sumption. It will |
|
|
her period-2 consumption and |
|
|
|||||
her savings in period 1.
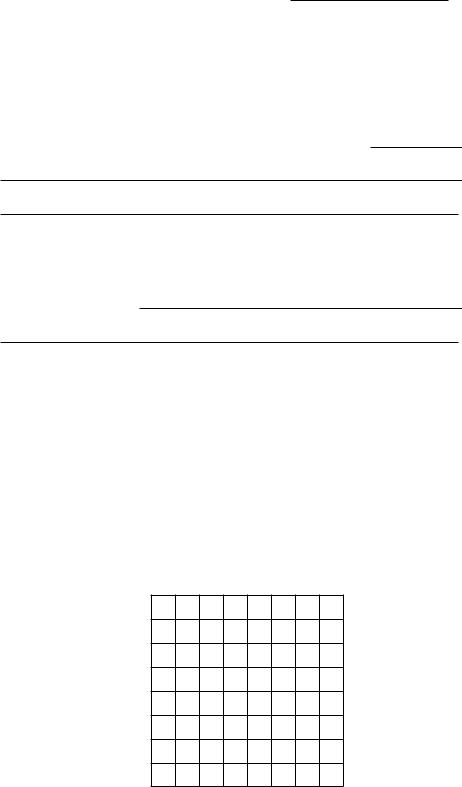
10.3 (0) Nickleby has an income of $2,000 this year, and he expects an income of $1,100 next year. He can borrow and lend money at an interest rate of 10%. Consumption goods cost $1 per unit this year and there is no in°ation.
Consumption next year in 1,000s
4
3
2
1
0 1 2 3 4 Consumption this year in 1,000s

(a) What is the present value of Nickleby's endowment?
What is the future value of his endowment? With blue ink, show the combinations of consumption this year and consumption next year that he can a®ord. Label Nickelby's endowment with the letter
E.
(b) Suppose that Nickleby has the utility function U(C1; C2) = C1C2. Write an expression for Nickleby's marginal rate of substitution between consumption this year and consumption next year. (Your answer will be
a function of the |
variables C1; C2.) |
|
|
|
. |
|
|
|
|||
(c) What is the |
slope of Nickleby's budget line? |
|
Write |
||
an equation that states that the slope of Nickleby's indi®erence curve is equal to the slope of his budget line when the interest rate is 10%.
Also write down Nickleby's budget equation.
|
|
|
|
|
|
|
. |
(d) Solve these two equations. Nickleby will consume |
|
|
units |
||||
|
|
||||||
in period 1 and |
|
units in period 2. Label this point A on your |
|||||
diagram. |
|
|
|
|
|
|
|
(e) Will he borrow or save in the ¯rst period? |
|
|
How much? |
||||
|
|
|
|
|
. |
||
(f) On your graph use red ink to show what Nickleby's budget line would be if the interest rate rose to 20%. Knowing that Nickleby chose the point A at a 10% interest rate, even without knowing his utility function, you can determine that his new choice cannot be on certain parts of his new budget line. Draw a squiggly mark over the part of his new budget line where that choice can not be. (Hint: Close your eyes and think of WARP.)
(g) Solve for Nickleby's optimal choice when the interest rate is 20%.
Nickleby will consume |
|
units in period 1 and |
|
|
units |
||
in period 2. |
|
|
|
|
|
|
|
(h) Will he borrow or save in the ¯rst period? |
|
|
How much? |
||||
|
|
|
|
|
. |
||
10.4 (0) Decide whether each of the following statements is true or false. Then explain why your answer is correct, based on the Slutsky decomposition into income and substitution e®ects.
(a) \If both current and future consumption are normal goods, an increase
in the interest rate will necessarily make a saver save more."
.
(b) \If both current and future consumption are normal goods, an increase in the interest rate will necessarily make a saver choose more consumption
in the second period."
.
10.5 (1) Laertes has an endowment of $20 each period. He can borrow money at an interest rate of 200%, and he can lend money at a rate of 0%. (Note: If the interest rate is 0%, for every dollar that you save, you get back $1 in the next period. If the interest rate is 200%, then for every dollar you borrow, you have to pay back $3 in the next period.)
(a) Use blue ink to illustrate his budget set in the graph below. (Hint: The boundary of the budget set is not a single straight line.)
C2
40
30
20
10
0 |
10 |
20 |
30 |
40 |
|
|
|
|
C1 |
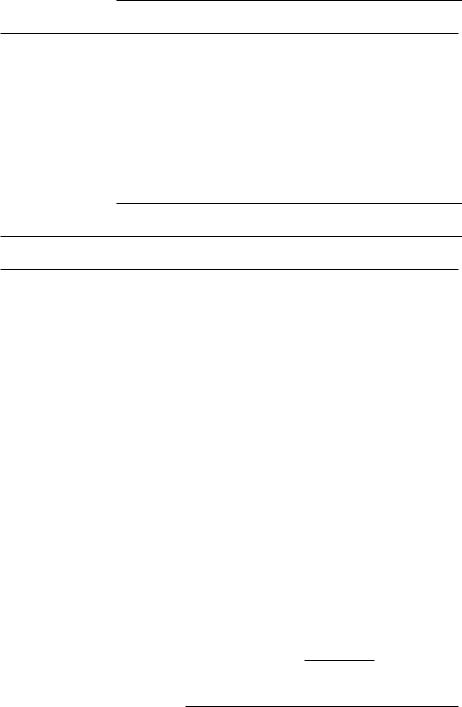
(b) Laertes could invest in a project that would leave him with m1 = 30 and m2 = 15. Besides investing in the project, he can still borrow at 200% interest or lend at 0% interest. Use red ink to draw the new budget set in the graph above. Would Laertes be better o® or worse o® by investing in this project given his possibilities for borrowing or lending? Or can't one tell without knowing something about his pref-
erences? Explain.
.
(c) Consider an alternative project that would leave Laertes with the endowment m1 = 15, m2 = 30. Again suppose he can borrow and lend as above. But if he chooses this project, he can't do the ¯rst project. Use pencil or black ink to draw the budget set available to Laertes if he chooses this project. Is Laertes better o® or worse o® by choosing this project than if he didn't choose either project? Or can't one tell without knowing more about his pref-
erences? Explain.
.
10.6 (0) The table below reports the in°ation rate and the annual rate of return on treasury bills in several countries for the years 1984 and 1985.
In°ation Rate and Interest Rate for Selected Countries
|
% In°ation |
% In°ation |
% Interest |
% Interest |
Country |
Rate, 1984 |
Rate, 1985 |
Rate, 1984 |
Rate, 1985 |
|
|
|
|
|
United States |
3.6 |
1.9 |
9.6 |
7.5 |
Israel |
304.6 |
48.1 |
217.3 |
210.1 |
Switzerland |
3.1 |
0.8 |
3.6 |
4.1 |
W. Germany |
2.2 |
¡0:2 |
5.3 |
4.2 |
Italy |
9.2 |
5.8 |
15.3 |
13.9 |
Argentina |
90.0 |
672.2 |
NA |
NA |
Japan |
0.6 |
2.0 |
NA |
NA |
(a)In the table below, use the formula that your textbook gives for the exact real rate of interest to compute the exact real rates of interest.
(b)What would the nominal rate of return on a bond in Argentina have
to be to give a real rate of return of 5% in 1985? What would the nominal rate of return on a bond in Japan have to be to give a real
rate of return of 5% in 1985? .

(c) Subtracting the in°ation rate from the nominal rate of return gives a good approximation to the real rate for countries with a low rate of in°ation. For the United States in 1984, the approximation gives you
while the more exact method suggested by the text gives you
But for countries with very high in°ation this is a poor ap-
proximation. The approximation gives you |
|
|
for Israel in 1984, |
|
while the more exact formula gives you |
|
|
|
For Argentina in |
1985, the approximation would tell us that a bond yielding a nominal rate
of |
|
|
|
would yield a real interest rate of 5%. This contrasts with |
||||
the answer |
|
|
|
that you found above. |
||||
Real Rates of Interest in 1984 and 1985 |
||||||||
|
|
|
|
|
|
|||
|
Country |
|
1984 |
1985 |
|
|||
|
|
|
|
|
||||
|
United States |
|
|
|
|
|||
|
|
|
|
|
|
|
||
|
Israel |
|
|
|
|
|
||
|
|
|
|
|
||||
|
Switzerland |
|
|
|
|
|||
|
|
|
|
|
||||
|
W. Germany |
|
|
|
|
|||
|
|
|
|
|
|
|
||
|
Italy |
|
|
|
|
|
||
|
|
|
|
|
|
|
|
|
10.7 (0) We return to the planet Mungo. On Mungo, macroeconomists and bankers are jolly, clever creatures, and there are two kinds of money, red money and blue money. Recall that to buy something in Mungo you have to pay for it twice, once with blue money and once with red money. Everything has a blue-money price and a red-money price, and nobody is ever allowed to trade one kind of money for the other. There is a bluemoney bank where you can borrow and lend blue money at a 50% annual interest rate. There is a red-money bank where you can borrow and lend red money at a 25% annual interest rate.
A Mungoan named Jane consumes only one commodity, ambrosia, but it must decide how to allocate its consumption between this year and next year. Jane's income this year is 100 blue currency units and no red currency units. Next year, its income will be 100 red currency units and no blue currency units. The blue currency price of ambrosia is one b.c.u. per °agon this year and will be two b.c.u.'s per °agon next year. The red currency price of ambrosia is one r.c.u. per °agon this year and will be the same next year.
(a) If Jane spent all of its blue income in the ¯rst period, it would be
enough to pay the blue price for °agons of ambrosia. If Jane saved all of this year's blue income at the blue-money bank, it would
have |
|
b.c.u.'s next year. This would give it enough blue currency |
||
to pay the blue price for |
|
°agons of ambrosia. On the graph |
||
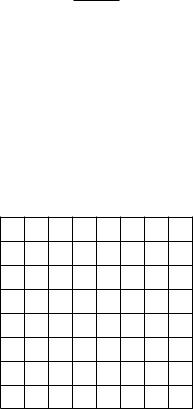
below, draw Jane's blue budget line, depicting all of those combinations of current and next period's consumption that it has enough blue income to buy.
Ambrosia next period
100
75
50
25
0 |
25 |
50 |
75 |
100 |
|
|
Ambrosia this period |
||
(b) If Jane planned to spend no red income in the next period and to borrow as much red currency as it can pay back with interest with next
period's red income, how much red currency could it borrow? |
|
. |
(c) The (exact) real rate of interest on blue money is |
|
The |
||
|
||||
real rate of interest on red money is |
|
|
. |
|
(d) On the axes below, draw Jane's blue budget line and its red budget line. Shade in all of those combinations of current and future ambrosia consumption that Jane can a®ord given that it has to pay with both currencies.
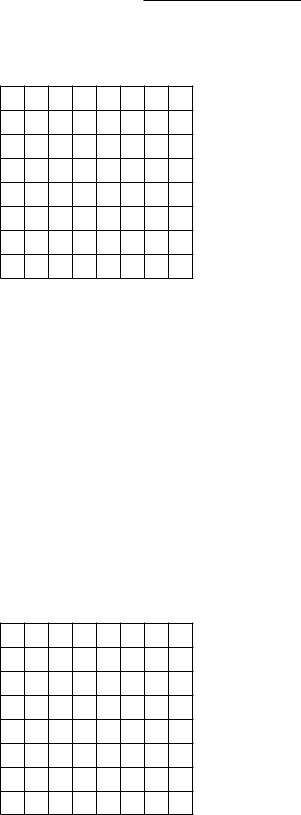
Ambrosia next period
100
75
50
25
0 |
25 |
50 |
75 |
100 |
|
|
Ambrosia this period |
||
(e) It turns out that Jane ¯nds it optimal to operate on its blue budget line and beneath its red budget line. Find such a point on your graph and mark it with a C.
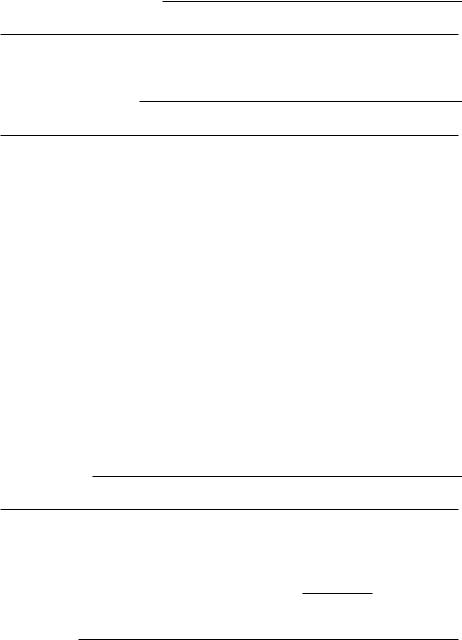
(f) On the following graph, show what happens to Jane's original budget set if the blue interest rate rises and the red interest rate does not change. On your graph, shade in the part of the new budget line where Jane's new demand could possibly be. (Hint: Apply the principle of revealed preference. Think about what bundles were available but rejected when Jane chose to consume at C before the change in blue interest rates.)
Ambrosia next period
100
75
50
25
0 |
25 |
50 |
75 |
100 |
|
|
Ambrosia this period |
||
10.8 (0) Mr. O. B. Kandle will only live for two periods. In the ¯rst period he will earn $50,000. In the second period he will retire and live on his savings. His utility function is U(c1; c2) = c1c2, where c1 is consumption in period 1 and c2 is consumption in period 2. He can borrow and lend at the interest rate r = :10.
(a) If the interest rate rises, will his period-1 consumption increase, de-
crease, or stay the same?
.
(b) Would an increase in the interest rate make him consume more or less
in the second period?
.
(c) If Mr. Kandle's income is zero in period 1, and $ 55,000 in period 2, would an increase in the interest rate make him consume more, less, or
the same amount in period 1? |
|
. |
10.9 (1) Harvey Habit's utility function is U(c1; c2) = minfc1; c2g, where c1 is his consumption of bread in period 1 and c2 is his consumption of bread in period 2. The price of bread is $1 per loaf in period 1. The interest rate is 21%. Harvey earns $2,000 in period 1 and he will earn $1,100 in period 2.
(a) Write Harvey's budget constraint in terms of future value, assuming
no in°ation. |
|
. |
(b) How much bread does Harvey consume in the ¯rst period and how much money does he save? (The answer is not necessar-
ily an integer.)
.
(c) Suppose that Harvey's money income in both periods is the same as before, the interest rate is still 21%, but there is a 10% in°ation rate.
Then in period 2, a loaf of bread will cost $ Write down Harvey's budget equation for period-1 and period-2 bread, given this new
information. .
10.10 (2) In an isolated mountain village, the only crop is corn. Good harvests alternate with bad harvests. This year the harvest will be 1,000 bushels. Next year it will be 150 bushels. There is no trade with the
outside world. Corn can be stored from one year to the next, but rats will eat 25% of what is stored in a year. The villagers have Cobb-Douglas utility functions, U(c1; c2) = c1c2 where c1 is consumption this year, and c2 is consumption next year.
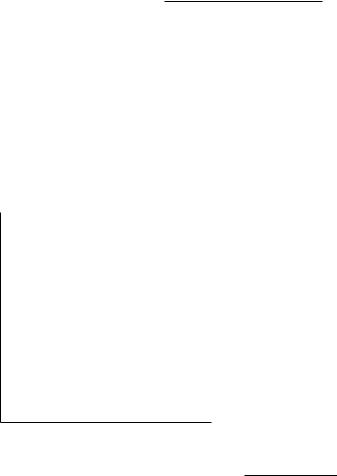
(a) Use red ink to draw a \budget line," showing consumption possibilities for the village, with this year's consumption on the horizontal axis and next year's consumption on the vertical axis. Put numbers on your graph to show where the budget line hits the axes.
(b) How much corn will the villagers consume this year?
|
How much will the rats eat? |
|
How much corn |
||
will the villagers consume next year? |
|
|
. |
||
|
|
||||
(c) Suppose that a road is built to the village so that now the village is able to trade with the rest of the world. Now the villagers are able to buy and sell corn at the world price, which is $1 per bushel. They are also able to borrow and lend money at an interest rate of 10%. On your graph, use blue ink to draw the new budget line for the villagers. Solve for the
amount they would now consume in the ¯rst period |
|
and |
||
the second period |
|
|
. |
|
|
|
|||
(d) Suppose that all is as in the last part of the question except that there is a transportation cost of $.10 per bushel for every bushel of grain hauled into or out of the village. On your graph, use black ink or pencil to draw the budget line for the village under these circumstances.
10.11 (0) The table below records percentage interest rates and in°ation rates for the United States in some recent years. Complete this table.

In°ation and Interest in the United States, 1965-1985
Year |
1965 |
1970 |
1975 |
1978 |
1980 |
1985 |
|
|
|
|
|
|
|
CPI, Start of Year |
38.3 |
47.1 |
66.3 |
79.2 |
100.0 |
130.0 |
|
|
|
|
|
|
|
CPI, End of Year |
39.4 |
49.2 |
69.1 |
88.1 |
110.4 |
133 |
|
|
|
|
|
|
|
% In°ation Rate |
2.9 |
4.3 |
4.2 |
11.3 |
|
|
|
|
|
|
|
|
|
Nominal Int. Rate |
4.0 |
6.4 |
5.8 |
7.2 |
11.6 |
7.5 |
|
|
|
|
|
|
|
Real Int. Rate |
1.1 |
2.1 |
1.6 |
|
|
|
|
|
|
|
|
|
|
(a) People complained a great deal about the high interest rates in the late 70s. In fact, interest rates had never reached such heights in modern
times. Explain why such complaints are misleading.
.
(b) If you gave up a unit of consumption goods at the beginning of 1985 and saved your money at interest, you could use the proceeds of your
saving to buy |
|
units of consumption goods at the beginning |
|||
|
|||||
of |
1986. If you gave up a unit of consumption goods at the beginning |
||||
of |
1978 and saved your money at interest, you would be able to use the |
||||
proceeds of your saving to buy |
|
units of consumption goods at |
|||
the beginning of 1979. |
|
|
|
||
10.12 (1) Marsha Mellow doesn't care whether she consumes in period 1 or in period 2. Her utility function is simply U(c1; c2) = c1 + c2. Her initial endowment is $20 in period 1 and $40 in period 2. In an antique shop, she discovers a cookie jar that is for sale for $12 in period 1 and that she is certain she can sell for $20 in period 2. She derives no consumption bene¯ts from the cookie jar, and it costs her nothing to store it for one period.
(a) On the graph below, label her initial endowment, E, and use blue ink to draw the budget line showing combinations of period-1 and period-2 consumption that she can a®ord if she doesn't buy the cookie jar. On the same graph, label the consumption bundle, A, that she would have if she did not borrow or lend any money but bought the cookie jar in period 1, sold it in period 2, and used the proceeds to buy period-2 consumption. If she cannot borrow or lend, should Marsha invest in the cookie jar?
.
