
Varian Microeconomics Workout
.pdf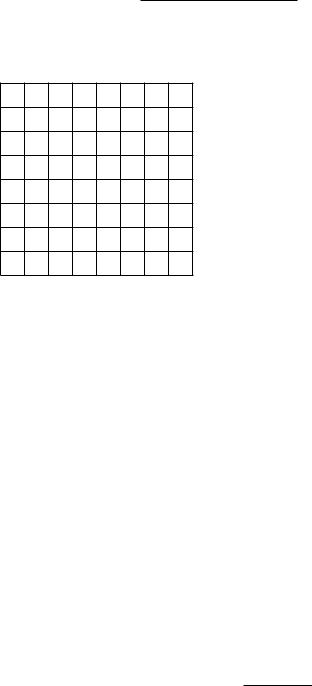
Good 2
20
15
10
5
0 |
5 |
10 |
15 |
20 |
|
|
|
|
Good 1 |
7.2 (0) Freddy Frolic consumes only asparagus and tomatoes, which are highly seasonal crops in Freddy's part of the world. He sells umbrellas for a living, which provides a °uctuating income depending on the weather. But Freddy doesn't mind; he never thinks of tomorrow, so each week he spends as much as he earns. One week, when the prices of asparagus and tomatoes were each $1 a pound, Freddy consumed 15 pounds of each. Use blue ink to show the budget line in the diagram below. Label Freddy's consumption bundle with the letter A.
(a) What is Freddy's income? |
|
. |
(b) The next week the price of tomatoes rose to $2 a pound, but the price of asparagus remained at $1 a pound. By chance, Freddy's income had changed so that his old consumption bundle of (15,15) was just a®ordable at the new prices. Use red ink to draw this new budget line on the graph
below. Does your new budget line go through the point A?
What is the slope of this line? |
|
. |
|
(c) How much asparagus can he a®ord now if he spent all of his income
on asparagus? |
|
. |
(d) What is Freddy's income now? |
|
. |
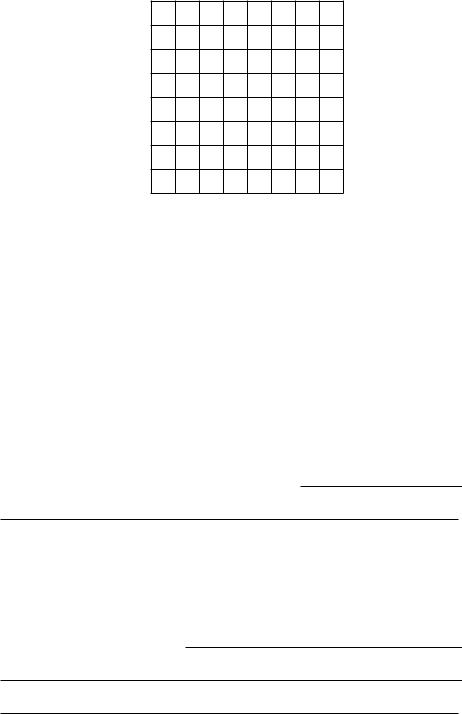
(e) Use pencil to shade the bundles of goods on Freddy's new red budget line that he de¯nitely will not purchase with this budget. Is it possible that he would increase his consumption of tomatoes when his budget
changes from the blue line to the red one? |
|
. |
Tomatoes
40
30
20
10
0 |
10 |
20 |
30 |
40 |
|
|
|
Asparagus |
|
7.3 (0) Pierre consumes bread and wine. For Pierre, the price of bread is 4 francs per loaf, and the price of wine is 4 francs per glass. Pierre has an income of 40 francs per day. Pierre consumes 6 glasses of wine and 4 loaves of bread per day.
Bob also consumes bread and wine. For Bob, the price of bread is 1/2 dollar per loaf and the price of wine is 2 dollars per glass. Bob has an income of $15 per day.
(a) If Bob and Pierre have the same tastes, can you tell whether Bob is
better o® than Pierre or vice versa? Explain.
.
(b) Suppose prices and incomes for Pierre and Bob are as above and that Pierre's consumption is as before. Suppose that Bob spends all of his income. Give an example of a consumption bundle of wine and bread such that, if Bob bought this bundle, we would know that Bob's tastes are not
the same as Pierre's tastes.
.
7.4 (0) Here is a table of prices and the demands of a consumer named Ronald whose behavior was observed in 5 di®erent price-income situations.
Situation |
p1 |
p2 |
x1 |
x2 |
A |
1 |
1 |
5 |
35 |
B |
1 |
2 |
35 |
10 |
C |
1 |
1 |
10 |
15 |
D |
3 |
1 |
5 |
15 |
E |
1 |
2 |
10 |
10 |
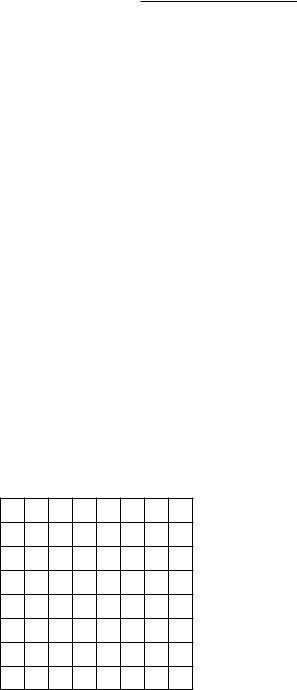
(a)Sketch each of his budget lines and label the point chosen in each case by the letters A, B, C, D, and E.
(b)Is Ronald's behavior consistent with the Weak Axiom of Revealed
Preference? |
|
. |
(c)Shade lightly in red ink all of the points that you are certain are worse for Ronald than the bundle C.
(d)Suppose that you are told that Ronald has convex and monotonic preferences and that he obeys the strong axiom of revealed preference. Shade lightly in blue ink all of the points that you are certain are at least as good as the bundle C.
x2
40
30
20
10
0 |
10 |
20 |
30 |
40 |
|
|
|
|
x1 |
7.5 (0) Horst and Nigel live in di®erent countries. Possibly they have di®erent preferences, and certainly they face di®erent prices. They each consume only two goods, x and y. Horst has to pay 14 marks per unit of x and 5 marks per unit of y. Horst spends his entire income of 167 marks on 8 units of x and 11 units of y. Good x costs Nigel 9 quid per unit and good y costs him 7 quid per unit. Nigel buys 10 units of x and 9 units of y.

(a) Which prices and income would Horst prefer, Nigel's income and prices or his own, or is there too little information to tell? Ex-
plain your answer.
.
(b) Would Nigel prefer to have Horst's income and prices or his own, or
is there too little information to tell?
.
7.6 (0) Here is a table that illustrates some observed prices and choices for three di®erent goods at three di®erent prices in three di®erent situations.
Situation |
p1 |
p2 |
p3 |
x1 |
x2 |
x3 |
A |
1 |
2 |
8 |
2 |
1 |
3 |
B |
4 |
1 |
8 |
3 |
4 |
2 |
C |
3 |
1 |
2 |
2 |
6 |
2 |
(a) We will ¯ll in the table below as follows. Where i and j stand for any of the letters A, B, and C in Row i and Column j of the matrix, write the value of the Situation-j bundle at the Situation-i prices. For example, in Row A and Column A, we put the value of the bundle purchased in Situation A at Situation A prices. From the table above, we see that in Situation A, the consumer bought bundle (2; 1; 3) at prices (1; 2; 8). The cost of this bundle A at prices A is therefore (1£2)+(2£1)+(8£3) = 28, so we put 28 in Row A, Column A. In Situation B the consumer bought bundle (3; 4; 2). The value of the Situation-B bundle, evaluated at the situation-A prices is (1 £ 3) + (2 £ 4) + (8 £ 2) = 27, so put 27 in Row A, Column B. We have ¯lled in some of the boxes, but we leave a few for you to do.
Prices=Quantities |
A |
B |
C |
A |
28 |
27 |
|
|
|
|
|
B |
|
32 |
30 |
|
|
|
|
C |
13 |
17 |
|
|
|
|
|
(b) Fill in the entry in Row i and Column j of the table below with a D if the Situation-i bundle is directly revealed preferred to the Situation-j bundle. For example, in Situation A the consumer's expenditure is $28. We see that at Situation-A prices, he could also a®ord the Situation-B bundle, which cost 27. Therefore the Situation-A bundle is directly revealed preferred to the Situation-B bundle, so we put a D in Row A, Column B. Now let us consider Row B, Column A. The cost of the Situation-B

bundle at Situation-B prices is 32. The cost of the Situation-A bundle at Situation-B prices is 33. So, in Situation B, the consumer could not a®ord the Situation-A bundle. Therefore Situation B is not directly revealed preferred to Situation A. So we leave the entry in Row B, Column A blank. Generally, there is a D in Row i Column j if the number in the ij entry of the table in part (a) is less than or equal to the entry in Row i, Column i. There will be a violation of WARP if for some i and j, there is a D in Row i Column j and also a D in Row j, Column i. Do these
observations violate WARP? |
|
|
|
|
|
. |
|
|
|
|
|
|
|
||
|
Situation |
A |
B |
C |
|||
|
A |
| |
|
|
|
|
|
|
|
|
|
|
|
||
|
B |
|
| |
D |
|
|
|
|
|
|
|
|
|
|
|
|
C |
|
|
| |
|
|
|
|
|
|
|
|
|
|
|
(c) Now ¯ll in Row i, Column j with an I if observation i is indirectly revealed preferred to j. Do these observations violate the Strong Axiom
of Revealed Preference? |
|
. |
7.7 (0) It is January, and Joe Grad, whom we met in Chapter 5, is shivering in his apartment when the phone rings. It is Mandy Manana, one of the students whose price theory problems he graded last term. Mandy asks if Joe would be interested in spending the month of February in her apartment. Mandy, who has switched majors from economics to political science, plans to go to Aspen for the month and so her apartment will be empty (alas). All Mandy asks is that Joe pay the monthly service charge of $40 charged by her landlord and the heating bill for the month of February. Since her apartment is much better insulated than Joe's, it only costs $1 per month to raise the temperature by 1 degree. Joe thanks her and says he will let her know tomorrow. Joe puts his earmu®s back on and muses. If he accepts Mandy's o®er, he will still have to pay rent on his current apartment but he won't have to heat it. If he moved, heating would be cheaper, but he would have the $40 service charge. The outdoor temperature averages 20 degrees Fahrenheit in February, and it costs him $2 per month to raise his apartment temperature by 1 degree. Joe is still grading homework and has $100 a month left to spend on food and utilities after he has paid the rent on his apartment. The price of food is still $1 per unit.
(a) Draw Joe's budget line for February if he moves to Mandy's apartment and on the same graph, draw his budget line if he doesn't move.

(b) After drawing these lines himself, Joe decides that he would be better o® not moving. From this, we can tell, using the principle of revealed preference that Joe must plan to keep his apartment at a temperature of
less than |
|
. |
(c) Joe calls Mandy and tells her his decision. Mandy o®ers to pay half the service charge. Draw Joe's budget line if he accepts Mandy's new o®er. Joe now accepts Mandy's o®er. From the fact that Joe accepted this o®er we can tell that he plans to keep the temperature in Mandy's
apartment above |
|
. |
Food
120
100
80
60
40
20
0 |
10 |
20 |
30 |
40 |
50 |
60 |
70 |
80 |
|
|
|
|
|
|
|
Temperature |
|
7.8 (0) Lord Peter Pommy is a distinguished criminologist, schooled in the latest techniques of forensic revealed preference. Lord Peter is investigating the disappearance of Sir Cedric Pinchbottom who abandoned his aging mother on a street corner in Liverpool and has not been seen since. Lord Peter has learned that Sir Cedric left England and is living under an assumed name somewhere in the Empire. There are three suspects, R. Preston McAfee of Brass Monkey, Ontario, Canada, Richard Manning of North Shag, New Zealand, and Richard Stevenson of Gooey Shoes, Falkland Islands. Lord Peter has obtained Sir Cedric's diary, which recorded his consumption habits in minute detail. By careful observation, he has also discovered the consumption behavior of McAfee, Manning, and Stevenson. All three of these gentlemen, like Sir Cedric, spend their entire incomes on beer and sausage. Their dossiers reveal the following:
²Sir Cedric Pinchbottom | In the year before his departure, Sir Cedric consumed 10 kilograms of sausage and 20 liters of beer per week. At that time, beer cost 1 English pound per liter and sausage cost 1 English pound per kilogram.
²R. Preston McAfee | McAfee is known to consume 5 liters of beer and 20 kilograms of sausage. In Brass Monkey, Ontario beer costs 1 Canadian dollar per liter and sausage costs 2 Canadian dollars per kilogram.
²Richard Manning | Manning consumes 5 kilograms of sausage and 10 liters of beer per week. In North Shag, a liter of beer costs 2 New Zealand dollars and sausage costs 2 New Zealand dollars per kilogram.
²Richard Stevenson | Stevenson consumes 5 kilograms of sausage and 30 liters of beer per week. In Gooey Shoes, a liter of beer costs 10 Falkland Island pounds and sausage costs 20 Falkland Island pounds per kilogram.
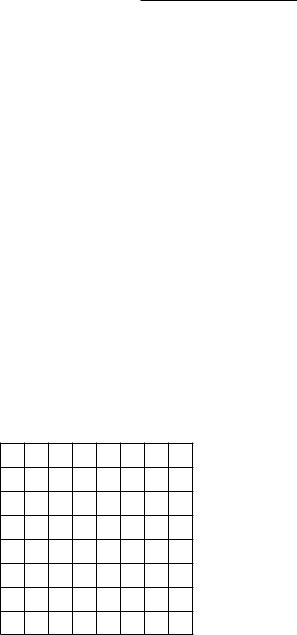
(a)Draw the budget line for each of the three fugitives, using a di®erent color of ink for each one. Label the consumption bundle that each chooses. On this graph, superimpose Sir Cedric's budget line and the bundle he chose.
Sausage
40
30
20
10
0 |
10 |
20 |
30 |
40 |
|
|
|
|
Beer |
(b) After pondering the dossiers for a few moments, Lord Peter announced. \Unless Sir Cedric has changed his tastes, I can eliminate one of the suspects. Revealed preference tells me that one of the suspects is
innocent." Which one? |
|
. |
(c) After thinking a bit longer, Lord Peter announced. \If Sir Cedric left voluntarily, then he would have to be better o® than he was before. Therefore if Sir Cedric left voluntarily and if he has not changed his tastes,
he must be living in |
|
. |
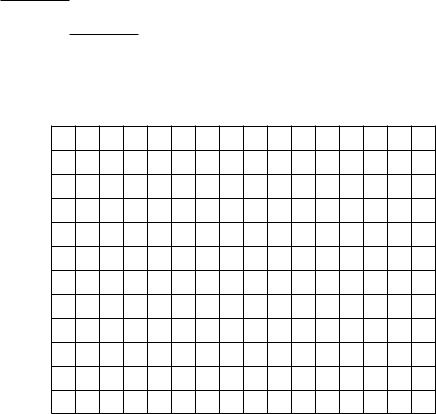
7.9 (1) The McCawber family is having a tough time making ends meet. They spend $100 a week on food and $50 on other things. A new welfare program has been introduced that gives them a choice between receiving a grant of $50 per week that they can spend any way they want, and buying any number of $2 food coupons for $1 apiece. (They naturally are not allowed to resell these coupons.) Food is a normal good for the McCawbers. As a family friend, you have been asked to help them decide on which option to choose. Drawing on your growing fund of economic knowledge, you proceed as follows.
(a) On the graph below, draw their old budget line in red ink and label their current choice C. Now use black ink to draw the budget line that they would have with the grant. If they chose the coupon option, how much food could they buy if they spent all their money on food coupons?
How much could they spend on other things if they bought
no food? Use blue ink to draw their budget line if they choose the coupon option.
Other things
180
150
120
90
60
30
0 |
30 |
60 |
90 |
120 |
150 |
180 |
210 |
240 |
|
|
|
|
|
|
|
|
Food |
(b) Using the fact that food is a normal good for the McCawbers, and knowing what they purchased before, darken the portion of the black budget line where their consumption bundle could possibly be if they chose the lump-sum grant option. Label the ends of this line segment A and B.
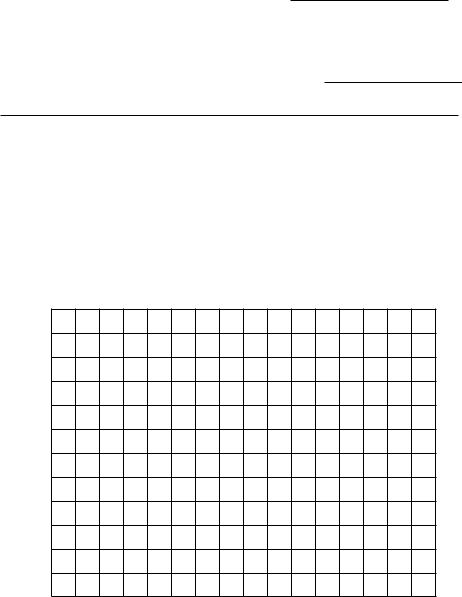
(c) After studying the graph you have drawn, you report to the McCawbers. \I have enough information to be able to tell you which choice to
make. You should choose the |
|
because |
.
(d) Mr. McCawber thanks you for your help and then asks, \Would you have been able to tell me what to do if you hadn't known whether food was a normal good for us?" On the axes below, draw the same budget lines you drew on the diagram above, but draw indi®erence curves for which food is not a normal good and for which the McCawbers would be better o® with the program you advised them not to take.
Other things
180
150
120
90
60
30
0 |
30 |
60 |
90 |
120 |
150 |
180 |
210 |
240 |
|
|
|
|
|
|
|
|
Food |
7.10 (0) In 1933, the Swedish economist Gunnar Myrdal (who later won a Nobel prize in economics) and a group of his associates at Stockholm University collected a fantastically detailed historical series of prices and price indexes in Sweden from 1830 until 1930. This was published in a book called The Cost of Living in Sweden. In this book you can ¯nd 100 years of prices for goods such as oat groats, hard rye bread, salted cod¯sh, beef, reindeer meat, birchwood, tallow candles, eggs, sugar, and co®ee. There are also estimates of the quantities of each good consumed by an average working-class family in 1850 and again in 1890.
The table below gives prices in 1830, 1850, 1890, and 1913, for °our, meat, milk, and potatoes. In this time period, these four staple foods accounted for about 2/3 of the Swedish food budget.
Prices of Staple Foods in Sweden
Prices are in Swedish kronor per kilogram, except for milk, which is in Swedish kronor per liter.
|
1830 |
1850 |
1890 |
1913 |
Grain Flour |
.14 |
.14 |
.16 |
.19 |
Meat |
.28 |
.34 |
.66 |
.85 |
Milk |
.07 |
.08 |
.10 |
.13 |
Potatoes |
.032 |
.044 |
.051 |
.064 |
Based on the tables published in Myrdal's book, typical consumption bundles for a working-class Swedish family in 1850 and 1890 are listed below. (The reader should be warned that we have made some approximations and simpli¯cations to draw these simple tables from the much more detailed information in the original study.)
Quantities Consumed by a Typical Swedish Family
Quantities are measured in kilograms per year, except for milk, which is measured in liters per year.
|
1850 |
1890 |
Grain Flour |
165 |
220 |
Meat |
22 |
42 |
Milk |
120 |
180 |
Potatoes |
200 |
200 |
(a) Complete the table below, which reports the annual cost of the 1850 and 1890 bundles of staple foods at various years' prices.
Cost of 1850 and 1890 Bundles at Various Years' Prices
|
Cost |
1850 bundle |
1890 bundle |
|
|
|
|
|
|
|
|
|
|
|
Cost at 1830 Prices |
44.1 |
|
61.6 |
|
|
|
|
|
|
|
|
|
|
Cost at 1850 Prices |
|
|
|
|
|
|
|
|
|
|
|
|
|
Cost at 1890 Prices |
|
|
|
|
|
|
|
|
|
|
|
|
|
Cost at 1913 Prices |
78.5 |
|
113.7 |
|
|
|
|
|
|
|
|
|
(b) Is the 1890 bundle revealed preferred to the 1850 bundle? |
|
. |
||||
(c) The Laspeyres quantity index for 1890 with base year 1850 is the ratio of the value of the 1890 bundle at 1850 prices to the value of the 1850 bundle at 1850 prices. Calculate the Laspeyres quantity index of staple
food consumption for 1890 with base year 1850. |
|
. |
