

BY REGION |
1 |
|
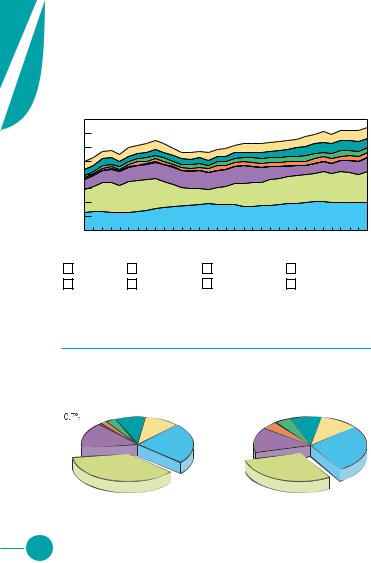
The OECD |
from 1971 to 2002 of OECD Total Primary Energy Supply* by Region (Mtoe)
0 |
1974 1976 |
1978 1980 |
1982 1984 |
1986 1988 |
1990 1992 |
1994 1996 |
1998 2000 |
2002 |
1972 |
|
OECD North America |
|
OECD Pacific |
|
OECD Europe |
973 and 2002 Regional Shares of TPES*
1973 |
|
2002 |
|
||
OECD Europe |
OECD Europe |
||||
37.3% |
|
33.6% |
|
||
c |
OECD |
||||
Pacific |
|||||
|
|
|
15.9% |
|
|
|
OECD North America |
|
OECD North America |
||
51.8% |
|
50.5% |
|
||
|
|
|
|
|
|
|
3 762 Mtoe |
|
|
5 344 Mtoe |
|
*Excludes electricity trade.
9
S |
|
|
|
U |
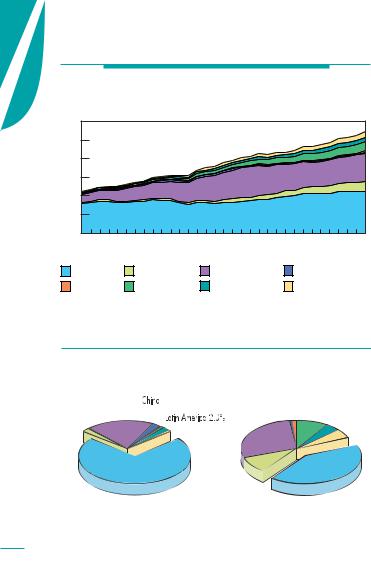
Crude Oil Production |
||
P |
|||
P |
|
|
|
|
|
|
|
L |
Evolution from 1971 to 2003 of Crude Oil Production by Region |
||
Y |
|||
|
|
(Mt) |
|
4000 |
3500 |
3000 |
2500 |
2000 |
1500 |
1000 |
500 |
0 |
1971 1973 1975 1977 1979 1981 1983 1985 1987 1989 1991 1993 1995 1997 1999 2001 2003 |
|
OECD |
|
Middle East |
|
Former USSR |
|
Non-OECD Europe |
|
|
|
|
||||
|
China |
|
Asia* |
|
Latin America |
|
Africa |
|
|
|
|
1973 and 2003 Regional Shares of
Crude Oil Production
|
|
|
1973 |
|
|
|
|
2003 |
|
||
Non- |
|
|
Asia* |
Latin |
|
Non- |
|
|
Asia* |
Latin |
|
OECD |
China |
3.2% |
America |
Africa |
OECD |
China |
4.8% |
America |
Africa |
||
Europe |
|
8.6% |
Europe |
|
9.1% |
||||||
Former |
1.9% |
|
|
10.0% |
0.3% |
4.4% |
|
|
10.8% |
||
|
|
|
|
|
Former |
|
|
|
|
|
|
USSR |
|
|
|
|
|
|
|
|
|
|
|
|
|
|
|
|
USSR |
|
|
|
|
|
|
15.0% |
|
|
|
|
|
|
|
|
|
|
|
|
|
|
|
|
13.8% |
|
|
|
|
|
|
|
|
|
|
|
|
|
|
|
|
|
|
|
|
|
|
|
OECD |
|
|
|
|
|
OECD |
Middle East |
|
|
23.6% |
Middle East |
|
|
27.1% |
||||
|
|
|
|
|
|
||||||
37.0% |
|
|
|
|
|
29.7% |
|
|
|
|
|
|
|
|
|
|
|
|
|
|
|
||
|
|
|
2 867 Mt |
|
|
|
|
3 712 Mt |
|
||
10 |
*Asia excludes China. |

Producers, Exporters and Importers
of Crude Oil
1 |
|
|
% of |
|
Mt |
World |
|
|
total |
Arabia |
470 |
12.7 |
|
419 |
11.3 |
States |
348 |
9.4 |
Rep. of Iran |
194 |
5.2 |
|
189 |
5.1 |
Rep. of China |
165 |
4.4 |
|
151 |
4.1 |
|
149 |
4.0 |
|
138 |
3.7 |
Emirates |
120 |
3.2 |
|
|
|
the World |
1 369 |
36.9 |
|
|
|
|
3 712 |
100.0 |
|
|
|
Exporters* |
Mt |
|
|
|
|
Saudi Arabia |
289 |
|
|
|
|
Russia |
188 |
|
|
|
|
Importers* |
Mt |
||||
Norway |
140 |
|
|||
|
United States |
515 |
|||
Venezuela |
110 |
|
|||
|
Japan |
206 |
|||
Mexico |
95 |
|
|||
|
Korea |
108 |
|||
Islamic Rep. of Iran |
95 |
|
|||
|
Germany |
105 |
|||
Nigeria |
92 |
|
|||
|
Italy |
90 |
|||
United Kingdom |
87 |
|
|||
|
India |
82 |
|||
Canada |
80 |
|
|||
|
France |
80 |
|||
United Arab Emirates |
79 |
|
|||
|
People’s Rep. of China |
69 |
|||
|
|
|
|||
Rest of the World |
663 |
|
|||
|
Spain |
58 |
|||
|
|
|
|||
World |
1 918 |
|
United Kingdom |
57 |
|
|
|
|
|
|
|
2002 data |
|
|
Rest of the World |
667 |
|
|
|
|
|
||
|
|
|
World |
2 037 |
|
|
|
|
|
|
*Total exports and imports. |
2002 data |
11
S |
|
|
|
|
U |
|
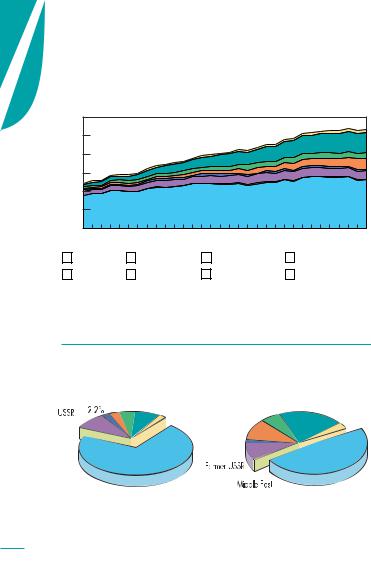
Natural Gas Production |
||
P |
|
|||
P |
|
|
|
|
L |
Evolution from 1971 to 2003 of Natural Gas Production by Region |
|||
Y |
||||
|
|
(Billion Cubic Metres) |
|
|
|
3000 |
|
|
|
|
2500 |
|
|
|
|
2000 |
|
|
|
|
1500 |
|
|
|
|
1000 |
|
|
|
|
500 |
|
|
|
|
0 |
|
|
|
|
1971 1973 1975 1977 1979 1981 1983 1985 1987 1989 1991 1993 1995 1997 1999 2001 2003 |
|||
|
OECD |
Middle East |
Former USSR |
Non-OECD Europe |
|
China |
Asia* |
Latin America |
Africa |
1973 and 2003 Regional Shares of
Natural Gas Production
|
1973 |
|
|
2003 |
|
|
||
|
Non- |
|
Asia* |
Non- |
|
|
Latin |
|
Former |
OECD |
|
China |
|
||||
Europe |
0.4% |
1.0% |
OECD |
Asia* America |
||||
USSR |
2.6% |
|
Europe |
1.4% |
8.9% |
4.4% Africa |
||
19.7% |
|
Africa 0.8% |
0.7% |
|
|
|||
Middle |
|
|
|
|
|
5.5% |
||
|
|
|
Former |
|
|
|
|
|
East |
|
|
|
|
|
|
|
|
2.1% |
|
|
|
USSR |
|
|
|
|
|
|
|
|
28.2% |
|
|
|
|
|
|
|
OECD |
Middle |
|
|
|
OECD |
|
|
|
East |
|
|
|
||
|
|
|
71.4% |
|
|
41.5% |
||
|
|
|
9.4% |
|
|
|||
|
|
|
|
|
|
|
|
|
|
|
|
|
|
|
|
||
|
1 227 Bcm |
|
|
2 719 Bcm |
|
|
||
12 |
*Asia excludes China. |
|
|

Producers, Exporters and Importers*
of Natural Gas
1 |
|
Mm3 |
% of |
|
|
|
|
|
|
|
World |
|
|
|
|
|
|
|
|
|
total |
|
|
|
|
|
|
|
608 332 |
22.4 |
|
|
|
|
|
|
|
Exporters |
Mm3 |
|
|
|
|||
States |
541 779 |
19.9 |
|
|
|
|
||
|
Russia |
186 102 |
|
|
|
|||
|
182 205 |
6.7 |
|
|
|
|
||
|
|
|
|
|
|
|
||
Kingdom |
108 438 |
4.0 |
|
Canada |
102 156 |
|
Importers |
Mm3 |
|
Norway |
70 978 |
|
|||||
|
86 553 |
3.2 |
|
|
United States |
111 221 |
||
|
|
|
|
|
||||
|
|
|
|
Algeria |
63 615 |
|
||
|
79 639 |
2.9 |
|
|
Germany |
84 478 |
||
|
|
|
|
|
||||
|
|
|
|
Netherlands |
48 262 |
|
||
. of Iran |
77 923 |
2.9 |
|
|
Japan |
81 200 |
||
|
|
|
|
|||||
|
|
|
|
Turkmenistan |
42 783 |
|
||
|
76 832 |
2.8 |
|
|
Ukraine |
66 461 |
||
|
|
|
|
|
||||
|
|
|
|
Indonesia |
41 422 |
|
||
|
73 128 |
2.7 |
|
|
Italy |
62 094 |
||
|
|
|
|
|
||||
|
|
|
|
Austria |
26 607 |
|
||
Arabia |
60 262 |
2.2 |
|
|
France |
43 138 |
||
|
|
|
|
|||||
|
|
|
|
Malaysia |
24 590 |
|
||
the World |
823 719 |
30.3 |
|
|
Austria |
33 628 |
||
|
United States |
19 592 |
|
|||||
|
|
|
|
|
Netherlands |
25 569 |
||
|
2 718 810 |
100.0 |
|
|
||||
|
|
|
|
|
||||
|
Rest of the World |
157 402 |
|
|||||
|
|
|
|
|
Korea |
25 378 |
||
|
|
|
|
|
||||
|
|
|
|
|
|
|
||
|
|
|
|
World** |
783 509 |
|
Spain |
23 177 |
|
|
|
|
|
|
|
|
|
|
|
|
|
2003 data |
|
|
Rest of the World |
225 259 |
|
|
|
|
|
|
|
|
|
|
|
|
|
|
|
|
World** |
781 603 |
and imports include pipeline gas and LNG. |
|
|
||||||
2003 data |
|
|||||||
trade includes intra trade of Former USSR. |
|
|||||||
13

S |
|
|
|
|
U |
|
Hard Coal Production |
||
P |
|
|||
P |
|
|
|
|
L |
Evolution from 1971 to 2003 of Hard Coal Production by Region |
|||
Y |
||||
|
|
|
(Mt) |
|
|
4500 |
|
|
|
|
4000 |
|
|
|
|
3500 |
|
|
|
|
3000 |
|
|
|
|
2500 |
|
|
|
|
2000 |
|
|
|
|
1500 |
|
|
|
|
1000 |
|
|
|
|
500 |
|
|
|
|
0 |
|
|
|
|
1971 1973 1975 1977 1979 1981 1983 1985 1987 1989 1991 1993 1995 1997 1999 2001 2003 |
|||
|
OECD |
Middle East |
Former USSR |
Non-OECD Europe |
|
China |
Asia* |
Latin America |
Africa |
1973 and 2003 Regional Shares of
Hard Coal Production
|
1973 |
|
|
|
|
2003 |
|
|
|||
Non- |
|
China |
Asia* |
Latin America |
|
|
|
Asia* |
Latin America |
||
OECD |
18.7% |
4.8% |
China |
|
|
12.5% |
|||||
0.3% |
|
|
|
1.5% |
|||||||
Europe |
|
|
|
37.3% |
|
|
|
|
|||
|
|
|
Africa 3.1% |
|
|
|
|
|
Africa 6.1% |
||
0.4% |
|
|
|
|
|
|
|
|
|
|
|
|
|
|
|
|
|
|
|
|
|
|
|
rmer |
|
|
|
|
|
|
|
|
|
|
|
USSR |
|
|
|
|
|
|
|
|
|
|
|
.9% |
|
|
|
|
Non- |
|
|
|
|
|
|
|
|
|
|
OECD |
OECD |
Former |
|
|
|
OECD |
|
|
|
|
|
49.8% |
Europe |
USSR |
|
|
34.6% |
||
|
|
|
|
|
0.1% |
7.9% |
|
|
|
|
|
|
|
|
|
|
|
|
|
|
|
||
|
|
2 233 Mt |
|
|
|
|
4 038 Mt |
|
|
||
14 |
*Asia excludes China. |
|
|

Producers, Exporters and Importers
of Coal
1 |
|
Hard |
Brown |
|
Coal |
Coal |
|
(Mt) |
(Mt) |
. of China |
1 502 |
* |
States |
892 |
78 |
|
340 |
25 |
|
274 |
65 |
Africa |
239 |
0 |
|
188 |
78 |
|
120 |
0 |
|
100 |
61 |
|
75 |
4 |
|
57 |
1 |
|
|
|
the World |
251 |
574 |
|
|
|
|
4 038 |
886 |
|
|
|
|
Hard |
Exporters |
Coal |
|
(Mt) |
Australia |
208 |
People’s Rep. of China |
93 |
Indonesia |
90 |
South Africa |
71 |
Russia |
60 |
Colombia |
46 |
United States |
39 |
Canada |
26 |
Kazakhstan |
25 |
Poland |
20 |
|
|
Rest of the World |
40 |
|
|
World |
718 |
|
|
2003 data |
|
*Included in hard coal.
15
|
Hard |
Importers |
Coal |
|
(Mt) |
Japan |
162 |
Korea |
72 |
Chinese Taipei |
54 |
Germany |
35 |
United Kingdom |
32 |
Russia |
24 |
India |
24 |
United States |
23 |
Netherlands |
22 |
Spain |
22 |
|
|
Rest of the World |
239 |
|
|
World |
709 |
|
|
2003 data |
|
S |
|
|
|
U |
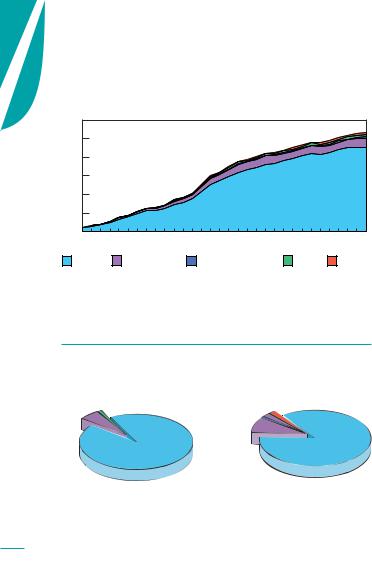
Nuclear Production |
||
P |
|||
P |
|
|
|
|
|
|
|
L |
Evolution from 1971 to 2002 of Nuclear Production by Region |
||
Y |
|||
|
|
(TWh) |
|
3000 |
|
|
|
|
|
|
|
|
|
2500 |
|
|
|
|
|
|
|
|
|
2000 |
|
|
|
|
|
|
|
|
|
1500 |
|
|
|
|
|
|
|
|
|
1000 |
|
|
|
|
|
|
|
|
|
500 |
|
|
|
|
|
|
|
|
|
0 |
|
|
|
|
|
|
|
|
|
1972 |
1974 1976 |
1978 1980 |
1982 1984 |
1986 1988 |
1990 1992 |
1994 1996 |
1998 2000 |
2002 |
|
OECD |
Former USSR |
Non-OECD Europe |
Asia* |
Other** |
|||||
1973 and 2002 Regional Shares of
Nuclear Production
|
1973 |
|
|
|
2002 |
|
|
|
Non- |
Asia* |
|
|
|
|
Asia* |
OECD |
Other** |
|||
|
Europe |
2.3% |
2.1% |
|
||
ormer |
1.3% |
|
||||
1.2% |
|
|
|
|
||
|
|
|
|
|
||
USSR |
|
Former |
|
|
|
|
5.9% |
|
|
|
|
|
|
|
USSR |
|
|
|
|
|
|
|
|
|
|
|
|
|
|
8.9% |
|
|
|
|
|
|
OECD |
|
|
|
|
|
|
92.8% |
|
|
85.5% |
|
|
|
|
|
|
|
|
|
203 TWh |
|
|
2 660 TWh |
|
|
|
*Asia excludes China. |
16 |
** Other includes Africa, Latin America & China. |
|
|

Producers of Nuclear Electricity
1 |
|
|
% of |
|
TWh |
World |
|
|
total |
States |
805 |
30.3 |
|
437 |
16.4 |
|
295 |
11.1 |
|
165 |
6.2 |
|
142 |
5.3 |
|
119 |
4.5 |
Kingdom |
88 |
3.3 |
|
78 |
2.9 |
|
76 |
2.9 |
|
68 |
2.6 |
|
|
|
the World |
387 |
14.5 |
|
|
|
|
2 660 |
100.0 |
|
|
|
Installed |
GW |
|
|
% of |
|
Capacity |
|
Country |
nuclear |
||
|
|
||||
United States |
98 |
|
(based on first |
in total |
|
|
domestic |
||||
|
|
|
10 producers) |
||
France |
63 |
|
electricity |
||
|
|
||||
Japan |
44 |
|
|
generation |
|
|
France |
78 |
|||
Germany |
21 |
|
|||
Russia |
21 |
|
Sweden |
46 |
|
|
|
|
|||
Korea |
15 |
|
Ukraine |
45 |
|
|
|
|
|||
United Kingdom |
12 |
|
Korea |
36 |
|
|
|
|
|||
Ukraine |
11 |
|
Germany |
29 |
|
|
|
|
|||
Canada |
10 |
|
Japan |
27 |
|
|
|
|
|||
Sweden |
9 |
|
United Kingdom |
23 |
|
|
United States |
20 |
|||
|
|
|
|||
Rest of the World |
55 |
||||
|
Russia |
16 |
|||
|
|
|
|||
World |
359 |
|
Canada |
13 |
|
2002 data |
|
|
|
|
|
|
|
Rest of the World* |
9 |
||
Source: Commissariat à |
|
|
|
||
|
World |
16 |
|||
l’Énergie Atomique (France). |
|
||||
|
|
|
|
|
|
*Countries with nuclear production only. |
2002 data |
17
S |
|
|
|
U |
Hydro Production |
||
P |
|||
P |
|
|
|
|
|
|
|
L |
Evolution from 1971 to 2002 of Hydro Production by Region |
||
Y |
|||
|
|
(TWh) |
|
3000 |
|
|
|
|
|
|
|
|
2500 |
|
|
|
|
|
|
|
|
2000 |
|
|
|
|
|
|
|
|
1500 |
|
|
|
|
|
|
|
|
1000 |
|
|
|
|
|
|
|
|
500 |
|
|
|
|
|
|
|
|
0 |
1974 1976 |
1978 1980 |
1982 1984 |
1986 1988 |
1990 1992 |
1994 1996 |
1998 2000 |
2002 |
1972 |
|
OECD |
|
Middle East |
|
Former USSR |
|
Non-OECD Europe |
|
|
|
|
||||
|
China |
|
Asia* |
|
Latin America |
|
Africa |
|
|
|
|
||||
|
|
|
|
1973 and 2002 Regional Shares of
Hydro Production
|
|
1973 |
|
|
|
|
2002 |
|
|
Non- |
China Asia* |
|
|
|
|
|
|
||
OECD |
Latin America |
Asia* |
Latin America |
|
|||||
Former Europe |
2.9% 4.3% |
7.2% |
20.1% |
|
|||||
China 6.2% |
Africa |
||||||||
|
|
|
|
Africa |
|
||||
|
|
|
|
10.8% |
|
|
3.2% |
||
9.4% |
|
|
2.2% |
|
|
||||
|
|
Non-OECD |
|
|
|||||
Middle |
|
|
|
|
|
||||
|
|
|
Europe |
|
|
||||
East |
|
|
|
|
|
||||
|
|
|
1.8% |
|
|
|
|||
0.3% |
|
|
|
|
|
|
|
||
|
|
|
|
|
|
|
|
||
|
|
|
|
OECD |
8.6% |
|
|
OECD |
|
|
|
|
|
|
|
|
|||
|
|
|
71.5% |
0.7% |
|
|
48.6% |
||
|
|
|
|
|
|
|
|||
|
1 295 TWh |
|
|
|
2 676 TWh |
|
|||
18 |
*Asia excludes China. |
|
|