

BALANCE TABLE
The OECD
2002
|
|
|
|
|
|
|
|
|
(Mtoe) |
SUPPLY AND |
Coal |
Crude |
Petroleum |
Gas |
Nuclear |
Hydro |
Combustible |
Other* |
Total |
CONSUMPTION |
|
Oil |
Products |
|
|
|
Renewables |
|
|
|
|
|
|
|
|
|
& Waste |
|
|
Indigenous Prod. |
992.84 |
1025.46 |
– |
919.44 |
593.14 |
105.82 |
177.62 |
32.75 |
3847.06 |
Imports |
320.73 |
1554.38 |
448.93 |
460.27 |
– |
– |
1.03 |
30.96 |
2816.29 |
Exports |
–210.13 |
–449.22 |
–342.20 |
–221.53 |
– |
– |
–0.25 |
–29.35 |
–1252.67 |
Intl. Marine Bunkers |
– |
– |
–83.08 |
– |
– |
– |
– |
– |
–83.08 |
Stock Changes |
–7.08 |
–0.36 |
12.39 |
13.15 |
– |
– |
0.01 |
– |
18.11 |
TPES |
1096.36 |
2130.26 |
36.04 |
1171.34 |
593.14 |
105.82 |
178.41 |
34.36 |
5345.72 |
Transfers |
– |
–27.49 |
34.53 |
– |
– |
– |
–0.00 |
– |
7.04 |
Statistical Diff. |
–3.65 |
–8.24 |
4.88 |
–5.89 |
– |
– |
0.00 |
0.00 |
–12.90 |
Electricity Plants |
–801.86 |
–6.39 |
–94.22 |
–240.21 |
–584.74 |
–105.82 |
–26.18 |
731.41 |
–1128.02 |
CHP Plants |
–83.57 |
–0.56 |
–14.39 |
–100.46 |
–8.40 |
– |
–28.53 |
123.43 |
–112.46 |
Heat Plants |
–5.18 |
– |
–1.81 |
–5.67 |
– |
– |
–5.10 |
13.42 |
–4.35 |
Gas Works |
–2.54 |
– |
–2.75 |
2.71 |
– |
– |
– |
– |
–2.58 |
Pet. Refineries |
– |
–2112.44 |
2132.49 |
– |
– |
– |
– |
– |
20.05 |
Coal Transf. |
–65.15 |
0.05 |
–2.17 |
–0.20 |
– |
– |
–0.00 |
– |
–67.48 |
Liquefaction Plants |
– |
– |
– |
– |
– |
– |
– |
– |
– |
Other Transf. |
0.01 |
26.67 |
–24.53 |
–0.57 |
– |
– |
–0.07 |
– |
1.50 |
Own Use |
–13.40 |
–0.41 |
–123.58 |
–90.12 |
– |
– |
–2.18 |
–62.57 |
–292.26 |
Distribution Losses |
–0.61 |
– |
–0.02 |
–1.94 |
– |
– |
–0.00 |
–59.75 |
–62.32 |
TFC |
120.41 |
1.45 |
1944.48 |
728.97 |
– |
– |
116.35 |
780.30 |
3691.95 |
Industry Sector |
103.27 |
1.45 |
342.66 |
307.29 |
– |
– |
61.96 |
288.87 |
1105.50 |
Transport Sector |
0.09 |
– |
1207.82 |
22.13 |
– |
– |
2.62 |
9.32 |
1241.97 |
Other Sectors |
16.28 |
– |
270.11 |
399.55 |
– |
– |
51.77 |
482.11 |
1219.82 |
Non–Energy Use |
0.77 |
– |
123.88 |
– |
– |
– |
– |
– |
124.66 |
*Includes geothermal, solar, electricity and heat, wind, etc.
4 |
39
P |
|
|
|
|
R |
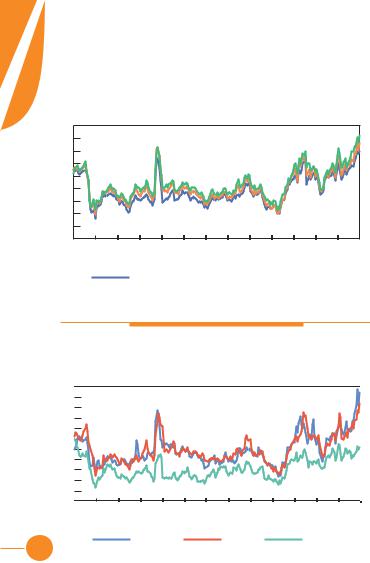
Crude Oil |
|||
I |
||||
C |
|
|
|
|
E |
Key Crude Oil Spot Prices |
|||
S |
||||
in US Dollars/barrel |
||||
|
||||
45 |
|
|
|
|
|
|
|
|
|
|
|
|
|
40 |
|
|
|
|
|
|
|
|
|
|
|
|
|
35 |
|
|
|
|
|
|
|
|
|
|
|
|
|
30 |
|
|
|
|
|
|
|
|
|
|
|
|
|
25 |
|
|
|
|
|
|
|
|
|
|
|
|
|
20 |
|
|
|
|
|
|
|
|
|
|
|
|
|
15 |
|
|
|
|
|
|
|
|
|
|
|
|
|
10 |
|
|
|
|
|
|
|
|
|
|
|
|
|
5 |
|
|
|
|
|
|
|
|
|
|
|
|
|
0 |
|
|
|
|
|
|
|
|
|
|
|
|
|
Jan-85 |
Jul-86 |
Jan-88 |
Jul-89 |
Jan-91 |
Jul-92 |
Jan-94 |
Jul-95 |
Jan-97 |
Jul-98 |
Jan-00 |
Jul-01 |
Jan-03 |
Jul-04 |
Monthly Averages
Dubai |
|
Brent |
|
WTI |
|
|
Petroleum Products
Rotterdam Oil Product Spot Prices
in US Dollars/barrel
55 |
|
|
50 |
|
|
45 |
|
|
40 |
|
|
35 |
|
|
30 |
|
|
25 |
|
|
20 |
|
|
15 |
|
|
10 |
|
|
5 |
|
|
0 |
|
|
Jan-85 Jul-86 Jan-88 Jul-89 Jan-91 |
Jul-92 Jan-94 Jul-95 Jan-97 |
Jul-98 Jan-00 Jul-01 Jan-03 Jul-04 |
|
Monthly Averages |
|
Gasoline |
Gasoil |
HFO |
40
Coal
Steam Coal Import Costs
in US Dollars/tonne
70 |
|
|
|
|
|
|
|
60 |
|
|
|
|
|
|
|
50 |
|
|
|
|
|
|
|
40 |
|
|
|
|
|
|
|
30 |
|
|
|
|
|
|
|
20 |
|
|
|
|
|
|
|
10 |
|
|
|
|
|
|
|
0 |
|
|
|
|
|
|
|
1Q1983 |
1Q1986 |
1Q1989 |
1Q1992 |
1Q1995 |
1Q1998 |
1Q2001 |
1Q2004 |
|
|
|
Quarterly Averages |
|
|
|
|
|
|
|
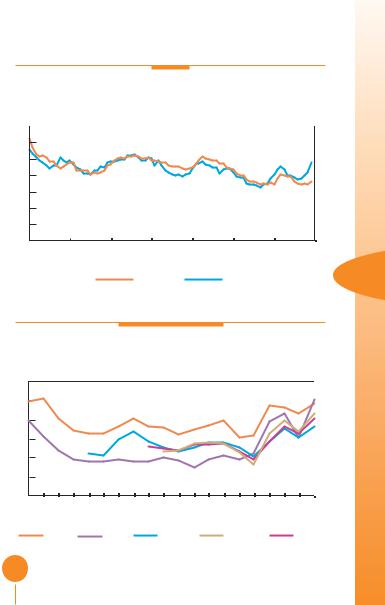
EU |
|
Japan |
|
|
Natural Gas
Natural Gas Import Prices
in US Dollars/MBtu
6
5
4
3
2
1
0
1985 |
1987 |
1989 |
1991 |
1993 |
1995 |
1997 |
1999 |
2001 |
2003 |
|
|
|
|
Yearly Averages |
|
|
|
|
|
Japan** |
USA* |
Belgium* |
Germany* |
Spain* |
*Pipeline **LNG
5 |
41

P
R
I RETAIL PRICES(a)
C
E
S
|
Heavy Fuel Oil |
Light Fuel Oil |
Automotive |
Unleaded |
|||
|
for Industry(b) |
for Households |
Diesel Oil(c) |
Premium(d) |
|||
|
(tonne) |
|
(1000 litres) |
(litre) |
(litre) |
|
|
|
|
|
|
|
|
||
Australia |
.. L |
.. L |
.. L |
0.696 |
L |
||
Austria |
219.36 |
L |
526.50 |
L |
0.773 L |
1.106 L |
|
Belgium |
208.53 |
L |
399.89 |
L |
0.856 L |
1.357 L |
|
Canada |
219.80 |
L |
454.48 |
L |
0.539 L |
0.581 L |
|
Chinese Taipei |
236.27 |
L |
x L |
0.428 L |
0.583 L |
||
Czech Republic |
180.37 |
L |
425.22 |
L |
0.733 L |
0.964 L |
|
Denmark |
313.81 |
L |
950.50 |
L |
0.923 L |
1.395 L |
|
Finland |
272.73 |
L |
474.97 |
L |
0.806 L |
1.354 L |
|
France |
214.90 |
L |
488.86 |
L |
0.848 L |
1.263 L |
|
Germany |
203.88 |
L |
432.46 |
L |
0.944 L |
1.356 L |
|
Greece |
267.75 |
L |
396.30 |
L |
0.700 L |
0.972 L |
|
Hungary |
213.66 |
L |
x L |
0.810 L |
1.128 L |
||
India |
285.79 |
L |
284.02 |
L |
0.535 L |
0.767 L |
|
Ireland |
308.76 |
L |
551.29 |
L |
0.849 L |
1.121 L |
|
Italy |
268.81 |
L |
1054.39 |
L |
0.914 L |
1.330 L |
|
Japan |
320.69 |
L |
432.78 |
L |
0.615 L |
0.979 L |
|
Korea |
336.30 |
L |
598.84 |
L |
0.713 L |
1.138 L |
|
Luxembourg |
194.96 |
L |
383.00 |
L |
0.686 L |
1.065 L |
|
Mexico |
145.13 |
L |
.. L |
0.602 L |
0.553 L |
||
Netherlands |
245.23 |
L |
751.04 |
L |
0.862 L |
1.493 L |
|
New Zealand |
407.96 |
L |
.. L |
0.382 L |
0.741 L |
||
Norway |
.. L |
732.83 |
L |
0.939 L |
1.366 L |
||
Poland |
144.11 |
L |
436.23 |
L |
0.627 L |
0.920 L |
|
Portugal |
312.73 |
L |
x L |
0.826 L |
1.206 L |
||
South Africa |
184.01 |
L |
.. L |
0.426 L |
0.492 L |
||
Slovak Republic |
209.81 |
L |
362.82 |
L |
0.819 L |
1.029 L |
|
Spain |
257.61 |
L |
468.71 |
L |
0.744 L |
1.014 L |
|
Sweden |
c L |
992.55 |
L |
0.867 L |
1.297 L |
||
Switzerland |
229.59 L |
344.06 |
L |
0.922 L |
1.044 L |
||
Turkey |
336.80 L |
953.96 |
L |
1.031 L |
1.327 L |
||
United Kingdom |
258.44 L |
338.49 |
L |
1.215 L |
1.408 L |
||
United States |
210.82 L |
398.44 |
L |
0.420 L |
0.443 L |
||
|
(a) Prices are for 1st Quarter 2004, or latest available (L). (b) High sulphur fuel oil for Canada, India, Ireland, Mexico, |
42 |
New Zealand, Poland, Turkey and the United States; low sulphur fuel oil for all other countries. (c) For commercial purposes. |
(d) Unleaded premium gasoline (95 RON); unleaded regular for Australia, Canada, Japan, Korea, Mexico, New Zealand |
|
|
|

IN SELECTED COUNTRIES in US Dollars/Unit
Nat Gas for |
|
Nat Gas for |
Steam Coal |
Electricity for |
Electricity for |
|
|||||
Industry |
|
Households |
for Industry(f) |
Industry(g) |
Households(g) |
|
|||||
(107 kcal GCV(e)) |
|
(107 kcal GCV(e)) |
(tonne) |
|
(kWh) |
|
(kWh) |
|
|
||
.. L |
|
.. L |
.. L |
0.0357 |
L |
0.0619 |
L |
Australia |
|||
.. L |
|
510.63 |
L |
.. L |
0.0964 |
L |
0.1771 |
L |
Austria |
||
c L |
|
.. L |
.. L |
.. L |
.. L |
Belgium |
|||||
204.01 |
L |
|
403.19 |
L |
.. L |
.. L |
.. L |
Canada |
|||
307.75 |
L |
|
389.8 |
L |
.. L |
0.0532 |
L |
0.0738 |
L |
Chinese Taipei |
|
212.66 |
L |
|
338.22 |
L |
21.25 |
L |
0.0618 |
L |
0.0888 |
L |
Czech Republic |
c L |
|
978.02 |
L |
.. L |
0.0950 |
L |
0.2856 |
L |
Denmark |
||
169.14 |
L |
|
268.26 |
L |
110.33 |
L |
0.0735 |
L |
0.1264 |
L |
Finland |
238.32 |
L |
|
544.07 |
L |
128.06 |
L |
0.0501 |
L |
0.1417 |
L |
France |
.. L |
|
.. L |
.. L |
0.0485 |
L |
0.1356 |
L |
Germany |
|||
213.75 |
L |
|
399.60 |
L |
.. L |
0.0638 |
L |
0.1096 |
L |
Greece |
|
280.39 |
L |
|
366.55 |
L |
.. L |
0.0901 |
L |
0.1305 |
L |
Hungary |
|
.. L |
|
.. L |
31.02 |
L |
.. L |
0.0354 |
L |
India |
|||
257.5 |
L |
|
469.88 |
L |
.. L |
0.1099 |
L |
0.1633 |
L |
Ireland |
|
c L |
|
c L |
46.71 |
L |
0.1477 |
L |
0.2000 |
L |
Italy |
||
357.04 |
L |
|
1086.36 |
L |
42.92 |
L |
0.1148 |
L |
0.1742 |
L |
Japan |
.. L |
|
.. L |
55.31 |
L |
0.0503 |
L |
0.0738 |
L |
Korea |
||
.. L |
|
272.69 |
L |
.. L |
.. L |
0.1117 |
L |
Luxembourg |
|||
191.61 |
L |
|
.. L |
x L |
0.0585 |
L |
0.0981 |
L |
Mexico |
||
226.78 |
L |
|
683.20 |
L |
.. L |
c L |
0.2219 |
L |
Netherlands |
||
307.69 |
L |
|
596.90 |
L |
c L |
0.0520 |
L |
0.1159 |
L |
New Zealand |
|
x L |
|
x L |
.. L |
0.0440 |
L |
0.0695 |
L |
Norway |
|||
173.18 |
L |
|
324.22 |
L |
47.73 |
L |
0.0602 |
L |
0.0971 |
L |
Poland |
271.10 |
L |
|
900.90 |
L |
45.53 |
L |
0.0934 |
L |
0.1764 |
L |
Portugal |
233.37 |
L |
|
x L |
12.25 |
L |
0.0122 |
L |
0.0317 |
L |
South Africa |
|
241.65 |
L |
|
349.66 |
L |
.. L |
0.0836 |
L |
0.1237 |
L |
Slovak Republic |
|
213.19 |
L |
|
642.06 |
L |
.. L |
0.0484 |
L |
0.1139 |
L |
Spain |
|
.. L |
|
.. L |
.. L |
.. L |
.. L |
Sweden |
|||||
342.23 |
L |
|
599.44 |
L |
66.33 |
L |
0.0849 L |
0.1415 L |
Switzerland |
||
227.77 |
L |
|
256.90 |
L |
51.31 |
L |
0.0917 L |
0.0960 L |
Turkey |
||
202.65 |
L |
|
409.43 |
L |
69.60 |
L |
0.0608 L |
0.1336 L |
United Kingdom |
||
253.36 |
L |
|
366.90 |
L |
40.84 |
L |
0.0490 L |
0.0830 L |
United States |
||
|
|
|
|
|
|
|
|
|
|
|
|
and the United States; |
leaded regular for India. (e) Gross calorific value. (f) Brown coal for the Czech Republic and Turkey. |
||||||||||
(g) Price excluding tax for Australia and the United States. (L) Latest data available. |
|
|
|
||||||||
.. not available |
x |
not applicable |
c |
confidential |
|
|
|
|
|
|
|
5 |
43
E |
|
|
|
|
|
|
M |
|
|
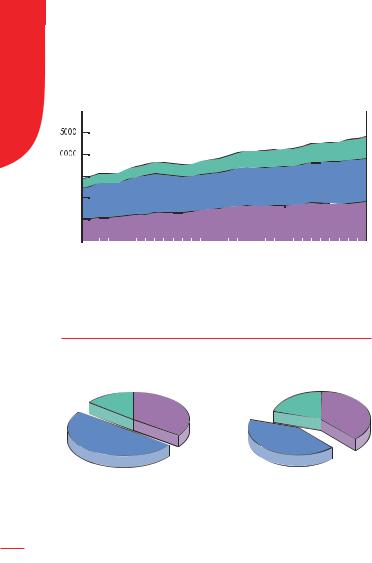
CO2 Emissions by Fuel |
|||
I |
|
|
||||
S |
|
|
|
|
|
|
|
|
|
|
|
|
|
|
|
|
|
|
|
|
S |
|
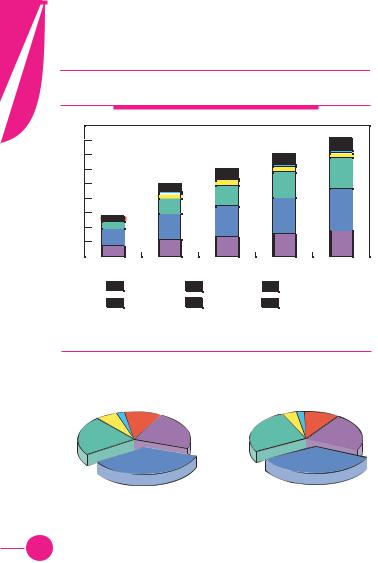
Evolution from 1971 to 2002 of World* CO2 Emissions** |
||||
I |
|
|||||
|
|
|
by Fuel (Mt of CO2) |
|||
O |
|
|
|
|||
3 0000 |
|
|
|
|
||
N |
|
|
|
|
||
|
|
|
|
|
|
|
S |
2 |
|
|
|
|
|
|
2 |
|
|
|
|
|
5000
0000
5000
0  1972 1974 1976 1978 1980 1982 1984 1986 1988 1990 1992 1994 1996 1998 2000 2002
 Coal
Coal  Oil
Oil  Gas
Gas  Other***
1973 and 2002 Fuel Shares of
CO2 Emissions**
|
1973 |
|
2002 |
|
Gas |
Coal |
Gas |
Other*** |
Coal |
0.3% |
||||
14.4 |
34.9% |
20.4% |
|
37.5% |
50.7% |
|
41.8% |
|
|
|
|
|
|
15 668 Mt of CO2 |
|
24 102 Mt of CO2 |
|
* World includes international marine bunkers and aviation bunkers. ** Calculated using |
|
IEA’s Energy Balance Tables and the Revised 1996 IPCC Guidelines. |
44 |
includes industrial waste |
waste. |
|
|
|
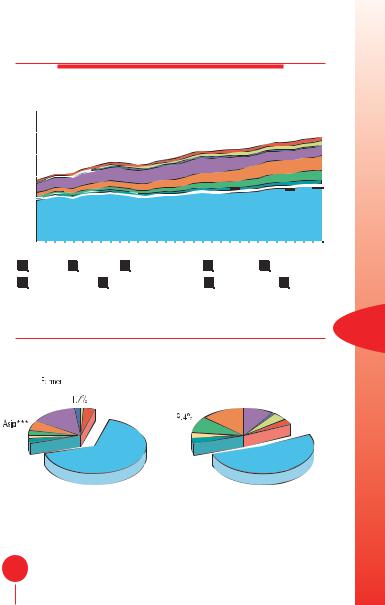
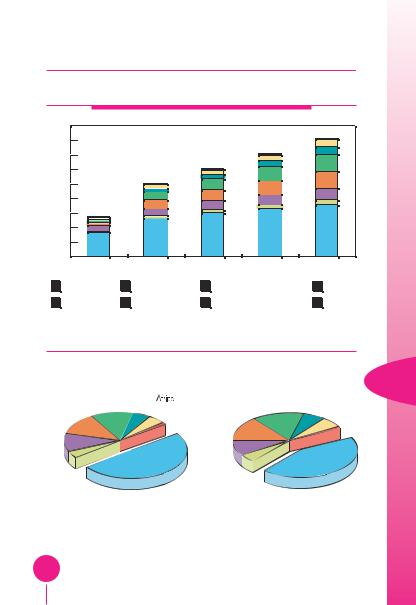
CO2 Emissions by Region
Evolution from 1971 to 2002 of World* CO2 Emissions** by Region (Mt of CO2)
30000 
25000 
2 0000 
5000 


0000 


5000 
0  1972 1974 1976 1978 1980 1982 1984 1986 1988 1990 1992 1994 1996 1998 2000 2002
|
OECD |
|
Africa |
|
|
Latin America |
|
Asia*** |
|
China |
|||
|
|
|
|
|
|
||||||||
|
|
|
|
|
|
Middle East |
|
|
Bunkers |
||||
|
Former USSR |
|
Non-OECD Europe |
|
|
|
|||||||
|
|
|
|
|
|||||||||
1973 and 2002 Regional Shares of
CO2 Emissions**
1973 |
|
|
|
2002 |
|
|||
|
Non- |
Middle |
|
|
Former |
|
|
|
|
OECD |
|
|
Non-OECD |
||||
|
USSR Europe |
East |
China |
USSR |
||||
|
Europe 1.0% |
|||||||
a 14.4% |
1.0% |
|
Asia*** 13.7% |
9.3% |
||||
|
Middle East |
|||||||
Bunkers 3.7% |
|
|||||||
|
|
|
|
|
4.5% |
|||
|
|
|
|
|
|
|
||
|
|
|
|
Africa |
|
Bunkers 3.4% |
||
|
|
|
|
3.1% |
|
|
|
|
tin |
|
|
Latin |
|
|
|
||
|
|
America |
|
|
|
|||
erica |
OECD 65.9% |
3.5% |
|
|
OECD 52.1% |
|||
.7% |
|
|
|
|
||||
|
|
|
|
|
|
|||
|
15 668 Mt of CO2 |
|
|
24 102 Mt of CO2 |
|
|||
includes international marine bunkers and aviation bunkers, which are shown together Bunkers. ** Calculated using IEA’s Energy Balance Tables and the Revised 1996 IPCC Guidelines. CO2 emissions are from fuel combustion only. *** Asia excludes China.
6 |
45
O U T L O O K
O U T L O O K F O R W O R L D T P E S
TPES* Outlook by Fuel
(Mtoe)
18000 |
|
|
|
|
16000 |
|
|
|
|
14000 |
|
|
|
|
12000 |
|
|
|
|
10000 |
|
|
|
|
8000 |
|
|
|
|
6000 |
|
|
|
|
4000 |
|
|
|
|
2000 |
|
|
|
|
0 |
2000 |
2010 |
2020 |
2030 |
1971 |
|
Coal |
|
Oil* |
|
|
Gas |
|
|
|
|
|||
|
Nuclear |
|
Hydro |
|
|
Other** |
|
|
|
|
|||
|
|
|
|
Fuel Shares of TPES* in 2010 and 2030
|
|
2010 |
|
2030 |
|
|||
|
|
|
|
|
|
|
||
Nuclear |
Hydro |
Other** |
|
Hydro |
Other** |
|||
2.3% |
10.9% Coal |
Nuclear 2.2% |
10.1% Coal |
|||||
6.2% |
|
|
22.3% |
4.3% |
|
22.1% |
||
Gas |
|
Gas |
||||||
|
|
|
|
|
||||
23.1% |
|
|
|
|
25.8% |
|
|
|
|
|
|
|
Oil* |
|
|
|
Oil* |
|
|
|
35.3% |
|
|
35.4% |
||
|
|
|
|
|
|
|
||
|
|
|
|
|
|
|
|
|
|
|
12 100 Mtoe |
|
|
16 300 Mtoe |
|
||
* Includes bunkers.
46 |
** Other includes combustible renewables & waste, geothermal, solar, wind, tide, etc. |
|
T O 2 0 3 0
TPES Outlook by Region
(Mtoe)
18000
16000
14000
12000
10000
8000 |
|
|
|
|
6000 |
|
|
|
|
4000 |
|
|
|
|
2000 |
|
|
|
|
0 |
2000 |
2010 |
2020 |
2030 |
1971 |
|
OECD |
|
Middle East |
|
|
Transition Economies* |
|
China |
|
|
|
|
|
||||
|
Asia** |
|
Latin America |
|
Africa |
|
Bunkers |
|
|
|
|
|
|||||
|
|
|
|
|||||
Regional Shares of TPES in 2010 and 2030
|
|
2010 |
|
|
|
|
2030 |
|
|
|
|
|
|
Asia** |
Latin |
|
|
|
Latin |
|
|
|
|
|
|
America |
|
Asia** |
America |
Africa |
|||||
|
China |
12.4% |
5.0% 5.2% |
|
14.7% |
6.3% |
6.2% |
|
|||
|
|
|
Bunkers |
|
|
|
|
Bunkers |
|||
12.5% |
|
|
China |
|
|
||||||
|
1.2% |
|
|
1.1% |
|||||||
|
|
|
|
14.3% |
|
|
|||||
|
|
|
|
|
|
|
|
|
|
|
|
Transition |
|
|
|
|
Transition |
|
|
|
|
||
Economies* |
|
|
|
Economies* |
|
|
|
|
|||
10.2% |
|
|
|
|
9.2% |
|
|
|
|
|
|
|
Middle |
|
|
|
|
Middle East |
|
|
|
|
|
|
East |
|
|
OECD |
|
|
|
OECD |
|||
|
|
|
|
4.6% |
|
|
|
||||
4.0% |
|
49.5% |
|
|
|
|
43.7% |
||||
|
|
|
|
|
|
|
|
|
|
||
|
|
12 100 Mtoe |
|
|
|
16 300 Mtoe |
|
|
|
||
|
|
|
*Includes Former USSR and Non-OECD Europe. |
|
|
|
|||||
|
|
|
|
** Asia excludes China. |
|
|
|
|
|||
7 |
47

E |
|
|
|
|
|
|
|
|
|
|
|
|
N |
|
Selected Energy Indicators for 2002 |
||||||||||
E |
|
|||||||||||
R |
|
|
|
|
|
|
|
|
|
|
|
|
|
|
|
|
|
|
|
|
|
|
|
|
|
|
|
|
|
|
|
|
|
|
|
|
|
|
G |
|
|
|
|
|
|
|
|
|
|
|
|
Y |
|
Region/ |
Popul- |
|
GDP |
GDP |
Energy |
Net |
|
TPES |
Elec. |
CO2 |
|
|
|
|
|||||||||
I |
|
Country |
ation |
|
|
(PPP) |
Prod. |
Imports |
|
|
Cons.* |
Emissions** |
|
|
(million) |
(billion |
(billion |
(Mtoe) |
(Mtoe) |
|
(Mtoe) |
(TWh) |
(Mt |
||
N |
|
|
|
95 US$) |
95 US$) |
|
|
|
|
|
of CO2) |
|
D |
|
World |
6195.66 |
35317.65 |
43413.48 |
10305.74 |
– |
10230.67 |
14701.24 |
24101.83 |
||
I |
|
|||||||||||
|
OECD |
1145.06 |
28435.02 |
25374.85 |
3847.06 |
1563.62 |
5345.72 |
9212.82 |
12554.03 |
|||
C |
|
|||||||||||
|
Middle East |
172.76 |
630.06 |
1025.83 |
1250.81 |
–807.94 |
431.30 |
459.42 |
1092.84 |
|||
A |
|
|||||||||||
|
Former USSR |
286.76 |
630.57 |
1552.10 |
1349.21 |
–412.38 |
930.53 |
1117.33 |
2232.17 |
|||
T |
|
|||||||||||
|
|
|
|
|
|
|
|
|
|
|
|
|
O |
|
Non–OECD Europe |
57.82 |
147.25 |
358.26 |
62.55 |
39.82 |
99.68 |
157.64 |
252.84 |
||
R |
|
China |
1287.19 |
1381.62 |
5359.02 |
1220.86 |
38.65 |
1244.95 |
1554.37 |
3307.42 |
||
S |
|
Asia |
1988.11 |
1857.30 |
5507.94 |
1040.41 |
164.67 |
1183.91 |
1119.01 |
2257.41 |
||
|
|
Latin America |
425.54 |
1593.05 |
2566.74 |
628.18 |
–161.20 |
454.75 |
652.74 |
844.61 |
||
|
|
Africa |
832.43 |
642.78 |
1668.75 |
906.65 |
–360.26 |
539.85 |
427.93 |
743.12 |
||
|
|
|
|
|
|
|
|
|
|
|
|
|
|
|
|
|
|
|
|
|
|
|
|
|
|
|
|
Albania |
3.15 |
4.03 |
13.46 |
0.77 |
1.17 |
1.94 |
4.49 |
3.88 |
||
|
|
Algeria |
31.32 |
52.14 |
161.27 |
150.29 |
–118.89 |
30.85 |
23.28 |
73.29 |
||
|
|
|
|
|
|
|
|
|
|
|
|
|
|
|
Angola |
13.12 |
8.18 |
29.17 |
51.55 |
–42.81 |
8.81 |
1.52 |
6.31 |
||
|
|
Argentina |
36.48 |
249.60 |
347.34 |
81.69 |
–24.63 |
56.30 |
75.96 |
115.02 |
||
|
|
|
|
|
|
|
|
|
|
|
|
|
|
|
Armenia |
3.07 |
2.33 |
8.76 |
0.74 |
1.20 |
1.94 |
3.75 |
2.79 |
||
|
|
Australia |
19.75 |
480.85 |
492.30 |
255.19 |
–138.59 |
112.71 |
207.43 |
342.85 |
||
|
|
|
|
|
|
|
|
|
|
|
|
|
|
|
Austria |
8.05 |
274.58 |
211.77 |
9.93 |
20.64 |
30.44 |
60.02 |
66.14 |
||
|
|
Azerbaijan |
8.17 |
5.22 |
21.81 |
19.75 |
–8.17 |
11.73 |
17.18 |
25.54 |
||
|
|
|
|
|
|
|
|
|
|
|
|
|
|
|
Bahrain |
0.70 |
7.60 |
10.07 |
15.27 |
–8.96 |
6.87 |
6.74 |
15.60 |
||
|
|
Bangladesh |
135.68 |
53.76 |
205.96 |
16.75 |
4.31 |
21.00 |
14.64 |
31.53 |
||
|
|
|
|
|
|
|
|
|
|
|
|
|
|
|
Belarus |
9.93 |
20.80 |
48.21 |
3.59 |
21.28 |
24.77 |
29.60 |
56.02 |
||
|
|
Belgium |
10.33 |
320.84 |
254.33 |
13.25 |
49.61 |
56.89 |
85.89 |
112.55 |
||
|
|
|
|
|
|
|
|
|
|
|
|
|
|
|
Benin |
6.55 |
2.90 |
6.28 |
1.55 |
0.71 |
2.23 |
0.50 |
1.87 |
||
|
|
Bolivia |
8.81 |
8.28 |
19.24 |
8.15 |
–3.92 |
4.31 |
3.65 |
8.64 |
||
|
|
|
|
|
|
|
|
|
|
|
|
|
|
|
Bosnia and Herzegovina |
4.11 |
6.89 |
22.38 |
3.32 |
1.18 |
4.32 |
7.86 |
15.22 |
||
|
|
Brazil |
174.49 |
809.93 |
1165.62 |
161.74 |
31.08 |
190.66 |
321.55 |
309.31 |
||
|
|
|
|
|
|
|
|
|
|
|
|
|
|
** |
Gross production + imports – exports – transmission/distribution losses. |
|
** |
CO2 emissions from fuel combustion only. Emissions are calculated using IEA's energy balances and the Revised |
|
||
48 |
|
1996 IPCC Guidelines. |
|
|
|
|
|
|