

B Y F U E L
The OECD
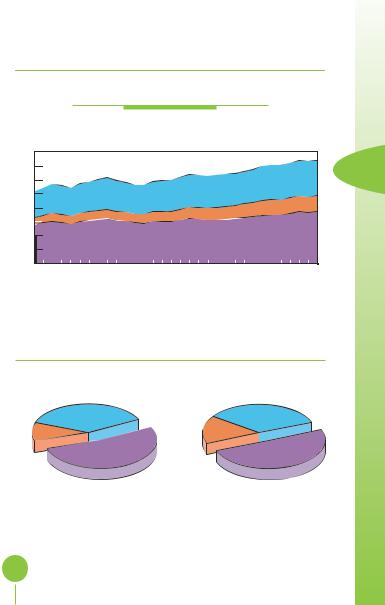
Evolution from 1971 to 2002 of OECD Total Final Consumption by Fuel (Mtoe)
4 000 
500 
0  1972 1974 1976 1978 1980 1982 1984 1986 1988 1990 1992 1994 1996 1998 2000 2002
|
Coal |
|
|
Oil |
|
|
Gas |
|
|
|
|
||||
|
Combustible Renewables & Waste |
|
|
Electricity |
|
Other* |
|
|
|
|
|
||||
1973 and 2002 Fuel Shares of
Total Final Consumption
|
|
1973 |
|
|
|
2002 |
|
|
|
|
Combustible |
Electricity |
Other* |
Electricity |
Other* |
Coal |
|||||
Renewables |
11.4% |
0.8% Coal |
Combustible 19.7% |
1.4% |
3.3% |
|
||||
& Waste |
|
10.1% |
Renewables |
|
|
|
|
|||
2.9% |
|
|
|
& Waste |
|
|
|
|
||
|
|
|
|
|
3.2% |
|
|
|
|
|
|
Gas |
|
|
|
Gas |
|
|
|
|
|
18.1% |
|
|
|
|
|
|
|
|||
|
|
|
|
Oil |
19.7% |
|
|
|
Oil |
|
|
|
|
56.7% |
|
|
|
52.7% |
|||
|
|
|
|
|
|
|
|
|
|
|
|
|
2 841 Mtoe |
|
|
3 692 Mtoe |
|
|
|||
*Other includes geothermal, solar, wind, heat, etc.
3 |
29

C |
|
|
|
|
|
|
|
|
O |
T O T A L F I N A L C O N S U M P T I O N |
|||||||
N |
||||||||
S |
||||||||
U |
|
|
|
|
The World |
|||
M |
|
|
|
|
||||
P |
|
|
|
|
|
|
|
|
|
|
|
|
|
|
|
||
T |
Evolution from 1971 to 2002 of World Total Final Consumption* |
|||||||
I |
||||||||
|
|
|
|
by Region (Mtoe) |
||||
O |
|
|
|
|
||||
8000 |
|
|
|
|
|
|
||
N |
|
|
|
|
|
|
||
7000 |
|
|
|
|
|
|
||
|
|
|
|
|
|
|
||
|
6000 |
|
|
|
|
|
|
|
|
|
|
|
|
|
|
||
|
5000 |
|
|
|
|
|
|
|
|
|
|
|
|
|
|
||
|
4000 |
|
|
|
|
|
|
|
|
|
|
|
|
|
|
||
|
3000 |
|
|
|
|
|
|
|
|
|
|
|
|
|
|
||
|
2000 |
|
|
|
|
|
|
|
|
|
|
|
|
|
|
||
|
1000 |
|
|
|
|
|
|
|
|
|
|
|
|
|
|
||
|
0 |
|
|
|
|
|
|
|
1972 |
1974 1976 |
1978 |
1980 |
1982 |
1984 |
1986 1988 |
1990 |
1992 |
1994 1996 |
1998 |
2000 |
2002 |
||||||
|
OECD |
|
|
Middle East |
|
|
|
Former USSR |
|
|
Non-OECD Europe |
|||||||
|
|
|
|
|
|
|
|
|||||||||||
|
|
|
|
|
|
|
|
|||||||||||
|
China |
|
|
Asia** |
|
|
|
|
Latin America |
|
|
Africa |
|
|
||||
|
|
|
|
|
|
|
|
|
|
|
||||||||
|
|
|
|
|
|
|
|
|
|
|
||||||||
1973 and 2002 Regional Shares of
Total Final Consumption*
|
|
|
1973 |
|
|
|
|
2002 |
|
||
|
Non- |
|
|
Latin |
|
|
|
|
Latin |
||
|
OECD |
|
|
|
|
|
|
||||
Former |
Europe |
5.8% |
4.9% America |
Non- |
China |
12.0% |
America |
||||
|
|
|
|
OECD |
11.6% |
5.0% Africa |
|||||
USSR |
|
|
|
|
Africa |
|
|||||
|
|
|
|
Europe |
|
|
|
.7% |
|||
14.1 |
|
|
|
|
|
|
|
||||
|
|
|
2.8% |
0.9% |
|
|
|
|
|
||
|
|
|
|
|
|
Former |
|
|
|
|
|
East |
|
|
|
|
|
USSR |
|
|
|
|
|
|
|
|
|
|
8.6% |
|
|
|
|
|
|
2.1% |
|
|
|
|
|
|
|
|
|
|
|
|
|
|
|
|
Middle |
|
|
|
|
|
|
|
|
|
|
|
CD |
|
|
|
|
|
|
|
|
|
|
|
East |
|
|
|
|
|
|
|
|
|
|
|
6 .5% |
4.1% |
|
|
|
|
52.1% |
|
|
4 549 Mtoe |
|
|
|
|
7 095 Mtoe |
|
|||
* Prior to 1994 combustible renewables & waste final consumption has been estimated
based on TPES. **Asia excludes China.
30
B Y R E G I O N
The OECD
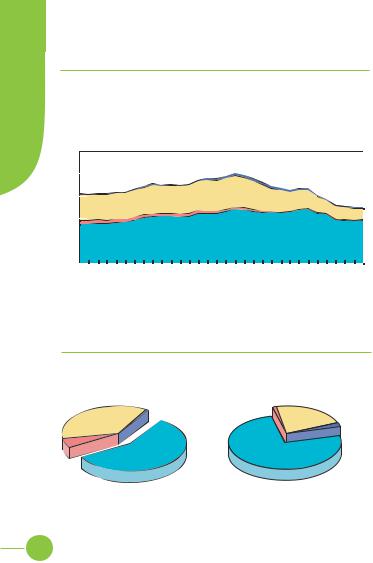
Evolution from 1971 to 2002 of OECD Total Final Consumption by Region (Mtoe)
4000
3500
3000
2500
2000
1500 

1000
500
0 


 1972 1974 1976 1978 1980 1982 1984 1986 1988 1990 1992 1994 1996 1998 2000 2002
 OECD North America
  OECD Pacific
  OECD Europe
1973 and 2002 Regional Shares of
Total Final Consumption
|
1973 |
|
2002 |
|
|
||
|
|
|
|
||||
|
OECD Europe |
OECD Europe |
|
||||
36.9% |
|
|
34.3% |
|
|
|
|
OECD |
OECD |
|
|||||
Pacific |
Pacific |
|
|||||
10.5% |
OECD North America |
15.8% |
OECD North America |
|
|||
|
|
|
|
||||
52.6% |
|
49.9% |
|
|
|||
|
|
|
|
|
|
|
|
|
|
|
|
|
|
|
|
|
|
2 841 Mtoe |
|
|
3 692 Mtoe |
|
|
3 |
31
C |
|
|
|
|
|
|
|
|
|
|
|
|
|
|
|
|
|
|
O |
T O T A L F I N A L C O N S U M P T I O N |
|||||||||||||||||
N |
||||||||||||||||||
S |
||||||||||||||||||
U |
|
|
|
|
|
|
|
|
Coal |
|
|
|
|
|
|
|||
M |
|
|
|
|
|
|
|
|
|
|
|
|
|
|
||||
P |
|
|
|
|
|
|
|
|
|
|
|
|
|
|
|
|
|
|
|
|
|
|
|
|
|
|
|
|
|
|
|
|
|
|
|
|
|
T |
|
Evolution from 1971 to 2002 of Total Final Consumption |
|
|||||||||||||||
I |
|
|
||||||||||||||||
|
|
|
|
|
|
|
by Sector (Mtoe) |
|
|
|
|
|
||||||
O |
|
|
|
|
|
|
|
|
|
|
|
|
||||||
1000 |
|
|
|
|
|
|
|
|
|
|
|
|
|
|
|
|
|
|
N |
|
|
|
|
|
|
|
|
|
|
|
|
|
|
|
|
|
|
|
|
|
|
|
|
|
|
|
|
|
|
|
|
|
|
|
|
|
|
800 |
|
|
|
|
|
|
|
|
|
|
|
|
|
|
|
|
|
|
|
|
|
|
|
|
|
|
|
|
|
|
|
|
|
|
|
|
|
600 |
|
|
|
|
|
|
|
|
|
|
|
|
|
|
|
|
|
|
|
|
|
|
|
|
|
|
|
|
|
|
|
|
|
|
|
|
|
400 |
|
|
|
|
|
|
|
|
|
|
|
|
|
|
|
|
|
|
|
|
|
|
|
|
|
|
|
|
|
|
|
|
|
|
|
|
|
200 |
|
|
|
|
|
|
|
|
|
|
|
|
|
|
|
|
|
|
|
|
|
|
|
|
|
|
|
|
|
|
|
|
|
|
|
|
|
0 |
|
|
|
|
|
|
|
|
|
|
|
|
|
|
|
|
|
|
1972 |
1974 1976 |
1978 |
1980 |
1982 |
1984 |
1986 1988 |
1990 |
1992 |
1994 1996 |
1998 |
2000 |
2002 |
|||||
 Industry
  Transport
  Other sectors*
  Non-energy use
1973 and 2002 Shares of
World Coal Consumption
|
|
1973 |
|
|
|
2002 |
|
Other sectors* |
Non-energy |
Transport |
Other sectors* |
||||
36.3% |
|
use |
21.1% |
|
|||
|
1.1% |
|
|
||||
|
|
0.8% |
|
Non-energy |
|||
|
|
|
|
|
use |
||
|
|
|
|
|
|
|
|
|
|
|
|
|
|
2.3% |
|
Transport |
|
|
Industry 75.5% |
|
|
||
5.3% |
|
Industry 57.6% |
|
|
|||
|
|
|
|
|
|
|
|
|
|
622 Mtoe |
|
|
|
505 Mtoe |
|
*Other sectors comprises agriculture, commercial & public service, residential
and non-specified.
32
B Y S E C T O R
Oil
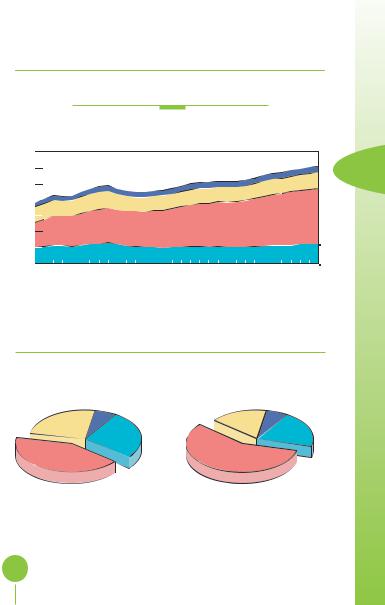
Evolution from 1971 to 2002 of Total Final Consumption by Sector (Mtoe)
3500
3000
2500
2000 


1500 

1000
500 


0 


 1972 1974 1976 1978 1980 1982 1984 1986 1988 1990 1992 1994 1996 1998 2000 2002
 Industry
  Transport
  Other sectors*
  Non-energy use
1973 and 2002 Shares of
World Oil Consumption
1973 |
|
2002 |
|
|
Other sectors* |
Non-energy |
Other sectors* |
Non-energy |
|
use |
use |
|||
24.6% |
16.5% |
|||
6.4% |
6.2% |
|||
|
|
|
|
Industry |
|
|
Industry |
|
|
|
26.7% |
|
|
||
Transport 42.3% |
Transport 57.2% |
20.1% |
||||
|
||||||
|
|
|||||
|
|
|
|
|
|
|
|
2 141 Mtoe |
|
|
3 054 Mtoe |
|
|
*Other sectors comprises agriculture, commercial & public service, residential and non-specified.
3 |
33

C |
|
|
|
|
|
|
|
|
|
|
|
|
|
|
|
|
|
|
O |
T O T A L F I N A L C O N S U M P T I O N |
|||||||||||||||||
N |
||||||||||||||||||
S |
||||||||||||||||||
U |
|
|
|
|
|
|
|
|
Gas |
|
|
|
|
|
|
|||
M |
|
|
|
|
|
|
|
|
|
|
|
|
|
|
||||
P |
|
|
|
|
|
|
|
|
|
|
|
|
|
|
|
|
|
|
|
|
|
|
|
|
|
|
|
|
|
|
|
|
|
|
|
|
|
T |
|
Evolution from 1971 to 2002 of Total Final Consumption |
|
|||||||||||||||
I |
|
|
||||||||||||||||
O |
1200 |
|
|
|
|
|
|
by Sector (Mtoe) |
|
|
|
|
|
|||||
|
|
|
|
|
|
|
|
|
|
|
|
|
|
|
|
|
||
N |
1000 |
|
|
|
|
|
|
|
|
|
|
|
|
|
|
|
|
|
|
|
|
|
|
|
|
|
|
|
|
|
|
|
|
|
|
|
|
|
|
|
|
|
|
|
|
|
|
|
|
|
|
|
|
|
|
|
|
800 |
|
|
|
|
|
|
|
|
|
|
|
|
|
|
|
|
|
|
|
|
|
|
|
|
|
|
|
|
|
|
|
|
|
|
|
|
|
600 |
|
|
|
|
|
|
|
|
|
|
|
|
|
|
|
|
|
|
|
|
|
|
|
|
|
|
|
|
|
|
|
|
|
|
|
|
|
400 |
|
|
|
|
|
|
|
|
|
|
|
|
|
|
|
|
|
|
|
|
|
|
|
|
|
|
|
|
|
|
|
|
|
|
|
|
|
200 |
|
|
|
|
|
|
|
|
|
|
|
|
|
|
|
|
|
|
|
|
|
|
|
|
|
|
|
|
|
|
|
|
|
|
|
|
|
0 |
|
|
1974 1976 |
1978 |
1980 |
1982 |
1984 |
1986 1988 |
1990 |
1992 |
1994 1996 |
1998 |
2000 |
2002 |
|||
|
1972 |
|||||||||||||||||
 Industry
  Transport
  Other sectors*
1973 and 2002 Shares of
World Gas Consumption
1973 |
2002 |
Other sectors* |
Other sectors* |
40.7% |
50.3% |
Transport
2.6%
|
|
Transpor |
|
|
Industry 56.7% |
5.0% |
Industry 44.7% |
||
|
|
|
|
|
672 Mtoe |
|
|
1 153 Mtoe |
|
*Other sectors comprises agriculture, commercial & public service, residential
and non-specified.
34

B Y S E C T O R
Electricity
Evolution from 1971 to 2002 of Total Final Consumption by Sector (Mtoe)
1200
1000
800
600
400 
200 


0 


 1972 1974 1976 1978 1980 1982 1984 1986 1988 1990 1992 1994 1996 1998 2000 2002
 Industry
  Transport
  Other sectors*
1973 and 2002 Shares of
World Electricity Consumption
1973 |
2002 |
Other sectors* |
Other sectors* |
46.3% |
56.7% |
3 |
Transport |
Transport |
|
|
|||
2.4% |
|
|
|
|
||
|
Industry 51.3% |
1.8% |
|
Industry 41.5% |
||
|
|
|
|
|
|
|
|
439 Mtoe |
|
|
|
1 139 Mtoe |
|
*Other sectors comprises agriculture, commercial & public service, residential and non-specified.
35

E |
|
|
|
|
|
|
|
|
|
|
|
|
|
|
|
|
|
|
|
|
|
N |
|
|
|
|
|
|
SIMPLIFIED ENERGY |
||||||||||||||
E |
|
|
|
|
|
|
|||||||||||||||
R |
|
|
|
|
|
|
|||||||||||||||
G |
|
|
|
|
|
|
|
|
|
|
|
|
|
|
|
|
|
|
|
|
|
Y |
|
|
|
|
|
|
The World |
|
|
|
|
|
|
|
|
||||||
B |
|
|
|
|
|
|
|
|
1973 |
|
|
|
|
|
|
|
|
|
|
||
A |
|
|
|
|
|
|
|
|
|
|
|
|
|
|
|
|
|
(Mtoe) |
|||
|
|
|
|
|
|
|
|
|
|
|
|
|
|
|
|
|
|
|
|
||
L |
|
|
|
|
|
|
|
|
|
|
|
|
|
|
|
|
|
|
|
|
|
|
|
|
|
|
|
|
|
|
|
|
|
|
|
|
|
|
|
|
|
|
|
|
|
SUPPLY AND |
|
|
|
Crude |
|
|
|
|
|
|
|
|
|
|
|
|
|
|
|
|
|
Coal |
|
|
Petroleum |
|
|
|
Nuclear |
|
Hydro |
|
Combustible |
|
Other** |
|
|
||||
A |
|
|
|
|
Gas |
|
|
|
|
|
|
Total |
|||||||||
N |
|
CONSUMPTION |
|
|
|
Oil |
|
Products |
|
|
|
|
|
|
|
Renewables |
|
|
|
|
|
|
|
|
|
|
|
|
|
|
|
|
|
|
|
|
|
|
|
|
|
|
|
|
|
|
|
|
|
|
|
|
|
|
|
|
|
|
& Waste* |
|
|
|
|
|
|
C |
|
|
|
|
|
|
|
|
|
|
|
|
|
|
|
|
|
|
|
|
|
E |
|
Indigenous Prod. |
|
1476.05 |
|
2935.79 |
|
– |
|
993.91 |
|
53.05 |
|
110.23 |
|
673.07 |
|
6.13 |
|
6248.23 |
|
|
|
Imports |
|
|
|
1577.05 |
|
|
|
73.41 |
|
– |
|
– |
|
|
|
8.15 |
|
2208.53 |
|
S |
|
140.01 |
|
|
409.81 |
|
|
|
|
0.11 |
|
|
|||||||||
|
|
Exports |
|
–130.35 |
|
–1611.07 |
|
|
|
–72.80 |
|
|
|
|
|
|
|
|
|
|
–2263.67 |
|
|
|
|
–440.98 |
|
|
– |
|
– |
|
–0.19 |
|
|
–8.27 |
|
||||||
|
|
|
|
|
|
|
|
|
|
|
|
|
|
|
|
|
|
|
|
|
|
|
|
Stock Changes |
|
12.22 |
|
–21.83 |
|
–16.07 |
|
–15.00 |
|
– |
|
– |
|
–0.23 |
|
|
– |
|
–40.91 |
|
|
|
|
|
|
|
|
|
|
|
|
|
|
|
|
|
|
|
|
|
|
|
|
|
|
|
|
|
|
|
|
|
|
|
|
|
|
|
|
|
|
|
|
|
|
TPES |
|
1497.93 |
|
2879.95 |
|
–47.25 |
|
979.51 |
|
53.05 |
|
110.23 |
|
672.76 |
|
6.00 |
|
6152.18 |
|
|
|
|
|
|
|
|
|
|
|
|
|
|
|
|
|
|
|
|
|
|
|
|
|
Intl. Marine Bunkers |
|
|
|
– |
|
|
|
|
|
– |
|
– |
|
– |
|
|
|
|
|
|
|
– |
|
|
–118.76 |
|
– |
|
|
|
|
|
|
|
|
–118.76 |
|||||
|
|
Transfers |
|
– |
|
–43.43 |
|
|
|
|
|
– |
|
– |
|
|
|
|
– |
|
|
|
|
|
|
48.64 |
|
– |
|
|
|
– |
|
|
|
5.21 |
|||||||
|
|
Statistical Diff. |
|
|
|
|
|
–7.13 |
|
|
|
|
|
– |
|
|
|
|
|
|
|
|
|
–0.47 |
|
11.98 |
|
|
4.79 |
|
– |
|
|
– |
|
|
–0.11 |
|
9.06 |
||||
|
|
Electricity Plants |
|
–557.42 |
|
–22.65 |
|
|
|
|
|
–52.95 |
|
|
|
|
|
502.18 |
|
|
|
|
|
|
|
–317.90 |
|
–159.43 |
|
|
–110.23 |
|
–2.60 |
|
|
–720.99 |
|||||||
|
|
|
|
|
|
|
|
|
|
|
|
|
|
|
|
|
|
|
|
|
|
|
|
CHP Plants |
|
–87.77 |
|
– |
|
–28.39 |
|
–50.85 |
|
–0.10 |
|
– |
|
–0.89 |
|
100.76 |
|
–67.24 |
|
|
|
|
|
|
|
|
|
|
|
|
|
|
|
|
|
|
|
|
|
|
|
|
|
Heat Plants |
|
–9.22 |
|
– |
|
–0.91 |
|
|
|
– |
|
– |
|
–0.80 |
|
7.11 |
|
|
|
|
|
|
|
|
–0.69 |
|
|
|
|
|
|
|
–4.50 |
||||||||
|
|
Gas Works |
|
–8.96 |
|
–0.60 |
|
|
|
13.52 |
|
– |
|
– |
|
|
|
|
– |
|
–5.30 |
|
|
|
|
–9.27 |
|
|
|
|
– |
|
|
|
|||||||||
|
|
Pet. Refineries |
|
– |
|
–2800.49 |
|
|
|
– |
|
|
|
|
|
|
|
|
|
|
–27.85 |
|
|
|
|
2772.64 |
|
|
– |
|
– |
|
– |
|
|
– |
|
||||||
|
|
Coal Transf. |
|
|
|
1.48 |
|
|
|
–0.19 |
|
– |
|
|
|
–0.08 |
|
|
|
|
–171.42 |
|
|
–169.25 |
|
|
–3.38 |
|
|
|
– |
|
|
|
– |
|
|||||||
|
|
|
|
|
|
|
|
|
|
|
|
|
|
|
|
|
|
|
|
|
|
|
|
Liquefaction Plants |
|
–1.60 |
|
0.21 |
|
– |
|
– |
|
– |
|
– |
|
– |
|
|
– |
|
–1.39 |
|
|
Other Transf. |
|
|
|
3.95 |
|
–5.47 |
|
–0.03 |
|
|
|
– |
|
–10.96 |
|
|
|
|
–12.51 |
|
|
– |
|
|
|
|
– |
|
|
|
|
– |
|
||||||||
|
|
Own Use |
|
–34.13 |
|
|
|
|
|
–107.38 |
|
– |
|
– |
|
|
|
|
–57.73 |
|
–363.74 |
|
|
|
|
|
–161.80 |
|
|
–0.07 |
|
|
|||||||||||
|
|
|
–2.62 |
|
|
|
|
|
|
|
|
||||||||||
|
|
Distribution Losses |
|
|
|
–7.07 |
|
|
|
–7.50 |
|
– |
|
|
|
|
|
|
–42.59 |
|
–64.85 |
|
|
–7.41 |
|
|
–0.27 |
|
|
|
– |
|
– |
|
|
|
|||||||
|
|
|
|
|
|
|
|
|
|
|
|
|
|
|
|
|
|
|
|
|
|
|
|
|
|
|
|
|
|
|
|
|
|
|
|
|
|
|
|
|
|
|
|
|
|
TFC*** |
|
|
|
20.70 |
|
2120.73 |
|
671.76 |
|
– |
|
– |
|
657.38 |
|
515.62 |
|
4607.89 |
|
|
|
621.70 |
|
|
|
|
|
|
|
||||||||||||
|
|
|
|
|
|
|
|
|
|
|
|
|
|
|
|
|
|
|
|
|
|
|
|
Industry Sector |
|
357.51 |
|
|
|
556.08 |
|
380.77 |
|
– |
|
– |
|
– |
|
277.14 |
|
1651.52 |
|
|
|
|
|
16.38 |
|
|
|
|
|
|
|
|
|
||||||||
|
|
Transport Sector |
|
33.01 |
|
– |
|
905.12 |
|
|
|
|
|
– |
|
– |
|
|
|
|
|
|
|
|
|
|
17.72 |
|
– |
|
|
|
10.47 |
|
966.62 |
||||||||
|
|
|
|
|
|
|
|
|
|
|
|
|
|
|
|
|
|
|
|
|
|
|
|
Other Sectors |
|
225.93 |
|
– |
|
527.70 |
|
273.27 |
|
|
|
– |
|
– |
|
|
|
1410.75 |
|
|
|
|
|
|
|
|
– |
|
|
|
228.01 |
|
|||||||||
|
|
|
|
|
|
|
|
|
|
|
|
|
|
|
|
|
|
|
|
|
|
|
|
Non–Energy Use |
|
5.24 |
|
4.32 |
|
131.84 |
|
– |
|
– |
|
– |
|
– |
|
|
– |
|
141.40 |
|
|
|
|
|
|
|
|
|
|
|
|
|
|
|
|
|
|
|
|
|
|
|
* Combustible renewables & waste final consumption has been estimated based on TPES. |
|
** Other includes geothermal, solar, electricity and heat, wind, etc. *** Totals may not always |
|
|
36 |
add up due to a lack of breakdown of consumption for combustible renewables & waste. |
|
|
|
|

BALANCE TABLE
The World
2002
|
|
|
|
|
|
|
|
|
(Mtoe) |
SUPPLY AND |
Coal |
Crude |
Petroleum |
Gas |
Nuclear |
Hydro |
Combustible |
Other* |
Total |
CONSUMPTION |
|
Oil |
Products |
|
|
|
Renewables |
|
|
|
|
|
|
|
|
|
& Waste |
|
|
Indigenous Prod. |
2403.16 |
3647.38 |
- |
2169.03 |
693.84 |
223.67 |
1118.02 |
50.63 |
10305.74 |
Imports |
446.57 |
2071.89 |
740.38 |
583.55 |
– |
– |
1.19 |
44.96 |
3888.54 |
Exports |
–435.85 |
–1947.29 |
–812.63 |
–582.50 |
– |
– |
–1.50 |
–43.80 |
–3823.57 |
Stock Changes |
–12.13 |
–1.62 |
16.35 |
3.12 |
– |
– |
–0.01 |
– |
5.70 |
TPES |
2401.75 |
3770.36 |
–55.90 |
2173.21 |
693.84 |
223.67 |
1117.70 |
51.79 |
10376.42 |
Intl. Marine Bunkers |
– |
– |
–145.74 |
– |
– |
– |
– |
– |
–145.74 |
Transfers |
– |
–103.72 |
118.74 |
– |
– |
– |
– |
– |
15.01 |
Statistical Diff. |
–20.90 |
–13.82 |
8.43 |
–4.89 |
– |
– |
0.13 |
0.20 |
–30.85 |
Electricity Plants |
–1404.39 |
–27.79 |
–212.32 |
–446.71 |
–681.33 |
–223.67 |
–31.19 |
1189.10 |
–1838.30 |
CHP Plants |
–178.43 |
–0.56 |
–29.86 |
–257.72 |
–12.52 |
– |
–32.19 |
282.08 |
–229.20 |
Heat Plants |
–62.39 |
–1.12 |
–17.35 |
–86.42 |
– |
– |
–8.58 |
148.11 |
–27.75 |
Gas Works |
–11.15 |
– |
–4.21 |
8.37 |
– |
– |
– |
– |
–6.99 |
Pet. Refineries |
– |
–3641.94 |
3618.17 |
– |
– |
– |
–0.01 |
– |
–23.78 |
Coal Transf. |
–155.34 |
0.05 |
–2.72 |
–0.20 |
– |
– |
– |
– |
–158.22 |
Liquefaction Plants |
–17.54 |
11.25 |
0.44 |
–7.69 |
– |
– |
– |
– |
–13.54 |
Other Transf. |
0.01 |
29.96 |
–27.85 |
–3.75 |
– |
– |
–43.82 |
– |
–45.44 |
Own Use |
–44.74 |
–8.53 |
–206.87 |
–200.80 |
– |
– |
–2.33 |
–142.71 |
–605.97 |
Distribution Losses |
–1.72 |
–3.06 |
–0.13 |
–20.83 |
– |
– |
– |
–144.94 |
–170.68 |
TFC |
505.16 |
11.07 |
3042.85 |
1152.55 |
– |
– |
999.71 |
1383.62 |
7094.97 |
Industry Sector |
381.70 |
10.63 |
603.12 |
515.10 |
– |
– |
159.64 |
571.93 |
2242.13 |
Transport Sector |
5.47 |
0.01 |
1745.66 |
57.28 |
– |
– |
8.42 |
20.19 |
1837.03 |
Other Sectors |
106.47 |
0.43 |
504.19 |
580.17 |
– |
– |
831.65 |
791.51 |
2814.42 |
Non–Energy Use |
11.53 |
– |
189.87 |
– |
– |
– |
– |
– |
201.40 |
* Other includes geothermal, solar, electricity and heat, wind, etc.
4 |
37

E |
|
|
|
|
|
|
|
|
|
|
|
|
|
|
|
|
|
|
|
|
|
N |
|
|
|
|
|
|
|
SIMPLIFIED ENERGY |
|||||||||||||
E |
|
|
|
|
|
|
|
||||||||||||||
R |
|
|
|
|
|
|
|
||||||||||||||
G |
|
|
|
|
|
|
|
|
|
|
|
|
|
|
|
|
|
|
|
|
|
Y |
|
|
|
|
|
|
|
The OECD |
|
|
|
|
|
|
|
|
|||||
B |
|
|
|
|
|
|
|
|
1973 |
|
|
|
|
|
|
|
|
|
|
||
A |
|
|
|
|
|
|
|
|
|
|
|
|
|
|
|
|
(Mtoe) |
||||
|
|
|
|
|
|
|
|
|
|
|
|
|
|
|
|
|
|
|
|||
L |
|
|
|
|
|
|
|
|
|
|
|
|
|
|
|
|
|
|
|
||
|
|
|
|
|
|
|
|
|
|
|
|
|
|
|
|
|
|
|
|
|
|
|
|
SUPPLY AND |
|
|
Crude |
|
|
|
|
|
|
|
|
|
|
|
|
|
|
|
|
|
Coal |
|
|
Petroleum |
|
|
|
Nuclear |
|
Hydro |
|
Combustible |
|
|
Other* |
|
|
||||
A |
|
|
|
Gas |
|
|
|
|
|
|
|
Total |
|||||||||
N |
|
CONSUMPTION |
|
|
Oil |
|
Products |
|
|
|
|
|
|
|
Renewables |
|
|
|
|
|
|
|
|
|
|
|
|
|
|
|
|
|
|
|
|
|
|
|
|
|
|
|
|
|
|
|
|
|
|
|
|
|
|
|
|
|
|
|
& Waste |
|
|
|
|
|
|
C |
|
|
|
|
|
|
|
|
|
|
|
|
|
|
|
|
|
|
|
|
|
E |
|
Indigenous Prod. |
818,29 |
|
701.67 |
|
– |
|
705.65 |
|
49.22 |
|
78.46 |
|
85.96 |
|
6.13 |
|
2445.38 |
||
|
|
Imports |
|
|
1286.57 |
|
|
|
62.56 |
|
– |
|
– |
|
|
|
7.55 |
|
1815.85 |
||
S |
121.72 |
|
|
337.43 |
|
|
|
|
0.03 |
|
|
||||||||||
|
|
Exports |
–111.07 |
|
–63.46 |
|
|
|
–50.39 |
|
|
|
|
|
|
|
|
|
|
–405.78 |
|
|
|
|
–173.84 |
|
|
– |
|
– |
|
–0.01 |
|
|
–7.00 |
|
|||||||
|
|
|
|
|
|
|
|
|
|
|
|
|
|
|
|
|
|
|
|
|
|
|
|
Intl. Marine Bunkers |
– |
|
– |
|
–72.76 |
|
– |
|
– |
|
– |
|
– |
|
|
– |
|
–72.76 |
|
|
|
|
|
|
|
|
|
|
|
|
|
|
|
|
|
|
|
|
|
|
|
|
|
Stock Changes |
14.41 |
|
–11.04 |
|
–11.51 |
|
–11.98 |
|
– |
|
– |
|
0.06 |
|
|
– |
|
–20.07 |
|
|
|
|
|
|
|
|
|
|
|
|
|
|
|
|
|
|
|
|
|
|
|
|
|
|
|
|
|
|
|
|
|
|
|
|
|
|
|
|
|
|
|
|
|
|
|
TPES |
843.35 |
|
1913.74 |
|
79.32 |
|
705.83 |
|
49.22 |
|
78.46 |
|
86.03 |
|
6.67 |
|
3762.61 |
||
|
|
|
|
|
|
|
|
|
|
|
|
|
|
|
|
|
|
|
|
|
|
|
|
Transfers |
– |
|
–37.99 |
|
42.12 |
|
– |
|
– |
|
– |
|
– |
|
|
– |
|
4.13 |
|
|
|
Statistical Diff. |
|
|
|
|
2.28 |
|
|
|
|
|
– |
|
|
|
|
|
|
|
|
|
4.65 |
|
13.14 |
|
|
–5.62 |
|
– |
|
|
–0.00 |
|
|
– |
|
14.44 |
|||||
|
|
Electricity Plants |
–387.37 |
|
–20.67 |
|
|
|
|
|
–49.12 |
|
|
|
|
|
363.19 |
|
|
||
|
|
|
–223.37 |
|
–108.33 |
|
|
–78.46 |
|
–1.42 |
|
|
–505.54 |
||||||||
|
|
|
|
|
|
|
|
|
|
|
|
|
|
|
|
|
|
|
|
|
|
|
|
CHP Plants |
–53.52 |
|
– |
|
–7.93 |
|
–11.65 |
|
–0.10 |
|
– |
|
–0.75 |
|
30.94 |
|
–43.01 |
||
|
|
|
|
|
|
|
|
|
|
|
|
|
|
|
|
|
|
|
|
|
|
|
|
Heat Plants |
–9.22 |
|
– |
|
–0.91 |
|
|
|
– |
|
– |
|
–0.80 |
|
7.11 |
|
|
||
|
|
|
|
–0.69 |
|
|
|
|
|
|
|
|
–4.50 |
||||||||
|
|
Gas Works |
–7.49 |
|
–0.60 |
|
|
|
13.02 |
|
– |
|
– |
|
|
|
|
– |
|
–3.88 |
|
|
|
|
–8.81 |
|
|
|
|
– |
|
|
|
||||||||||
|
|
Pet. Refineries |
– |
|
–1871.64 |
|
|
|
– |
|
|
|
|
|
|
|
|
|
|
–7.58 |
|
|
|
|
1864.06 |
|
|
– |
|
– |
|
– |
|
|
– |
|
|||||||
|
|
Coal Transf. |
|
|
1.48 |
|
|
|
–0.19 |
|
– |
|
|
|
–0.02 |
|
|
|
|
–78.52 |
|
|
–76.41 |
|
|
–3.38 |
|
|
|
– |
|
|
|
– |
|
||||||||
|
|
|
|
|
|
|
|
|
|
|
|
|
|
|
|
|
|
|
|
|
|
|
|
Liquefaction Plants |
–0.87 |
|
– |
|
– |
|
– |
|
– |
|
– |
|
– |
|
|
– |
|
–0.87 |
|
|
|
Other Transf. |
|
|
3.74 |
|
–5.27 |
|
–0.03 |
|
|
|
– |
|
– |
|
|
|
|
–1.55 |
|
|
– |
|
|
|
|
– |
|
|
|
|
– |
|
|||||||||
|
|
Own Use |
–23.64 |
|
|
|
|
|
–72.86 |
|
– |
|
– |
|
|
|
|
–33.37 |
|
–258.31 |
|
|
|
|
|
–127.38 |
|
|
–0.07 |
|
|||||||||||||
|
|
–1.00 |
|
|
|
|
|
|
|
|
|||||||||||
|
|
Distribution Losses |
|
|
– |
|
|
|
–3.95 |
|
– |
|
|
|
|
|
|
–30.33 |
|
–36.83 |
|
|
–2.32 |
|
|
–0.24 |
|
|
|
– |
|
– |
|
|
|
||||||||
|
|
|
|
|
|
|
|
|
|
|
|
|
|
|
|
|
|
|
|
|
|
|
|
|
|
|
|
|
|
|
|
|
|
|
|
|
|
|
|
|
|
|
|
|
|
TFC |
|
|
0.21 |
|
1610.48 |
|
515.54 |
|
– |
|
– |
|
82.99 |
|
344.21 |
|
2840.57 |
||
|
287.16 |
|
|
|
|
|
|
|
|||||||||||||
|
|
|
|
|
|
|
|
|
|
|
|
|
|
|
|
|
|
|
|
|
|
|
|
Industry Sector |
179.92 |
|
|
|
426.97 |
|
259.26 |
|
– |
|
– |
|
42.01 |
|
168.80 |
|
1077.17 |
||
|
|
|
0.21 |
|
|
|
|
|
|
|
|
|
|||||||||
|
|
Transport Sector |
7.23 |
|
– |
|
691.14 |
|
|
|
|
|
– |
|
0.00 |
|
|
|
|
|
|
|
|
|
|
17.00 |
|
– |
|
|
|
5.29 |
|
720.65 |
|||||||||
|
|
|
|
|
|
|
|
|
|
|
|
|
|
|
|
|
|
|
|
|
|
|
|
Other Sectors |
96.91 |
|
– |
|
396.27 |
|
239.28 |
|
|
|
– |
|
40.97 |
|
|
|
|
943.56 |
|
|
|
|
|
|
|
– |
|
|
|
170.13 |
|
||||||||||
|
|
|
|
|
|
|
|
|
|
|
|
|
|
|
|
|
|
|
|
|
|
|
|
Non–Energy Use |
3.10 |
|
– |
|
96.11 |
|
– |
|
– |
|
– |
|
– |
|
|
– |
|
99.20 |
|
|
|
|
|
|
|
|
|
|
|
|
|
|
|
|
|
|
|
|
|
|
|
*Includes geothermal, solar, electricity and heat, wind, etc.
38