

Producers of Hydro Electricity
1 |
|
|
% of |
|
|
|
|
|
|
|
|
TWh |
World |
|
|
|
|
|
|
|
|
|
total |
|
|
|
|
|
|
|
|
|
|
Installed |
GW |
|
|
% of |
||
|
|
|
|
|
|
||||
|
350 |
13.1 |
|
Capacity |
|
Country |
hydro |
||
|
|
|
|
||||||
Rep. of China |
288 |
10.8 |
|
(based on production) |
|
|
(based on first |
in total |
|
|
|
|
domestic |
||||||
|
|
|
|
|
|
|
|
10 producers) |
|
|
285 |
10.7 |
|
United States |
98 |
|
electricity |
||
|
|
|
|
||||||
States |
258 |
9.6 |
|
Canada |
|
67 |
|
|
generation |
|
|
|
|
|
|||||
|
164 |
6.1 |
|
Brazil |
|
63 |
|
Norway |
99.3 |
|
130 |
4.9 |
|
People’s Rep. of China |
57 |
|
Brazil |
82.7 |
|
|
92 |
3.4 |
|
Japan |
|
45 |
|
Canada |
58.3 |
|
67 |
2.5 |
|
Russia |
|
44 |
|
Sweden |
45.6 |
|
66 |
2.5 |
|
Norway |
30 |
|
Russia |
18.4 |
|
|
64 |
2.4 |
|
India |
|
26 |
|
People’s Rep. of China |
17.6 |
|
|
|
|
France |
|
25 |
|
France |
11.8 |
the World |
912 |
34.0 |
|
|
|
||||
|
|
|
|
Italy |
|
22 |
|
India |
10.7 |
|
2 676 |
100.0 |
|
||||||
|
|
|
|
|
|
Japan |
8.4 |
||
|
|
|
|
Rest of the World |
289 |
|
|||
data |
|
|
|
|
|||||
|
|
|
|
United States |
6.4 |
||||
|
|
|
|
|
|
|
|||
|
|
|
World |
|
766 |
|
|||
|
|
|
|
|
|
|
|
||
|
|
|
|
Rest of the World* |
15.9 |
||||
|
|
|
|
|
|
|
|
||
|
|
|
|
2001 data |
|
|
|||
|
|
|
|
|
|
|
|
||
|
|
|
|
|
World |
16.6 |
|||
|
|
|
|
Sources: United Nations, |
|||||
|
|
|
|
|
|
||||
with hydro production only. |
IEA. |
|
|
2002 data |
|
||||
|
|
|
|
||||||
19
T |
|
|
|
|
|
|
|
|
|
|
|
|
|
|
|
|
|
|
|
|
|
|
|
|
|
|
|
|
R |
|
|
|
|
|
|
|
|
|
Refining by Product |
|
|
|
|
|
|||||||||||||
A |
|
|
|
|
|
|
|
|
|
|
|
|
|
|
||||||||||||||
N |
|
|
|
|
|
|
|
|
|
|
|
|
|
|
|
|
|
|
|
|
|
|
|
|
|
|
|
|
|
|
|
|
|
|
|
|
|
|
|
|
|
|
|
|
|
|
|
|
|
|
|
|
|
|
|
|
|
|
|
|
|
|
|
|
|
|
|
|
|
|
|
|
|
|
|
|
|
|
|
|
|
|
|
|
|
|
S |
|
|
|
|
|
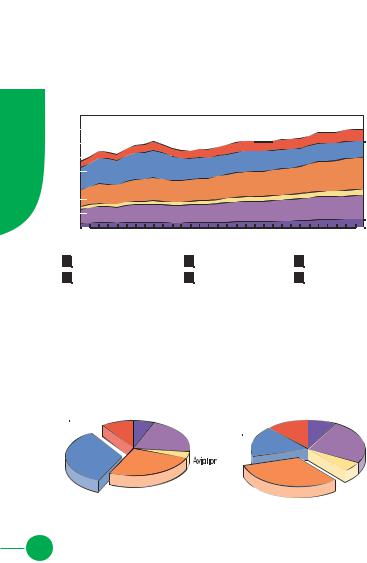
Evolution from 1971 to 2002 of World Refinery Production |
|
|
||||||||||||||||||||
F |
|
|
|
|
|
|
|
|||||||||||||||||||||
O |
|
|
|
|
|
|
|
|
|
|
|
|
|
by Product (Mt) |
|
|
|
|
|
|
|
|
|
|
||||
|
|
|
|
|
|
|
|
|
|
|
|
|
|
|
|
|
|
|
|
|
|
|
|
|
|
|
|
|
|
|
4000 |
|
|
|
|
|
|
|
|
|
|
|
|
|
|
|
|
|
|
|
|
|
|
||||
R |
|
|
|
|
|
|
|
|
|
|
|
|
|
|
|
|
|
|
|
|
|
|
|
|
||||
|
|
3500 |
|
|
|
|
|
|
|
|
|
|
|
|
|
|
|
|
|
|
|
|
|
|
||||
M |
|
|
|
|
|
|
|
|
|
|
|
|
|
|
|
|
|
|
|
|
|
|
|
|
||||
|
|
|
|
|
|
|
|
|
|
|
|
|
|
|
|
|
|
|
|
|
|
|
|
|||||
|
|
|
|
|
|
|
|
|
|
|
|
|
|
|
|
|
|
|
|
|
|
|
|
|
|
|
|
|
A |
|
|
3000 |
|
|
|
|
|
|
|
|
|
|
|
|
|
|
|
|
|
|
|
|
|
|
|||
|
|
|
|
|
|
|
|
|
|
|
|
|
|
|
|
|
|
|
|
|
|
|
|
|||||
T |
|
|
2500 |
|
|
|
|
|
|
|
|
|
|
|
|
|
|
|
|
|
|
|
|
|
|
|||
|
|
|
|
|
|
|
|
|
|
|
|
|
|
|
|
|
|
|
|
|
|
|
|
|||||
I |
|
|
2000 |
|
|
|
|
|
|
|
|
|
|
|
|
|
|
|
|
|
|
|
|
|
|
|||
|
|
|
|
|
|
|
|
|
|
|
|
|
|
|
|
|
|
|
|
|
|
|
|
|||||
O |
|
|
1500 |
|
|
|
|
|
|
|
|
|
|
|
|
|
|
|
|
|
|
|
|
|
|
|||
|
|
|
|
|
|
|
|
|
|
|
|
|
|
|
|
|
|
|
|
|
|
|
|
|||||
N |
|
|
1000 |
|
|
|
|
|
|
|
|
|
|
|
|
|
|
|
|
|
|
|
|
|
|
|||
|
|
|
|
|
|
|
|
|
|
|
|
|
|
|
|
|
|
|
|
|
|
|
|
|||||
|
|
|
500 |
|
|
|
|
|
|
|
|
|
|
|
|
|
|
|
|
|
|
|
|
|
|
|||
|
|
|
|
|
|
|
|
|
|
|
|
|
|
|
|
|
|
|
|
|
|
|
|
|
||||
|
|
|
0 |
1972 |
1974 1976 |
1978 |
1980 |
1982 |
1984 |
1986 1988 |
1990 |
1992 |
1994 1996 |
1998 |
2000 |
2002 |
|
|||||||||||
|
|
|
|
|
|
|
|
|||||||||||||||||||||
|
|
|
|
|
|
LPG/Ethane/Naphtha |
|
|
Motor Gasoline |
|
|
|
|
Aviation Fuels |
||||||||||||||
|
|
|
|
|
|
|
|
|
|
|
|
|||||||||||||||||
|
|
|
|
|
|
|
|
|
|
|
|
|||||||||||||||||
|
|
|
|
|
|
Middle Distillates |
|
|
|
Heavy Fuel Oil |
|
|
|
|
Other Products |
|||||||||||||
|
|
|
|
|
|
|
|
|
|
|
|
|
||||||||||||||||
|
|
|
|
|
|
|
|
|
|
|
|
|
||||||||||||||||
|
|
|
|
|
|
|
|
|
|
|
|
|
|
|
|
|
|
|
|
|
|
|||||||
|
|
|
|
|
|
|
|
|
|
1973 and 2002 Shares of |
|
|
|
|
|
|||||||||||||
|
|
|
|
|
|
|
|
|
Refinery Production by Product |
|
|
|
|
|||||||||||||||
|
|
|
|
|
|
|
|
|
|
|
|
|
|
|
|
|
|
|
|
|
|
|
||||||
|
|
|
|
|
|
|
|
|
1973 |
|
|
|
|
|
|
|
|
2002 |
|
|
|
|
||||||
|
|
|
|
|
|
|
|
|
|
|
|
|
|
|
|
|
|
|
|
|||||||||
|
|
|
|
|
|
|
|
Other |
LPG/Ethane/ |
|
|
|
|
|
|
Other |
LPG/Ethane/ |
|
|
|||||||||
|
|
|
|
|
|
|
|
Products |
|
Naphtha |
Motor |
|
|
Products |
|
Naphtha |
|
|
Motor |
|||||||||
|
|
Heavy Fuel |
9.2% |
|
|
5.8% |
|
Gasoline |
|
|
12.2% |
8.1% |
|
Gasoline |
||||||||||||||
|
|
|
|
Oil |
|
|
|
|
|
|
|
21.0% |
Heavy Fuel |
|
|
|
|
|
|
|
|
24.7% |
||||||
|
|
33.8% |
|
|
|
|
|
|
|
|
|
|
Oil |
|
|
|
|
|
|
|
|
|
|
|
||||
|
|
|
|
|
|
|
|
|
|
|
|
|
|
|
|
|
17.0% |
|
|
|
|
|
|
|
|
|
|
|
|
|
|
|
|
|
|
|
|
|
|
|
|
|
|
|
Fuels |
|
|
|
|
|
|
|
|
|
|
|
|
|
|
|
|
|
|
|
|
|
|
|
|
|
|
|
|
4.2% |
|
|
|
|
|
|
|
|
|
Aviation |
||
|
|
|
|
|
|
|
|
|
|
Middle Distillates 26.0% |
|
|
|
|
|
|
|
|
|
|
|
Fuels |
||||||
|
|
|
|
|
|
|
|
|
|
|
|
|
|
|
|
|
|
Middle Distillates 32.0% |
|
|
6.0% |
|||||||
|
|
|
|
|
|
|
|
|
|
|
|
|
|
|
|
|
|
|
|
|
|
|
||||||
|
|
|
|
|
|
|
|
|
|
|
|
|
|
|
|
|
|
|
|
|
|
|
|
|
|
|
|
|
|
|
|
|
|
|
|
|
|
2 719 Mt |
|
|
|
|
|
|
|
|
3 517 Mt |
|
|
|
|
||||||
20

Producers, Exporters and Importers
of Petroleum Products
|
|
% of |
Producers |
Mt |
World |
|
|
total |
United States |
816 |
23.2 |
People’s Rep. of China |
207 |
5.9 |
Japan |
203 |
5.8 |
Russia |
184 |
5.2 |
Germany |
114 |
3.2 |
India |
112 |
3.2 |
Korea |
111 |
3.2 |
Canada |
99 |
2.8 |
Italy |
96 |
2.7 |
Brazil |
85 |
2.4 |
|
|
|
Rest of the World |
1 490 |
42.4 |
|
|
|
World |
3 517 |
100.0 |
|
|
|
2002 data |
|
|
2 |
Exporters |
Mt |
Russia |
67 |
Netherlands |
65 |
United States |
50 |
Singapore |
44 |
Saudi Arabia |
39 |
Venezuela |
33 |
Kuwait |
31 |
Korea |
31 |
United Kingdom |
23 |
Italy |
21 |
|
|
Rest of the World |
392 |
|
|
World |
796 |
|
|
2002 data |
|
Importers |
Mt |
United States |
75 |
Netherlands |
51 |
Japan |
49 |
Singapore |
45 |
Germany |
36 |
France |
32 |
People’s Rep. of China |
27 |
Korea |
26 |
Spain |
23 |
Italy |
18 |
|
|
Rest of the World |
340 |
|
|
World |
722 |
|
|
2002 data |
|
21

T |
|
|
|
|
|
|
R |
|
|
|
Refining by Region |
||
A |
|
|
|
|||
N |
|
|
|
|
|
|
|
|
|
|
|
|
|
|
|
|
|
|
|
|
S |
|
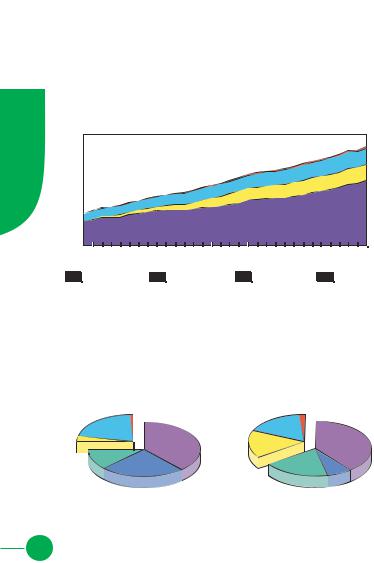
Evolution from 1971 to 2002 of World Refinery Throughput |
||||
F |
|
|||||
O |
|
|
|
|
by Region (Mt) |
|
4000 |
|
|
|
|
||
R |
|
|
|
|
||
3500 |
|
|
|
|
||
M |
|
|
|
|
||
|
|
|
|
|||
A |
3000 |
|
|
|
|
|
|
|
|
|
|||
T |
2500 |
|
|
|
|
|
|
|
|
|
|||
I |
2000 |
|
|
|
|
|
|
|
|
|
|||
O |
1500 |
|
|
|
|
|
|
|
|
|
|||
N1000
500
0 


 1972 1974 1976 1978 1980 1982 1984 1986 1988 1990 1992 1994 1996 1998 2000 2002
|
OECD |
|
Middle East |
|
Former USSR |
|
Non-OECD Europe |
|
|
|
|
||||
|
China |
|
Asia* |
|
Latin America |
|
Africa |
|
|
|
|
||||
|
|
|
|
1973 and 2002 Regional Shares of
Refinery Throughput
|
|
1973 |
|
|
|
|
2002 |
|
|
Non- |
|
|
|
Non- |
|
|
|
||
China Asia* |
|
|
|
|
|
|
|
||
OECD |
Latin America |
Former Europe |
China |
Asia* |
|||||
Former Europe |
3.3% |
9.0% |
USSR |
6.0% |
9.7% Latin America |
||||
USSR 1.5% |
|
|
Africa |
|
6.6% |
||||
12.4% |
|
|
1.7% |
7.3% |
|
|
|||
|
|
|
|
|
|
Africa |
|||
Middle |
|
|
|
Middle |
|
3.7% |
|||
East |
|
|
|
East |
|
|
|
||
4.0% |
|
|
|
|
8.0% |
|
|
|
|
|
|
|
|
OECD |
|
|
|
|
OECD |
|
|
|
66.6% |
|
|
|
57.9% |
||
|
|
|
|
|
|
|
|
|
|
|
|
2 739 Mt |
|
|
|
3 583 Mt |
|
||
*Asia excludes China.
22

Refinery Capacity, Net Exporters and
Net Importers of Oil*
Crude |
|
% of |
Distillation |
kb/cd |
Wo |
Capacity |
|
total |
United States |
16 757 |
20.1 |
Former USSR |
8 512 |
10.2 |
People’s Rep. of China** |
5 731 |
6.9 |
Japan |
4 767 |
5.7 |
Korea |
2 560 |
3.1 |
Germany |
2 345 |
2.8 |
Italy |
2 301 |
2.8 |
Canada |
1 983 |
2.4 |
France |
1 903 |
2.3 |
United Kingdom |
1 789 |
2.1 |
|
|
|
Rest of the World |
34 882 |
41.7 |
|
|
|
World |
83 530 |
100.0 |
|
|
|
2003 data |
|
|
Net Exporters |
Mt |
Saudi Arabia |
327 |
Russia |
250 |
Norway |
148 |
Venezuela |
143 |
Islamic Rep. of Iran |
109 |
United Arab Emirates |
89 |
Nigeria |
88 |
Mexico |
86 |
Kuwait |
81 |
Iraq |
75 |
|
|
Rest of the World |
556 |
|
|
2002 data |
|
*Crude oil and petroleum products. **Does not include unlisted small teapot refineries
which are estimated at between 200 and 500 kb/cd.
2 |
Net Importers |
Mt |
United States |
536 |
Japan |
252 |
Germany |
121 |
Korea |
104 |
France |
93 |
Italy |
87 |
India |
79 |
People’s Rep. of China |
76 |
Spain |
74 |
Chinese Taipei |
43 |
|
|
Rest of the World |
532 |
|
|
2002 data |
|
23
T |
|
|
|
|
|
|
|
|
|
|
|
|
|
|
|
|
|
|
|
|
|
|
|
|
|
|
|
|
R |
|
|
|
|
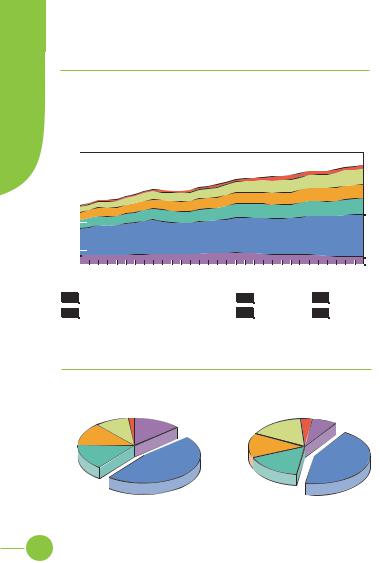
Electricity Generation* by Fuel |
|
|
|||||||||||||||||||||
A |
|
|
|
|
|
|
||||||||||||||||||||||
N |
|
|
|
|
|
|
|
|
|
|
|
|
|
|
|
|
|
|
|
|
|
|
|
|
|
|
|
|
|
|
|
|
|
|
|
|
|
|
|
|
|
|
|
|
|
|
|
|
|
|
|
|
|
|
|
|
|
|
|
|
|
|
|
|
|
|
|
|
|
|
|
|
|
|
|
|
|
|
|
|
|
|
|
|
|
|
S |
|
|
|
|
|
|
|
|
|
|
|
|
|
|
|
|
|
|
|
|
|
|
|
|
|
|
|
|
F |
|
|
|
|
Evolution from 1971 to 2002 of World Electricity Generation* |
|||||||||||||||||||||||
O |
|
|
|
|
||||||||||||||||||||||||
R |
|
|
|
|
|
|
|
|
|
|
|
|
|
|
|
by Fuel (TWh) |
|
|
|
|
|
|
|
|
|
|
||
M |
|
|
18000 |
|
|
|
|
|
|
|
|
|
|
|
|
|
|
|
|
|
|
|
|
|
|
|
||
A |
|
|
16000 |
|
|
|
|
|
|
|
|
|
|
|
|
|
|
|
|
|
|
|
|
|
|
|
||
|
|
|
|
|
|
|
|
|
|
|
|
|
|
|
|
|
|
|
|
|
|
|
|
|||||
T |
|
|
14000 |
|
|
|
|
|
|
|
|
|
|
|
|
|
|
|
|
|
|
|
|
|
|
|
||
|
|
|
|
|
|
|
|
|
|
|
|
|
|
|
|
|
|
|
|
|
|
|
|
|||||
I |
|
|
12000 |
|
|
|
|
|
|
|
|
|
|
|
|
|
|
|
|
|
|
|
|
|
|
|
||
|
|
|
|
|
|
|
|
|
|
|
|
|
|
|
|
|
|
|
|
|
|
|
|
|||||
O |
|
|
10000 |
|
|
|
|
|
|
|
|
|
|
|
|
|
|
|
|
|
|
|
|
|
|
|
||
|
|
|
|
|
|
|
|
|
|
|
|
|
|
|
|
|
|
|
|
|
|
|
|
|||||
N |
|
|
8000 |
|
|
|
|
|
|
|
|
|
|
|
|
|
|
|
|
|
|
|
|
|
|
|
||
|
|
|
|
|
|
|
|
|
|
|
|
|
|
|
|
|
|
|
|
|
|
|
|
|||||
|
|
|
6000 |
|
|
|
|
|
|
|
|
|
|
|
|
|
|
|
|
|
|
|
|
|
|
|
||
|
|
|
|
|
|
|
|
|
|
|
|
|
|
|
|
|
|
|
|
|
|
|
|
|
||||
|
|
|
4000 |
|
|
|
|
|
|
|
|
|
|
|
|
|
|
|
|
|
|
|
|
|
|
|
||
|
|
|
|
|
|
|
|
|
|
|
|
|
|
|
|
|
|
|
|
|
|
|
|
|
||||
|
|
|
2000 |
|
|
|
|
|
|
|
|
|
|
|
|
|
|
|
|
|
|
|
|
|
|
|
||
|
|
|
|
|
|
|
|
|
|
|
|
|
|
|
|
|
|
|
|
|
|
|
|
|
||||
|
|
|
0 |
|
|
|
1974 1976 |
1978 1980 |
1982 1984 |
1986 1988 |
1990 1992 |
1994 1996 |
1998 2000 |
2002 |
||||||||||||||
|
|
|
1972 |
|||||||||||||||||||||||||
|
|
|
|
|
|
|
Thermal |
|
|
|
|
Nuclear |
|
|
Hydro |
|
|
|
|
Other** |
||||||||
|
|
|
|
|
|
|
|
|
|
|
|
|
|
|
|
|||||||||||||
|
|
|
|
|
|
|
|
|
|
|
|
|
|
|
|
|||||||||||||
|
|
|
|
|
|
|
|
|
|
|
|
|
|
|
|
|
|
|
|
|||||||||
|
|
|
|
|
|
|
|
|
1973 and 2002 Fuel Shares of |
|
|
|
|
|||||||||||||||
|
|
|
|
|
|
|
|
|
|
Electricity Generation* |
|
|
|
|
|
|||||||||||||
|
|
|
|
|
|
|
|
|
|
|
|
|
|
|
|
|
|
|
|
|
|
|
|
|
||||
|
|
|
|
|
|
|
|
|
|
|
|
|
|
|
|
|
|
|
|
|
|
|
|
|
||||
|
|
|
|
|
|
|
|
|
|
1973 |
|
|
|
|
|
|
|
|
2002 |
|
|
|
|
|
||||
|
|
|
|
|
|
|
|
Hydro |
Other** |
|
|
|
|
|
Hydro |
|
Other** |
|
|
|
|
|||||||
|
|
21.0% |
|
0.6% |
|
|
Coal |
|
|
16.2% |
1.9% |
|
|
Coal |
||||||||||||||
|
|
|
Nuclear |
|
|
|
|
|
|
|
38.2% |
|
|
|
|
|
|
|
|
39.0% |
||||||||
|
|
3.4% |
|
|
|
|
|
|
|
|
|
|
|
|
|
|
|
|
|
|
|
|
|
|
|
|||
|
|
|
|
|
Gas |
|
|
|
|
|
|
|
|
Nuclear |
|
|
|
|
|
|
|
|
|
|
||||
|
|
12.1% |
|
|
|
|
|
|
|
|
|
16.6% |
|
|
|
|
|
|
|
|
|
|
||||||
|
|
|
|
|
|
|
|
|
|
Oil 24.7% |
|
|
|
|
|
|
Gas 19.1% |
|
Oil 7.2% |
|||||||||
|
|
|
|
|
|
|
|
|
|
|
|
|
|
|
|
|
|
|
|
|||||||||
|
|
|
|
|
|
|
|
|
|
|
|
|
|
|
|
|
|
|
|
|
|
|
|
|
|
|
|
|
|
|
|
|
|
|
|
|
|
6 111 TWh |
|
|
|
|
|
|
16 054 TWh |
|
|
|
|||||||||
*Excludes pumped storage.
**Other includes geothermal, solar, wind, combustible renewables & waste.
24

Electricity Production
from Fossil Fuels
Coal |
TWh |
United States |
2 047 |
People’s Rep. of China |
1 271 |
India |
418 |
Germany |
292 |
Japan |
291 |
South Africa |
203 |
Australia |
174 |
Russia |
170 |
Poland |
135 |
Korea |
131 |
|
|
Rest of the World |
1 132 |
|
|
World |
6 264 |
|
|
2002 data |
|
2 |
Oil |
TWh |
Japan |
145 |
United States |
99 |
Saudi Arabia |
96 |
Italy |
88 |
Mexico |
79 |
People’s Rep. of China |
49 |
Korea |
31 |
Iraq |
31 |
Kuwait |
29 |
Spain |
29 |
|
|
Rest of the World |
485 |
|
|
World |
1 161 |
|
|
2002 data |
|
Gas |
TWh |
United States |
712 |
Russia |
385 |
Japan |
245 |
United Kingdom |
152 |
Islamic Rep. of Iran |
108 |
Italy |
99 |
Thailand |
79 |
Mexico |
69 |
Egypt |
65 |
India |
63 |
|
|
Rest of the World |
1 088 |
|
|
World |
3 065 |
|
|
2002 data |
|
25

T |
|
|
|
|
|
|
|
|
|
|
|
|
|
|
|
|
|
|
|
|
|
|
|
|
|
|
|
|
|
R |
|
|
|
|
Electricity Generation* by Region |
||||||||||||||||||||||||
A |
|
|
|
|
|||||||||||||||||||||||||
N |
|
|
|
|
|
|
|
|
|
|
|
|
|
|
|
|
|
|
|
|
|
|
|
|
|
|
|
|
|
|
|
|
|
|
|
|
|
|
|
|
|
|
|
|
|
|
|
|
|
|
|
|
|
|
|
|
|
|
|
|
|
|
|
|
|
|
|
|
|
|
|
|
|
|
|
|
|
|
|
|
|
|
|
|
|
|
|
|
|
S |
|
|
|
|
|
|
|
|
|
|
|
|
|
|
|
|
|
|
|
|
|
|
|
|
|
|
|
|
|
F |
|
|
|
Evolution from 1971 to 2002 of World Electricity Generation* |
|||||||||||||||||||||||||
O |
|
|
|
||||||||||||||||||||||||||
R |
|
|
|
|
|
|
|
|
|
|
|
|
|
|
|
by Region (TWh) |
|
|
|
|
|
|
|
|
|
||||
M |
|
18000 |
|
|
|
|
|
|
|
|
|
|
|
|
|
|
|
|
|
|
|
|
|
|
|
|
|||
A |
|
16000 |
|
|
|
|
|
|
|
|
|
|
|
|
|
|
|
|
|
|
|
|
|
|
|
|
|||
|
|
|
|
|
|
|
|
|
|
|
|
|
|
|
|
|
|
|
|
|
|
|
|
|
|||||
T |
|
14000 |
|
|
|
|
|
|
|
|
|
|
|
|
|
|
|
|
|
|
|
|
|
|
|
|
|||
|
|
|
|
|
|
|
|
|
|
|
|
|
|
|
|
|
|
|
|
|
|
|
|
|
|||||
I |
|
12000 |
|
|
|
|
|
|
|
|
|
|
|
|
|
|
|
|
|
|
|
|
|
|
|
|
|||
|
|
|
|
|
|
|
|
|
|
|
|
|
|
|
|
|
|
|
|
|
|
|
|
|
|||||
O |
|
10000 |
|
|
|
|
|
|
|
|
|
|
|
|
|
|
|
|
|
|
|
|
|
|
|
|
|||
|
|
|
|
|
|
|
|
|
|
|
|
|
|
|
|
|
|
|
|
|
|
|
|
|
|||||
|
8000 |
|
|
|
|
|
|
|
|
|
|
|
|
|
|
|
|
|
|
|
|
|
|
|
|
||||
N |
|
|
|
|
|
|
|
|
|
|
|
|
|
|
|
|
|
|
|
|
|
|
|
|
|
||||
|
|
|
|
|
|
|
|
|
|
|
|
|
|
|
|
|
|
|
|
|
|
|
|
|
|||||
|
6000 |
|
|
|
|
|
|
|
|
|
|
|
|
|
|
|
|
|
|
|
|
|
|
|
|
||||
|
|
|
|
|
|
|
|
|
|
|
|
|
|
|
|
|
|
|
|
|
|
|
|
|
|
||||
|
|
4000 |
|
|
|
|
|
|
|
|
|
|
|
|
|
|
|
|
|
|
|
|
|
|
|
|
|||
|
|
|
|
|
|
|
|
|
|
|
|
|
|
|
|
|
|
|
|
|
|
|
|
|
|
||||
|
|
2000 |
|
|
|
|
|
|
|
|
|
|
|
|
|
|
|
|
|
|
|
|
|
|
|
|
|||
|
|
|
|
|
|
|
|
|
|
|
|
|
|
|
|
|
|
|
|
|
|
|
|
|
|
||||
|
|
0 |
1972 |
1974 1976 |
1978 |
1980 |
1982 |
1984 |
1986 1988 |
1990 |
1992 |
1994 1996 |
1998 |
2000 |
2002 |
||||||||||||||
|
|
|
|
|
|
||||||||||||||||||||||||
|
|
|
|
|
OECD |
|
|
|
|
Middle East |
|
|
Former USSR |
|
|
Non-OECD Europe |
|||||||||||||
|
|
|
|
|
|
|
|
|
|
|
|
|
|||||||||||||||||
|
|
|
|
|
|
|
|
|
|
|
|
|
|||||||||||||||||
|
|
|
|
|
China |
|
|
|
|
Asia** |
|
|
|
Latin America |
|
|
Africa |
|
|
|
|||||||||
|
|
|
|
|
|
|
|
|
|
|
|
|
|
|
|
|
|||||||||||||
|
|
|
|
|
|
|
|
|
|
|
|
|
|
|
|
|
|||||||||||||
|
|
|
|
|
|
|
|
|
|
|
|
|
|
|
|
|
|
|
|||||||||||
|
|
|
|
|
|
|
1973 and 2002 Regional Shares of |
|
|
|
|||||||||||||||||||
|
|
|
|
|
|
|
|
|
|
|
Electricity Generation* |
|
|
|
|
||||||||||||||
|
|
|
|
|
|
|
|
|
|
|
|
|
|
|
|
|
|
|
|
|
|
|
|
||||||
|
|
|
|
|
|
|
|
|
1973 |
|
|
|
|
|
|
|
|
|
2002 |
|
|
|
|
||||||
|
|
|
|
|
|
|
|
Non- |
|
|
|
Asia** |
|
|
|
|
Non- |
|
|
|
|
|
|
|
|
|
|||
|
|
|
Former |
|
OECD |
|
|
|
Latin |
|
|
|
|
|
|
|
|
Latin |
|
|
|||||||||
|
|
|
|
|
|
|
|
|
OECD |
|
|
|
Asia** |
|
|
||||||||||||||
|
|
|
|
Europe |
2.8% 2.5% |
|
|
|
|
|
|
|
|
|
|
|
|||||||||||||
|
|
|
USSR |
|
|
America |
|
1.1% |
|
China 8.5% |
America |
|
|
||||||||||||||||
|
15.0% |
1.7% |
|
|
|
|
|
|
2.7% |
|
|
|
|
|
|
|
|
Africa |
|||||||||||
|
|
Middle |
|
|
|
|
|
|
|
|
|
|
Africa 1.8% |
USSR |
|
|
|
|
|
|
|
3.0% |
|
||||||
|
|
|
|
|
|
|
|
|
|
|
|
|
|
|
|
|
|
|
|
|
|
|
|
|
|||||
|
|
East |
|
|
|
|
|
|
|
|
|
|
|
|
|
|
|
|
|
|
|
|
|
|
|
||||
|
|
|
|
|
|
|
|
|
|
|
|
|
|
|
8.1% |
|
|
|
|
|
|
|
|
|
|
||||
|
0.6% |
|
|
|
|
|
|
|
|
|
|
|
|
|
|
|
|
|
|
|
|
|
|
|
|
||||
|
|
|
|
|
|
|
|
|
|
|
|
|
|
|
Middle |
|
|
|
|
|
|
|
|
|
|||||
|
|
|
|
|
|
|
|
|
|
|
|
|
|
|
|
|
|
|
|
|
|
|
|
|
|
|
|
||
|
|
|
|
|
|
|
|
|
|
|
|
|
|
|
|
|
|
|
East |
|
|
|
|
|
|
|
|
|
|
|
|
|
|
|
|
|
|
|
|
|
|
|
|
|
|
OECD |
3.2% |
|
|
|
|
|
|
|
|
OECD |
|||
|
|
|
|
|
|
|
|
|
|
|
|
|
|
|
|
|
|
|
|
|
|
|
|
|
|||||
|
|
|
|
|
|
|
|
|
|
|
|
|
|
|
|
72.9% |
|
|
|
|
|
|
|
|
|
|
60.8% |
||
|
|
|
|
|
|
|
|
|
6 111 TWh |
|
|
|
|
|
|
|
16 054 TWh |
|
|
|
|||||||||
26 |
* Excludes pumped storage. |
**Asia excludes China. |
|
|
Producers, Exporters and Importers
of Electricity
|
|
% of |
Producers* |
TWh |
World |
|
|
total |
United States |
3 993 |
24.9 |
People’s Rep. of China |
1 640 |
10.2 |
Japan |
1 088 |
6.8 |
Russia |
889 |
5.5 |
Canada |
601 |
3.7 |
India |
597 |
3.7 |
Germany |
567 |
3.5 |
France |
555 |
3.5 |
United Kingdom |
384 |
2.4 |
Brazil |
345 |
2.1 |
|
|
|
Rest of the World |
5 395 |
33.7 |
|
|
|
World |
16 054 |
100.0 |
|
|
|
2002 data |
|
|
Exporters** |
TWh |
France |
80 |
Paraguay |
42 |
Germany |
38 |
Canada |
36 |
Switzerland |
32 |
Czech Republic |
21 |
Russia |
18 |
Norway |
15 |
Sweden |
15 |
Austria |
15 |
|
|
Rest of the World |
197 |
|
|
World |
509 |
|
|
2002 data |
|
** Gross production less production from pumped storage plants.
** Total exports and total imports (including transit).
2 |
Importers** |
TWh |
Italy |
52 |
Germany |
48 |
Brazil |
37 |
United States |
36 |
Switzerland |
28 |
Netherlands |
21 |
Sweden |
20 |
Belgium |
17 |
Canada |
16 |
Austria |
15 |
|
|
Rest of the World |
233 |
|
|
World |
523 |
|
|
2002 data |
|
27
C |
|
|
|
|
|
|
|
|
O |
|
T O T A L F I N A L C O N S U M P T I O N |
||||||
N |
|
|||||||
S |
|
|||||||
U |
|
|
|
|
|
The World |
||
M |
|
|
|
|
|
|||
P |
|
|
|
|
|
|
|
|
|
|
|
|
|
|
|
|
|
T |
|
|
|
|
|
|
|
|
|
Evolution from 1971 to 2002 of World Total Final Consumption |
|||||||
I |
|
|||||||
|
|
|
|
|
by Fuel (Mtoe) |
|||
O |
|
|
|
|
|
|||
|
|
|
|
|
|
|
|
|
8000 |
|
|
|
|
|
|
||
N |
|
|
|
|
|
|
||
7000 |
|
|
|
|
|
|
||
|
|
|
|
|
|
|
||
|
6000 |
|
|
|
|
|
|
|
|
|
|
|
|
|
|
||
|
5000 |
|
|
|
|
|
|
|
|
|
|
|
|
|
|
||
|
4000 |
|
|
|
|
|
|
|
|
|
|
|
|
|
|
||
|
3000 |
|
|
|
|
|
|
|
|
|
|
|
|
|
|
||
|
2000 |
|
|
|
|
|
|
|
|
|
|
|
|
|
|
||
|
1000 |
|
|
|
|
|
|
|
|
|
|
|
|
|
|
||
|
0 |
|
|
|
|
|
|
|
1972 |
1974 1976 |
1978 |
1980 |
1982 |
1984 |
1986 |
1988 |
1990 |
1992 |
1994 |
1996 |
1998 |
2000 |
2002 |
|||||
|
Coal |
|
|
|
|
|
|
|
|
|
|
Oil |
|
|
|
Gas |
|
||
|
|
|
|
|
|
|
|
|
|
|
|
|
|
||||||
|
|
|
|
|
|
|
|
|
|
|
|
|
|
||||||
|
Combustible Renewables & Waste* |
|
|
|
|
Electricity |
|
|
|
Other** |
|||||||||
|
|
|
|
|
|
|
|
||||||||||||
|
|
|
|
|
|
|
|
||||||||||||
1973 and 2002 Fuel Shares of
Total Final Consumption
|
1973 |
|
|
|
|
2002 |
|
||
Combustible |
Electricity |
Other** |
Coal |
|
Electricity |
Other** |
Coal |
||
9.6% |
1.7% |
|
3.5% |
||||||
Renewables |
|
13.6% |
Combustible |
16.1% |
|
7.1% |
|||
& Waste* |
|
|
|
|
|
|
|
|
|
|
|
|
|
Renewables |
|
|
|
|
|
13.2% |
|
|
|
|
|
|
|
|
|
|
|
|
|
& Waste |
|
|
|
|
|
|
|
|
|
|
|
|
|
|
|
|
|
|
|
|
14.1% |
|
|
|
|
Gas |
|
|
|
|
|
|
|
|
|
14.8% |
|
|
|
Oil |
|
Gas |
|
Oil |
|
|
|
|
|
|
16.2% |
|
|||
|
|
|
|
47.1% |
|
|
43.0% |
||
|
|
|
|
|
|
|
|
||
|
|
|
|
|
|
|
|
|
|
|
|
4 549 Mtoe |
|
|
|
7 095 Mtoe |
|
||
* Prior to 1994 combustible renewables & waste final consumption has been estimated
based on TPES. **Other includes geothermal, solar, wind, heat, etc.
28