


CELL COUNTER, BLOOD |
81 |
CATARACT EXTRACTION. See LENSES, INTRAOCULAR.
CELL COUNTER, BLOOD
YI ZHANG
SRIRAM NEELAMEGHAM
University of Buffalo
Buffalo, New York
INTRODUCTION: NATURE OF BLOOD CELLS (1,2)
Cells compose 50% of the volume of normal human blood, while plasma constitutes the remaining volume. Generally, cells in blood are divided into three categories: platelets, erythrocytes (or red blood cells, RBCs) and leukocytes (or white blood cells, WBCs) (Table 1) (3). Among these, the platelets or thrombocytes are small, irregular, disk-shaped cells that lack a nucleus. They are of size 2–3 mm in diameter. These cells primarily function to stop bleeding or hemorrhage, and they also participate in coronary artery disease. They do so by being part of the blood coagulation cascade and by aggregating with each other. Platelets are found in blood at a concentration of 0.15– 0.5 106 cells mm 3. The second type of cells in blood, erythrocytes, contains a red respiratory protein called hemoglobin. These are disk-shaped, biconcave cells without nuclei. Their diameter ranges from 6 to 8 mm and their thickness is 1.5–2.5 mm. The primary function of erythrocytes is to transport oxygen and carbon dioxide between the lung and body tissues. Erythrocytes are the most numerous blood cells at concentrations of 4–6 106 cells mm 3. Mature erythrocytes emerge from precursors that are called reticulocytes. Erythrocyte counts are on average
10% higher in the human adult male population than those in the female population. Lack of iron and hemoglobin in erythrocytes can lead to anemia, a pathological deficiency in the oxygen-carrying component of blood. The third type of blood cells is the leukocytes, whose primary function is to provide the body with immunity and to protect it from infection. Leukocytes are fewer in number than the erythrocytes with a concentration of
5–10 103 cells mm 3. These cells are roughly spherical in shape and they contain nuclei, and considerable internal and cell-surface structures.
Leukocytes are categorized in various ways depending on their function and differentiation pathway. One com-
Table 1. Characteristic of Normal Blood Cellsa
mon method subdivides these cells into myeloid and lymphoid cells. Myeloid cells differentiate into phagocytes, while lymphoid cells primarily produce lymphocytes. The phagocytes include polymorphonuclear granulocytes and monocytes–macrophages. Of these, the former have lobed, irregular shaped (polymorphic) nucleus. They are further subdivided into neutrophils (55–70% of all leukocytes), eosinophils (2–4%), and basophils (0.5–1%), on the basis of how the cellular cytoplasmic granules are stained with acidic and basic dyes. Leukocytes are also commonly characterized based on particular cell-surface receptors that are expressed by them, since these are specific to a particular subpopulation. Many of these receptors are recognized by monoclonal antibodies. A systematic nomenclature has now evolved in which the term CD (Cluster Designation) refers to a group of antibodies that recognize a particular cell-surface antigen. The CD classification is thus often used to classify and identify particular leukocyte subpopulations. A method of blood cell counting called flow cytometry (described below), often uses the fluorescence of labeled antibodies to distinguish between various cell types.
Among the granulocytes, neutrophils are the most abundant cell type. These represent the body’s first line of defense during immune response. They are characterized by a number of segmented nucleus lobes connected by fine nuclear strands or filaments. Immature–young neutrophils have a bandor horseshoe-shaped nucleus. Thus, while the younger neutrophils are known as band neutrophils, the mature cells are the segmented neutrophils. Segmented neutrophils are the predominant species in human blood, while band neutrophil levels are elevated following bacterial infection or acute inflammation. The term left shift is used to indicate an increase in the number of circulating immature neutrophils. Condition under which the number of circulating neutrophils is increased is called neutrophilia, while a decrease in this cell type results in neutropenia. Another important morphological characteristic of neutrophils is the virtual lack of endoplasmic reticulum and mitochondria. Mature neutrophils have short lifetimes in circulation and they migrate into tissues to defend against invading microbes during inflammation. Eosinophils, like other granulocytes, possess a polymorphous nucleus, generally with two lobes. They can response to allergy and parasitic infection. They attack large parasites such as helminthes via their C3b receptors. Eosinophils release various substances from
Cell Type |
Concentration |
Size, mm |
Density, g mL |
Shape |
Nucleus |
Cytoplasm |
Platelet(thrombocyte) |
0.15–0.5 106 mL 1 |
2–3 |
1.03–1.06 |
Small disk shape |
None |
Granular |
Erythrocyte (RBC) |
4–6 106 mL 1 |
6–8 |
1.09–1.11 |
Biconcave disk |
None |
Hemoglobin |
Leukocyte (WBC) |
5–10 103 mL 1 |
8–20 |
1.05–1.10 |
|
|
|
Neutrophil |
55–70% of WBC |
9–15 |
1.08–1.10 |
Various |
Lobed |
Granular |
Eosinophil |
2–4% of WBC |
9–15 |
1.08–1.10 |
Various |
Lobed |
Granular |
Basophil |
0.5–1% of WBC |
10–16 |
1.08–1.10 |
Various |
Lobed |
Granular |
Monocyte |
3–8% of WBC |
14–20 |
1.05–1.08 |
Various |
Round |
Fine |
Lymphocyte |
20–40% of WBC |
8–16 |
1.05–1.08 |
Round |
Round |
Clear |
a(Adapted from Ref. 3. pp 3–6.)
82 CELL COUNTER, BLOOD
their eosinophilic granules. These include major basic proteins, plus cationic proteins, peroxidase, phospholipase D and histaminase. The number of eosinophils can augment in blood during allergy (eosinophilia), dermatological disorder and parasitic infection. Basophils have a two-lobe nucleus. They release inflammatory mediators, such as histamine and bradykinin, and prostaglandins and leukotrienes. Basophils play an important role in inflammatory and allergic response. Their number is increased in patients with hypoactive thyroid conditions and during certain malignancies like chronic myeloid leukemia.
Monocytes and macrophages (tissue monocytes) represent the second type of phagocytes and these are relatively large, long-lived cells compared to polymorphonuclear granulocytes. Their cytoplasm is transparent with typically a horseshoe-shape nucleus. Monocytes are involved in both acute and chronic inflammation. The transformation from monocytes to macrophages is controlled by different cytokines. When responding to chemical signals at the inflammation site, monocytes quickly migrate from the blood vessels and start to perform phagocytotic activity. These cells also have an intense secretory activity that results in the production and secretion of chemical mediators such as lysozymes and interferons. The number of monocytes in circulation is increased whenever there is increased amount of cell damage, such as during recovery from infection.
Lymphocytes are mononuclear cells that constitute20–40% of all leukocytes. These cells have a round or oval shaped nucleus that is typically large in comparison to the overall cell size. Besides circulating in blood vessels, lymphocytes also populate the lymphoid organs, as well as the lymphatic circulation. The specificity of immune response is due to lymphocytes, since these cells can distinguish between different antigenic determinants. Lymphocytes are subdivided into three main categories: (1) T-cells, (2) B-cells, and (3) natural killer (NK) cells. T-Cells are responsible for cellular immune response and are involved in the regulation of antibody reactions by either helping or suppressing the activation of B lymphocytes. B cells are the primary source of cells responsible for humoral–antibody responses. These are responsible for the production of immune antibodies. The NK cells destroy target cells via nonphagocytic reaction mechanisms that are termed cytotoxic reaction. Lymphocyte number may increase in blood in patients with skin rashes from certain viral diseases such as measles and mumps, in patients with thyrotoxicosis, and in patients recuperating from certain acute infections.
RATIONALE FOR CELL COUNT
Blood cell count is achieved by determining the concentrations and other parameters of different cell types in a unit volume of circulating blood. It can be a complete blood count (CBC, defined later in this article), which examines every blood component, or it may measure only one element. Table 1 demonstrates the characteristic of normal blood cells from a healthy adult. These values vary with age, sex, race, living habit, and health status. Further, under pathological conditions, the distribution of blood cells may be perturbed and
thus blood cell counting can aid diagnostics. For example, a typical symptom of common anemia is an inadequate amount of RBCs. The increase or decrease in the numbers of the different types of WBCs may indicate infection and inflammation as discussed above. In addition to the cell numbers, other information regarding blood cells, such as cell size, is also important. For example, in patients with anemia caused by vitamin B12 deficiency, the average size of the RBCs is larger than normal and this disease state is called macrocytic anemia. On the contrary, if red blood cells are smaller than normal, as in the case of microcytic anemia, the condition may be indicative of iron deficiency. Therefore, a routine blood test, which includes not only blood cell count but also measurement of other parameters, can aid disease diagnosis and treatment by health professionals.
HISTORY AND BASIC PRINCIPLES FOR BLOOD CELL COUNTING (4–10)
Cell counting has evolved over the centuries from a manual method that heavily relied on microscopic examination, to one where electrical and optical measurement strategies, along with computer automation, are playing an increasingly important role. Indeed, manual methods are still important in research laboratories that study a wide variety of animal systems and cell types, in addition to human blood. On the other hand, automated systems are typically used in clinical studies. In this context, modern technology has automated the process of blood cell counting and the assessment of various blood cell parameters. A CBC, thus, not only provides a panel of tests to quantify the composition of whole blood, it may also include more detailed information regarding the cell profile. Based on technical feasibility and cost, either a simple manually operated cell counter or a more advanced automated blood count platform can be applied to serve the specific medical diagnose need. A brief history and rationale that has lead to current strategies for blood cell counting is outlined below.
Microscopy Coupled with Manual Visualization
Notable, among the early attempts to count blood cells, was the work by Anton van Leeuwenhoek in the seventeenth century who counted the number of chicken erythrocytes in a glass capillary of known dimensions using his microscope. Later, in the nineteenth and early twentieth century, Burker employed a shallow rectangular chamber with a thin coverglass as a counting chamber. Advances in this basic design have now resulted in the laboratory hemocytometer, which is commonly employed for manual cell counting. Ehrlich’s classical work on the staining of white blood granules laid the foundations of hematology and differential cell counting. In these studies, he demonstrated that it is possible to distinguish between the various blood cell subgroups using acidic and basic dyes that differentially stained the cellular granules and nucleus.
Hemocytometer
One device that utilizes the light microscope for cell counting is the hemocytometer. This is a commercially
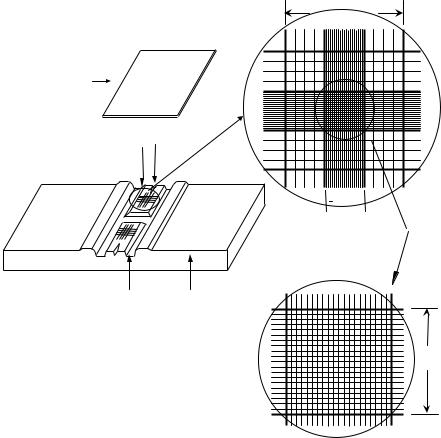
available counting chamber that is used for manual blood counting. It consists of two parts: a microscopic slide with improved Neubauer ruling, and a special thick flat cover slip (Fig. 1a). Both the hemocytometer slide and cover slip must meet specifications of the National Bureau of Standards. The slides have two raised surfaces for duplicate cell counting, each of them bearing square-shaped grids of dimensions 3 3 mm. The two raised surfaces are separated by an H-shaped moat. Each of the 3 3 mm squares has a central area of size 1 1 mm that is further subdivided by 25 groups of 16 smaller squares (Fig. 1b and c). During cell counting, the coverslip is placed on top of the counting surfaces such that the distance between the counting surface and the coverslip is 0.1 mm. Thus, the total volume in the space between the central 1 1 mm area and the coverslip is fixed at 0.1 mm3. Samples to be studied can be loaded into the chamber using a standard laboratory pipette placed at the point labeled V-slash.
A phase contrast microscope is used to view blood on a hemocytometer slide. In such runs, a sample of diluted blood mixture is placed in a hemocytometer. For a proper count, cells should be evenly distributed. In a white cell count, blood is typically diluted 1:20 in a solution that lyses red cells and stains white cells. Because red cells are so much more numerous than white cells, blood is normally diluted 1:200 for red cell counts. The total number of cells in the central area with fixed volume of 0.1 mm3 is
CELL COUNTER, BLOOD |
83 |
counted and this measurement is used to estimate the concentration of cells per cubic millimeter (mm3) according to, cell concentration ¼ number of cells counted dilution factor / volume under central grid. For simplicity, instead of counting all the cells in the central 1 1 mm area, counting cells present in a sufficient number of representative squares is also reasonable as long as the acceptable level of accuracy can be ensured. A suitable convention should be applied to avoid counting cells twice, for example, by counting only those cells that touch the top and right-hand margins of a square and omitting cells that touch the bottom and left margins. The World Health Organization (WHO) has recommended methods for the visual determination of WBC count and platelet count using hemocytometer (Recommended methods for the visual determination of WBC count and platelet count. Geneva: World Health Organization, 2000. WHO/DIL/00.3). It describes the detailed sample preparation procedure and counting techniques, and this could be used as a basic protocol for cell counting using the hemocytometer.
Electrooptic Measurements
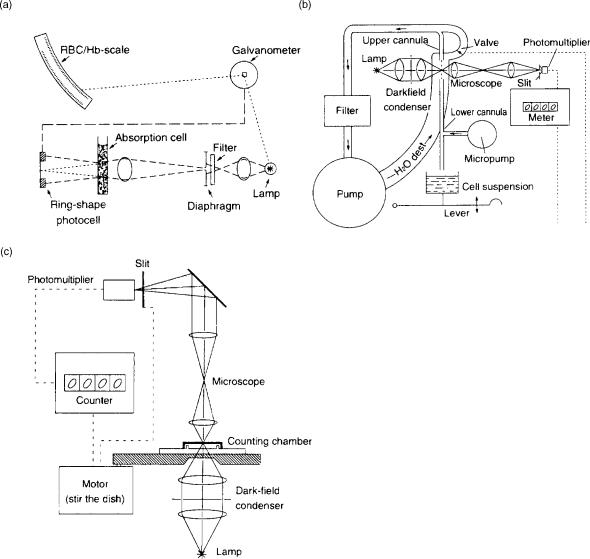
Advances in electronics and electrooptics in the twentieth century have dramatically simplified blood cell counting and made automation of these processes possible. Some examples of early advances are illustrated in Fig. 2. Panel a describes a method developed in the 1940s where cells
(a) |
(b) |
3mm
Cover slip
Ruled area
0.1mm depth V slash
 1mm
1mm
Moat Microscopic
slide
(c)
1mm
Figure 1. (a) Diagram of hemocytometer with cover slip. (b and c) Expanded view of ruled area as seen under a microscope.
84 CELL COUNTER, BLOOD
Figure 2. (a) Schematic of an early instrument using the ensemble method to obtain a blood cell count. The intensity of light that is scattered onto a ring-shaped photodetector is measured. The intensity is proportional to cell concentration. (b) Schematic of a photoelectric device that optically counts cells under flow. Here, a fluid stream containing cells is passed through a microscope viewing station. The photomultiplier detects the passage of cells. (c) Schematic diagram of a device using a photoelectric spot scanning method. Mechanical motion is provided to scan cells contained in the counting chamber (3).
were electrooptically measured based on turbidimetry. Here, light lost per millimeter of path length based on scattering or absorbance by blood cells was related to cell concentration. Using cell reference or artificial standards, thus, RBC concentrations could be determined. In this approach, instead of detecting cells individually, the cell concentrations were measured using principles analogous to Beer’s law. Panel b illustrates a photoelectric device from 1953, where a thin fluid stream was created such that single cells passed via a microscope viewing station. Images of these cells were magnified and detected using a photomultiplier tube. Panel c illustrates another early instrument where erythrocytes could be counted automatically by means of photoelectric spot-scanning of a thin
layer of diluted blood. Here the manual visual counting chamber technique discussed above was improved by introducing a photomultiplier and an electronic counting unit. A motor drives the counting chamber. An instrument based on this principle is the Casella Counter shown in Fig. 2c.
Electronic Cell Counter
In 1950s, Wallace Coulter (Founder of Coulter Company, now Beckman-Coulter Co.) developed a method for cell counting based on electric impedance. This method now forms the basis of most particle size analysis methods in the world. This method, also called low voltage direct
Electrical |
|
|
|
|
|
Threshold |
|
pulse |
|
|
|
|
|
circuit |
|
amplifier |
|
|
|
|
|
|
|
|
|
|
|
Vacuum
Oscilloscope
Counter
control
Result
output
Figure 3. Schematic diagram of electronic cell counter using electric resistance method.
current (dc) method, is based on the measurement of changes in electrical resistance as cells pass through a small orifice that separates two electrodes. In this type of device (Fig. 3), cells are suspended in an electrically conductive diluent, such as saline. Low frequency electrical current is applied between two electrodes; one of them being placed in the cell medium and the second within the aperture tube. The aperture tube has a small orifice or sensing aperture that is typically of size 50–200 mm in diameter. During the measurement, cells are drawn through the aperture using a pressure gradient that is either generated by a mercury manometer or oil displacement pump. Cells are assumed to be non-conducting. Electrical resistance between the two electrodes or impedance in the current occurs as the cells pass through the sensing aperture, causing voltage pulses that are measurable. The number of pulses is proportional to the number of cells counted. The size of the voltage pulse is directly proportional to the size (volume) of the cell. This principle allows discrimination between cells of different sizes. Counting of specific-sized cells is also possible using threshold circuits that cut-off voltage pulses above and below predetermined values. The quantity of suspension drawn through the aperture is precisely controlled to allow the system to count and size particles precisely. Finally, several thousand particles are individually counted within seconds in this device. Measurements are independent of particle shape, color, and density.
Analogous to the above method is the radiofrequency (RF) resistance method where high voltage electromagnetic current is flown between the two electrodes instead of dc. This current circuits the cell membrane lipid layer and penetrates into the cell. While the dc method defines the volume of the cell, changes in conductivity measured using the RF method correlate with the cell’s interior structure including the nucleus volume and density, and cytoplasm granule composition. Both dc and RF may be applied simultaneously and this can yield different information about cell size and cellular structure. Such a dual measurement strategy is employed by Sysmex cell counters to quantify the differential leukocyte counts (DLC) as discussed later.
Several factors affect the precision and accuracy of measurements made using the electric impedance meth-
CELL COUNTER, BLOOD |
85 |
ods. First, the aperture size is critical. The instrument is set to count only particles within the proper size range. The upper and lower levels of the size range are called size exclusion limits. Any cell or material larger or smaller than the size exclusion limits will not be counted. Sample must also not contain other material that might erroneously be counted as cells. In practice, erythrocyte and platelet aperture should be smaller than leukocyte aperture in order to increase platelet count sensitivity. Besides the size exclusion limits and aperture size, cell shape and physical properties are also important in determining the shape factor or the ratio of electrically measured volume to the geometric volume. Erythrocytes may result in different signals depending on their orientation with respect to the aperture in the sensing zone. Simultaneous passage of more than one cell at a time through aperture may also cause artificially large pulses, and thus circuits to correct for this coincidence error are required. The magnitude of the coincidence error increases with cell concentration. Correction should be completed by the countercomputer based on the relationship of cell count with cell concentration and aperture size. Finally, an internal cleaning system to prevent or slow down protein buildup in aperture is beneficial in minimizing aperture blockage.
Hydrodynamic focusing as discussed below helps to solve many of the problems above and it provides improved cell counting and characterization. This has been developed and assembled in many cell counters today and this feature dramatically improves the cell volume distribution resolution.
Laser Light Scattering and Fluorescence Detection
Optical scattering can be used alone or in combination with other electrical measurement strategies discussed above for cell counting and characterization. A key feature of such instruments is hydrodynamic focusing where an external sheath flow allows alignment of blood cells one-at-a-time in the path of a light beam, usually within a quartz flow cell (Fig. 4a). Incident light on cells within this flow stream are scattered or redirected in a manner that is dictated by the size of the cell and the intracellular distribution of refractive index. Lasers are generally preferred as the light source since it produces monochromatic light that has a small spot size. Photomultiplier tubes (PMTs) are used to collect the weak signal of scattered light. The light scattered at angles from 5–108 (forward scatter) in general correlates with cell size. Light scattered at 908 is called side-scatter and this is related to the cell shape, orientation, and cellular content. A cell with many complex intracellular organelles will also give a larger side-scatter signal than a cell with fewer intracellular organelles. The design of precise angles where scattered light signals are measured is specific to instrument manufacturers and the cell-enumeration strategy employed. In general, these scatter data together allow reliable identification of distinct populations, such as platelets, RBCs, monocytes, and neutrophils in a mixture. They can also allow enumeration of lymphocyte subsets and reticulocytes. While, optical scattering methods reveal information about cells that is

86 CELL COUNTER, BLOOD
Figure 4. (a) Schematic of flow cytometry showing hydrodynamic focusing of cells by sheath fluid that brings the cells in the path of a laser beam. Light scattered by cell at various angles is collected. These are passed through an arrangement of optical filters to yield measures of forward scatter, side scatter and particle fluorescence. (b) Stokes shift is depicted for the fluorescent probe fluorescein where the wavelength of the absorbed and emitted quanta are shifted, with the emitted wavelength being longer than the absorbed light.
distinct from that obtained from the above electrical methods, their estimates of cell volume are not as accurate as the electrical methods.
A major advantage of optical methods using lasers is that such methods can be readily coupled with fluorescence detection (Fig. 4b). Fluorescent conjugated antibodies to specific cell-surface CD markers or specific ligands can be used not only to identify particular blood cells, but also to label cellular components that may be indicative of disease states. In such work, when the laser light reaches these cells, a fraction of the photons are absorbed by the fluorescent probe, which then reemit the photon at a longer wavelengths. The quantity of this emitted light (both scattered and fluorescent) is measured using photomultiplier tubes that are arranged in conjunction with a series of optical filters and dichroic mirrors as shown in Fig. 4a. The detection and conversion of scattered or fluorescent light into electrical signals is accomplished by photodetectors
that capture photons on a light sensitive surface that elicits an electron cascade. The signal output from such detectors is amplified (either linearly or logarithmically) and then converted from analog to digital form for computer analysis. Multidimensional plots of various scattering properties with fluorescent signals can thus be generated to individually characterize each cell in a complex mixture.
COMPLETE BLOOD CELL COUNT (5,10)
Computer Blood Cell Count is a series of tests that result in the quantitation of the number of erythrocytes, leukocytes, and platelets in a volume of blood. The measurements also estimate the hemoglobin content and packed cell volume (or hematocrit) of erythrocytes. This can be done manually using a microscope along with cytochemical dyes, such as Wright–Giemsa stain. The combination of acidic and basic
dyes here can differentially stain the granules, cytoplasm, and nuclei of various blood cell types. Alternatively, in clinical laboratories an automated cell counter can be used to count cells in a given volume. Low end instruments offer RBC and platelet analysis with three-part differential leukocyte count (DLC) while higher end instruments may include a five-part differential count along with reticulocyte analysis. The speed of the instrument and level of automation varies with the class of instrument. The analysis thus obtained is compared with the normal range and assessed for clinical or research purposes. A complete blood cell count mainly includes the following parameters:
Hemoglobin
Hemoglobin concentration (HGB) is reported in grams per deciliter (g dL 1) of blood. This parameter typically varies in proportion to erythrocyte concentration in blood. The normal range for hemoglobin is age and sex dependent. Traditionally, hemoglobin is measured using the cyanmethemoglobin method, as recommended by the International Council for Standardization in Hematology (ICSH). Here, a lysing agent is added to disrupt RBCs and to release cellular hemoglobin. This hemoglobin is converted into a stable form called cyanmethemoglobin (see reaction below), the quantity of which can be measured using a spectrophotometer for absorbance measurement at 540 nm.
Hb Fe2þ |
K3FeðCNÞ6 methemoglobin |
Fe3þ |
Þ |
|
ð |
Þ ! |
ð |
|
|
KCN
! cyanmethemoglobin
Since cyanmethemoglobin measurements contain poisonous cyanide reagent, other more environmentally friendly methods for automated HGB measurement have been developed. Among them, sodium lauryl sulfate-hemoglobin (SLS-Hb) method is used by Sysmex automated cell counters. Here, the lauryl group of the ionic surfactant, which is hydrophobic, binds strongly with hemoglobin. This binding leads to rapid globin molecular conformation change and conversion of hemoglobin from the ferrous (Fe2þ) to the ferric (Fe3þ) state. The hydrophilic group of SLS now binds with Fe3þ to form a stable SLS-Hb. The absorption maximum of SLS-Hb occurs at 535 nm with a shoulder at 560 nm, and this feature is used to determine hemoglobin content. This reaction mechanism is useful since conversion to SLS-Hb occurs rapidly within 10 s.
Platelet Count
Platelet count (PLT) is normally expressed as thousands per microliter (mL) and can be measured manually using the hemocytometer. Care must be taken during such measurements to avoid platelet clumps that can occur in the absence of appropriate anticoagulant. Electronic counting of platelets can also be performed using electric impedance or light scattering methods. Such measurements are typically performed in channels that are designed to discriminate between erythrocytes and platelets. Size distributions resulting from platelet counts can be used to estimate the mean platelet volume (MPV), which is a measure of the platelet volume variation. In general, increased MPV
CELL COUNTER, BLOOD |
87 |
may be expected in regenerative thrombocytopenia, which is accompanied by an increased production of platelets by bone marrow.
Red Blood Cell Count
The RBC or erythrocyte count is expressed in millions per microliter of whole blood. Such counts can be measured manually using the hemocytometer. In hematology analyzers, RBC content is typically measured using either the dc impendence method, light scattering analysis, or a combination of the two. Attention is placed during these measurements to discriminate between small RBCs and platelets. Results of such analysis typically result in a RBC size distribution plot from which other indices can be estimated. These indices include: (1) Hematocrit (HCT), which is also called packed cell volume (PCV). This is a measure of the volume fraction of RBCs in whole blood expressed in %vol/vol. Normal adult hematocrit ranges from 35 to 50%, and this is both sex and age dependent. Traditionally, hematocrit is determined by monitoring the height of packed RBCs after centrifugation in a standard microhematocrit tube, relative to the column length. Electronic cell analyzers can also estimate hematocrit by measuring the individual volumes of RBCs (also called MCV as described below) and determining the product of RBC count and MCV. (2) Mean corpuscular volume (MCV) is the mean volume of RBCs expressed in femtoliters (fl). The normal range is 80–100 fL. The MCV can be experimentally determined from the RBC size distribution height. Alternatively, if HCT value is known, MCV is calculated based on the ratio of hematocrit and RBC count. This parameter is analogous to MPV, which can be derived from platelet data. When the MCV is low with normal HCT, the blood is said to be microcytic. (3) Mean corpuscular hemoglobin concentration (MCHC) is the mean concentration of hemoglobin in the RBCs in grams per deciliter (g dL 1). This is calculated based on the ratio of HGB by HCT. Red cell populations with normal, high, or low values of MCHC are referred to as normochromic, hyperchromic, or hypochromic, respectively. The last case can occur during strongly regenerative anemia, where an increased population of reticulocytes with low HGB content pulls the average value down (an increased MCV would be expected under this scenario). (4) Mean corpuscular hemoglobin (MCH) is a measure of the mean mass of hemoglobin (HGB) in RBC, and is expressed in picograms (pg). (5) Red cell distribution width (RDW) is an index of the variation in cell volume within the RBC population. It is mathematically determined by (Standard deviation of RBC volume/ MCV) 100. The normal range for RDW is 11–15%. While, red cell populations with normal RDW are called homogeneous, those with higher than normal are termed heterogenous. For example, increased number of reticulocytes, which is associated with erythropoiesis, will cause increased RDW values. The RDW index may be an early indicator of changes in red cell population sizes, for example, during anemia caused by iron deficiency. In this case, the presence of few microcytic RBCs may increase the standard deviation of the cell distribution even before marked changes in MCV are observed.

88 CELL COUNTER, BLOOD
White Blood Cell Count
White blood cell or leukocyte count is measured in thousands per microliter. During manual WBC count, RBCs in blood are lysed and diluted sample is charged into the hemocytometer. Nucleated cells are counted and WBC concentration is determined. Alternatively, impedancebased electronic cell counters can be used to measure WBC count. Besides these basic methods, in automated cell counters, one of many technologies can be applied for WBC differential count. Beckman–Coulter instruments employ the VCS (volume, conductivity, and scattering) technology. In this method, the dc impedance principle is used to physically measure the volume of the cell that displaces the isotonic diluent. Alternating current in the RF range short circuits the bipolar lipid layer of the cell membrane allowing energy penetration into cell. This probe provides information on cell size and internal structure. This data is adjusted by the cell volume measurement to obtain an index called opacity. Finally, coherent light scattering from an incident laser beam is collected to obtain information on cellular granularity and cell surface structure. In Sysmex instruments both dc and RF methods are employed along with differential lysis of cells using lysis solution and temperature treatment. In CELL-DYN instruments from Abbott laboratories, the Multi-Angle Polarization Scattering Separation (M.A.P.S.S.) technology is used to obtain the differential count. Here light scattered by cells localized in a hydrodynamically focused flow stream is measured at three angles (0, 10, and 908). Polarized light at 908 is also measured. Together these four parameters are used to perform the five-part differential count. Two methods are employed in the Bayer cell counters for differential leukocyte count. In the first method called the peroxidase method, RBCs are lysed and white cells are stained with peroxidase. These cells are counted based on size by forward scatter analysis, and absorbance using dark field optics. The second method, called the basophil method, involves stripping the cells using a non-ionic surfactant in acidic solution. Basophils are resis-
tant to lysis while RBCs and platelets are lysed and other leukocytes are stripped of their cytoplasm. Light scattering analysis distinguishes basophils from other polymorphonuclear and mononuclear cells. The above peroxidase and basophil methods thus provide automated differential cell count by separating the cells into clusters.
Reticulocyte Count (RTC, RET, or RETIC)
Reticulocytes are formed in the last stages of erythropoiesis. These cells spend 2 days in the bone marrow and 1–2 days in peripheral blood prior to maturing into RBCs. These are nonnucleated RBC, which by definition upon staining with supravital dyes contain two or more particles of blue-stained material that correspond to ribosomal RNA (ribonucleic acid). With new methylene blue, reticulocytes stain bluish-purple. Reticulocyte count as a percentage of RBCs is a measure of the erythropoietic activity in the bone marrow. This is a useful marker of bone marrow suppression following chemotherapy, recovery from anemia, and so on. Reticulocyte counts may be high when the body is replenishing the RBCs in circulation. Reiculocyte counts can be performed using microscopy and supravital stains, such as new methylene blue or brilliant cresyl blue. Reticulocyte counts can also be done using automated instruments. Here light scattering is typically applied to detect cell size and cell fluorescence–absorbance measurements in conjunction with dyes like Auramine O and new methylene blue for quantitation of reticulocytes. Such methods provide good discrimination between reticulocytes and mature RBCs, with greater accuracy than microscopy examination.
AUTOMATED CELL COUNTERS (4,5)
Manufacturers of automated cell counters typically present a vast product line with varying levels of sophistication to meet the market needs. Although the analysis principles may differ, all cell counters have some common basic components, specifically hydraulics, pneumatics and electrical systems (Fig. 5). Among these, the hydraulic
Figure 5. Flow diagram of an automated multichannel cell counter. (Adapted from Ref. 3).
|
|
|
|
|
|
|
|
|
|
|
|
|
|
|
|
|
|
RBC |
|
|
|
|
|
|
|
|
|
|
|
|
|
|
|
|
|
|
|
|
|
|
|
|
detection |
|
|
|
|
|
|
|
|
|
|
|
|
|
|
|
|
|
|
|
|
|
|
|
|
|
|
|
|
|
|
|
|
|
|
|
|
|
|
|
|
|
|
|
|
|
|
|
|
|
channel |
|
|
|
|
|
|
|
|
|
|
|
|
Diluent |
|
|
|
|
|
|
|
|
|
|
|
|
|
|||||
|
|
|
|
|
|
pump |
|
|
|
|
|
|
|
|
|
|
|
|
|
|
|
|
|
|
|
|
|
|
|
|
|
|
|
|
|
|
|
|
|
|
PLT |
|
|
|
|
|
|
||
|
|
|
|
|
|
|
|
|
|
|
|
|
|
|
|
|
|
|
|
|
|
|
|
|
|
|
|
|
|
|
|
|
|
|
|
|
|
|
|
|
|
|
detection |
|
|
|
|
|
|
|
|
|
|
|
|
|
|
|
|
|
|
|
|
|
|
|
|
channel |
|
|
|
|
|
|
|
|
|
|
|
|
|
|
|
|
|
|
|
|
|
|
|
|
|
|
|
||||
|
|
|
|
|
|
Dilutor |
|
|
|
RBC mixing |
|
|
|
|
|
|
|
|
|
|
||||
|
|
|
|
|
|
dispenser |
|
|
|
|
chamber |
|
|
|
|
|
|
|
|
|
|
|||
|
|
|
|
|
|
|
|
|
|
|
|
|
|
|
|
|
||||||||
|
|
|
|
|
|
|
|
|
|
|
|
|
|
|
|
|
|
Reticulocyte |
|
|
|
|
Computer |
|
|
|
|
|
|
|
Dilutor |
|
|
|
WBC mixing |
|
|
|
detection |
|
|
|
|
data analysis |
|||||
|
|
|
|
|
|
|
|
|
|
|
|
channel |
|
|
|
|
||||||||
|
|
|
|
|
|
dispenser |
|
|
|
|
chamber |
|
|
|
|
|
|
|
|
|
||||
|
|
|
|
|
|
|
|
|
|
|
|
|
|
|
|
|
|
|
|
|||||
|
|
|
|
|
|
|
|
|
|
|
|
|
|
|
|
|
|
WBC/DLC |
|
|
|
|
|
|
|
|
|
|
|
|
|
|
|
|
|
|
|
|
|
|
|
|
|
|
|
||||
|
|
|
|
|
|
|
|
|
|
|
|
|
|
|
|
|
|
detection |
|
|
|
|
|
|
Sample |
|
|
|
|
|
|
|
|
|
|
|
|
|
|
|
|
|
|
|
Result |
||||
|
|
|
|
|
|
|
|
|
|
|
|
|
|
|
|
|||||||||
|
|
|
|
|
|
|
|
|
|
|
|
|
|
|
channel |
|
|
|
|
|||||
|
|
|
Diluent |
|
|
|
|
Lysing |
|
|||||||||||||||
station |
|
|
|
pump |
|
|
|
|
chamber |
|
|
|
|
|
|
|
|
|
printout |
|||||
|
|
|
|
|
|
|
|
|
|
|
|
|
|
HGB |
|
|
|
|
|
|
||||
|
|
|
|
|
|
|
|
|
|
|
|
|
|
|
|
|
|
|
|
|
|
|
|
|
|
|
|
|
|
|
|
|
|
|
|
|
|
|
|
|
|
|
detection |
|
|
|
|
|
|
|
|
|
|
|
|
|
|
|
|
|
|
|
|
|
|
|
|
|
|
|
|
|
|
|
|
|
|
|
|
|
|
|
|
|
|
|
|
|
|
|
|
|
channel |
|
|
|
|
|
|
|
|
|
|
|
|
|
|
|
|
|
|
|
|
|
|
|
|
|
|
|
|
|
|
|
|
|
|
|
|
|
|
|
|
|
|
|
Lysing |
|
|
|
|
NRBC |
|
|
|
|
|
|
|
|
|
|
|
|
|
|
|
|
|
|
|
agent |
|
|
|
|
detection |
|
|
|
|
|
|
|
|
|
|
|
|
|
|
|
|
|
|
|
|
|
|
|
|
|
channel |
|
|
|
|
|
|
|
|
|
|
|
|
|
|
|
|
|
|
|
|
|
|
|
|
|
|
|
||||

CELL COUNTER, BLOOD |
89 |
system is designed to dispense, dilute and mix samples prior to analysis. The pneumatic system operates various valves and drives the sample through the hydraulic system. The electrical system controls the operation sequences including optical–electrical detection of signals and com- puter-assisted data analysis. Instrument electronic analyzers typically have at least two channels. In one channel a diluent is added and RBCs are counted and sized. In the second, lysing agent is added to remove red blood cells and leave WBC intact for counting. These also produce a solution in which hemoglobin can be measured. Platelet count may be performed in either of these two channels or in a different channel. Normally, a separate channel will be required for reticulocyte count measurement. Analysis of a single blood specimen can be performed rapidly within 1 min, and results are presented in the form of numerical tables, histograms, or cytograms. The degree of analysis is both software and user dependent. Upon comparison with standard values, the software may also place flags on the output data that indicate either potential problem with analysis or deviation from cell count characterization of normal controls.
Numerous companies manufacture automated cell counters. Table 2 presents the characteristics of four high end instruments manufactured by some of them.
The Beckman–Coulter LH750 (Beckman Coulter Inc., Fullerton, CA) is a new instrument that provides CBC and five-part DLC. Additionally, it provides automated detection of subpopulations of pathological cells, such as immature granulocytes and atypical lymphocytes. It uses the three-dimensional (3D) Volume, Conductivity, Scatter (VCS) technology to probe hydrodynamically focused cells. A helium–neon laser and multiangle light scattering analysis provide information about cellular internal structure, granularity and surface morphology.
Abbott Cell-DYN 4000 (Abbott Laboratories, Abbott Park, IL) is capable of providing 41 parameters, including fully automated reticulocyte and immature granulocyte count. It uses four-angle argon-laser light scattering (M.A.P.S.S. technology) and two-color fluorescence flow cytometry (two fluorescence emission laser optics) to perform automated leukocyte counts, reticulocyte count, and DLC analysis. Both hydrodynamically focused impedance
count and optical method are used for optimal erythrocyte and platelet size distribution analysis. Hemoglobin concentration is measured in a separate sample aliquot based on spectrophotometry. Immature granulocyte and variant lymphocytes are detected by a multiparameter, multiweighted discriminant function: This function generates a flag and reports a confidence fraction (i.e., the probability that these cells are classified correctly).
Sysmex XE-2100 (Sysmex Corporation, Japan) provides analysis of 32 parameters including simultaneous WBC, five-part DLC, human progenitor cell and reticulocyte analysis. Using flow cytometry with a semiconductor laser, RF, and dc measurements, this instrument analyzes the size and the structural complexity of cells. Selective dyes and reagent assist in differentiating the WBC, nucleated RBCs and reticulocyte. The RBC and platelet counts are measured using sheath flow dc detection method. Hemoglobin concentration is measured using a non-cyanide hemoglobin method.
The Bayer ADVIA 120 hematology system (Bayer Diagnostics, Tarrytown, NY) is an automated analyzer with four independent measurement channels. The peroxidase [PEROX and basophil-lobularity (BASO)] channels determine WBC and DLC count. Hemoglobin channel is used to measure HGB. The last channel is the RBC/PLT channel that provides information on platelet activation in addition to measuring PLT and RBC indices. This instrument measures the intensity of light scattered by platelets at low angles (2–38) to obtain cell volume/size data and high angles (5–158) for information on internal complexity. From these paired intensities the instrument computes platelet volume (MPV) and platelet component concentration on a cell-by-cell basis. The mean platelet component concentration (MPC) is indicative of platelet activation state. Mean platelet mass can also be computed from the MPV and MPC.
CONCLUDING REMARKS
This article discussed the basic principles of hematology with emphasis on humans. Enumeration of cell population
Table 2. Characteristics of Hematology Analyzersa
Instrument |
Beckman–Coulter LH 750 |
Abbott Cell-Dyn 4000 |
Sysmex XE-2100 |
Bayer ADVIA 120 |
|
|
|
|
|
Number of parameters |
28 |
41 |
32 |
30 |
HGB |
Modified |
Spectrophotometry |
Non-cyanide |
Modified |
|
cyanmethemoglobin |
|
hemoglobin method |
cyanmethemoglobin |
|
method |
|
|
method |
Platelet |
VCS |
Optical method |
Hydrodynamic |
Light scattering |
|
|
and impedance count |
focusing with dc detection |
|
RBC |
VCS |
Impedance count |
Hydrodynamic |
Light scattering |
|
|
and optical method |
focusing with dc detection |
|
WBC and DLC |
Five-part |
Five-part DLC Light |
Five-part DLC |
Five-part DLC |
|
DLC VCS technology |
scatter and fluorescence |
Flow cytometry, |
Peroxidase staining optics |
|
|
flow cytometry |
RF and dc detection |
system, light scattering |
Reticulocyte Count |
New Methylene |
Fluorescent dye |
Auramine O staining, |
Oxazin 750 staining |
|
blue staining and VCS |
CD4K530 staining |
light scattering, |
and optical scatter |
|
|
and flow cytometry |
flow cytometry |
|
aAdapted from Ref. 3.