

33.Simpson PC, et al. High-throughput genetic analysis using microfabricated 96-sample capillary array electrophoresis microplates. Proc Nat Acad Sci USA 1998;95:2256–2261.
34.Chiem N, arrison HDJ. Microchip-based capillary electrophoresis for immunoassays: analysis of monoclonal antibodies and theophylline. Analyt Chem 1997;69:373–378.
35.Li PCH, Harrison DJ. Transport, manipulation, and reaction of biological cells on-chip using electrokinetic effects. Analyt Chem 1997;69:1564–1568.
36.Cabrera CR, Yager P. Continuous concentration of bacteria in a microfluidic flow cell using electrokinetic techniques. Electrophoresis 2001;22:355–362.
37.Kremser L, et al. Capillary electrophoresis of biological particles: Viruses, bacteria, and eukaryotic cells. Electrophoresis 2004;25:2282–2291.
38.Priego-Capote F, Castro MDLd. Dual injection capillary electrophoresis: Foundations and applications. Electrophoresis 2004;25:4074–4085.
39.Debesset S, et al. An AC electro-osmotic micropump for circular chromatographic applications. Lab Chip 2004;4:396–400.
40.Glasgow I, et al. Electro-osmotic mixing in microchannels. Lab Chip 2004;4:558–562.
41.Hofmann O, Che D, Cruickshank KA, Muller UR. Adaptation of capillary isoelectric focusing to microchannels on a glass chip. Analyt Chem 1999;71:678–686.
42.Tan W, Fan ZH, Qiu CX, Ricco AJ, Gibbons I. Miniaturized capillary isoelectric focusing in plastic microfluidic devices. Electrophoresis 2002;23:3638–3645.
43.Shimura K. Recent advances in capillary isoelectric focusing: 1997–2001. Electrophoresis 2002;23:3847–3857.
44.Kilar F. Recent applications of capillary isoelectric focusing. Electrophoresis 2003;24:3908–3916.
45.Simpson DC, Smith RD. Combining capillary electrophoresis with mass spectrometry for applications in proteomics. Electrophoresis 2005;26:1291–1305.
46.Schmitt-Kopplin P, Frommberger M. Capillary electrophor- esis-mass spectrometry: 15 years of development and applications. Electrophoresis 2003;24:3837–3867.
47.Sung W-C, Makamba H, Chen S-H. Chip-Based microfluidic devices coupled with electrospray ionization-mass spectrometry. Electrophoresis 2005;26:1783–1791.
48.Smyth WF. Recent applications of capillary electrophoreiselectrospray ionization-mass spectrometry in drug analysis. Electrophoresis 2005;26:1334–1357.
49.Simo C, Barbas C, Cifuentes A. Capillary electrophoresis-mass spectrometry in food analysis. Electrophoresis 2005;26:1306– 1318.
50.Shamsi SA, Miller BE. Capillary electrophoresis-mass spectrometry: Recent advances to the analysis of small achiral and chiral solutes. Electrophoresis 2004;25:3927–3961.
51.Zamfir A, Peter-Katalinic J. Capillary electrophoresis-mass spectrometry for glycoscreening in biomedical. Electrophoresis 2004;25:1949–1963.
52.Senk P, Kozak L, Foret F. Capillary electrophoresis and mass spectrometry for screening of metabolic disorders in newborns. Electrophoresis 2004;25:1447–1456.
53.IV WRV, Pasas-Farmer SA, Fischer DJ, Frankenfeld CN, Lunte SM. Recent developments in electrochemical detection for microchip capillary electrophoresis. Electrophoresis 2004; 25:3528–3549.
54.Qiu H, Yan J, Sun X, Liu J, Cao W, Yang X, Wang E. Microchip capillary electrophoresis with an integrated indium tin oxide electrode-based electrochemiluminescence detector. Analyt Chem 2003;75:5435–5440.
55.Wolters AM, Jayawickrama DA, Webb AG, Sweedler JV. NMR detection with multiple solenoidal microcoils for continuous-flow capillary electrophoresis. Analyt Chem 2002;74:5550–5555.
CO2 ELECTRODES |
109 |
56.Gale BK, et al. A micromachined electrical field-flow fractionation (mu-EFFF) system. IEEE Trans Biomed Eng 1998;45(12):1459– 1469.
57.Gale BK, et al. Geometric scaling effects in electrical field flow fractionation. 1. Theoretical analysis. Analyt Chem 2001;73 (10):2345–2352.
58.Gale BK, et al. Geometric scaling effects in electrical field flow fractionation. 2. Experimental results. Analyt Chem 2002;74(5):1024–1030.
59.Gale BK. Novel techniques and instruments for field flow fractionation of biological materials. Abstr Papers Am Chem Soc 2003;225:U138–U138.
60.Gale BK. Miniaturized field flow fractionation systems. Abstr Papers Am Chem Soc 2004;227:U116–U116.
61.Edwards TL, et al. A microfabricated thermal field-flow fractionation system. Analyt Chem 2002;74(6):1211–1216.
62.Schimpf ME, Polymer analysis by thermal field-flow fractionation. J Liquid Chromatogr Related Technol 2002;25 (13-15):2101–2134.
63.Janca J. Micro-channel thermal field-flow fractionation: Highspeed analysis of colloidal particles. J Liquid Chromatogr Related Technol 2003;26(6):849–869.
64.Janca J, Ananieva IA. Micro-thermal field-flow fractionation in the characterization of macromolecules and particles: Effect of the steric exclusion mechanism. E-Polymers 2003.
65.Janca J, et al. Effect of channel width on the retention of colloidal particles in polarization, steric, and focusing microthermal field-flow fractionation. J Chromatogr A 2004;1046 (1-2):167–173.
66.Bargiel S, et al. A micromachined system for the separation of molecules using thermal field-flow fractionation method. Sens Actuators A-Phys 2004;110(1-3):328–335.
67.Edwards TL. Microfrabricated acoustic and thermal field-flow fractionation systems. Electrical and computer engineering. Atlanta, GA: Georgia Institute of Technology; Ph.D. thesis, 2005. p 300.
See also ANALYTICAL METHODS, AUTOMATED; PHARMACOKINETICS AND PHARMACODYNAMICS; TRACER KINETICS.
CO2 ELECTRODES
JOHN W. SEVERINGHAUS
University of California in San
Francisco
San Francisco, California
METHODS OF MEASURING BLOOD pCO2 BEFORE DISCOVERY OF THE pCO2 ELECTRODE
Bubble Equilibration Methods
Carbon dioxide in blood is largely in the form of the bicarbonate ion, which could be converted to CO2 gas by adding acid and extracting the gas in a vacuum. The concept of partial pressures gradually stimulated interest in measuring pCO2 in the late nineteenth century. Gas analysis had been developed earlier, so the first method was to equilibrate a small gas bubble with a large volume of blood sample at body temperature, and then remove the bubble for gas analysis. Pflu¨ ger developed a tonometer for this purpose in the 1870s, and August Krogh used this
110 |
CO2 ELECTRODES |
method in fish in the early twentieth century. It was developed into a clinical and laboratory method by Richard Riley, using a specially adapted syringe with a capillary attached, which was invented by F. J. W. Roughton and P. Scholander during World War II. Riley’s bubble method worked well for pCO2, but poorly for pO2 especially when blood was saturated with oxygen.
The Henderson–Hasselbalch Method
The most accurate early method was made possible by L. J. Henderson’s discovery of buffering and his equation in 1908, its logarithmic modification by K. A. Hasselbalch in 1916, and P. T. Courage’s design of a glass pH electrode (1925) in which blood could be measured with little loss of CO2 to air. Blood pH was determined, usually at room temperature, there being no thermostated electrodes, and the Rosenthal temperature correction ( 0.0147 pH units/ 8C) was used to compute pH at 37 8C. Plasma CO2 content was determined in the Van Slyke manometric apparatus that used 1 mL of plasma (after carefully centrifuging blood under a gas tight seal, a floating cork). This method reached a precision of 0.3 mmHg pCO2 in studies of the arterial to alveolar pCO2 difference during surgical hypothermia at The National Institute of Health (NIH) (5).
Astrup and The Equilibration Method
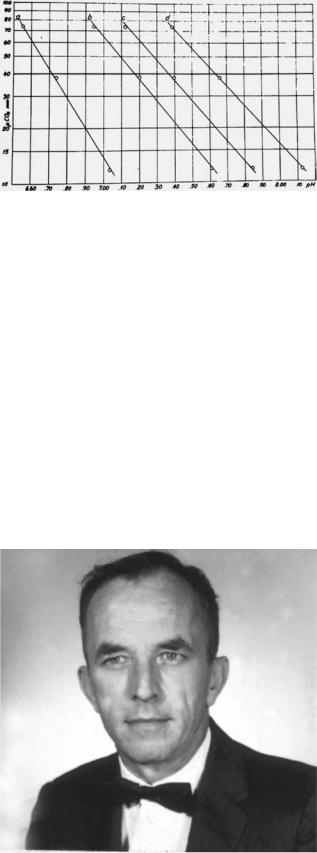
Hundreds of patients with polio needed artificial ventilation in the communicable disease hospital in Copenhagen during epidemics in 1950–1952. Poul Astrup, M.D. (Professor of Clinical Chemistry, University of Copenhagen, Copenhagen, Denmark, and Director of the Clinical Laboratory, Rigshospitalet, Copenhagen, Denmark) and his associates, particularly Ole Siggaard Andersen, Ph.D., M.D. (Professor of Clinical Chemistry, University of Copenhagen, and Director, Clinical Chemistry Laboratory, Herlev Hospital, Copenhagen, Denmark), devised a way of determining blood pCO2 using only a pH electrode to measure pH before and after equilibration of a blood sample with two known concentrations of pCO2(6). Astrup made use of the little known fact that, as pCO2 is changed, the relationship of pH to pCO2 in a given blood sample is semilogarithmic (Fig. 1). By plotting the two measured values of pH at the known equilibrated pCO2, he could graphically interpolate the pCO2 from the original sample pH.
From 1954 until the mid-1960s, Astrup’s method was made widely available by the Radiometer Co. of Copenhagen. The device had a thermostated capillary pH electrode, reference electrode, and tiny shaking equilibrator through which humidified gas flowed. Astrup’s apparatus and method became obsolete with the introduction of the CO2 electrode.
Ole Siggaard Andersen, Astrup, and others used the values obtained for pH and pCO2 to calculate bicarbonate, total CO2, and base excess, a term they introduced as a quantitative measure of the nonrespiratory or metabolic abnormality in a whole blood sample. Base excess proved to be the first accurate index of the nonrespiratory component of acid–base balance (7). Its first application was only for blood, but by 1966, it was shown to apply to the extracellular fluid of the entire body if one assumed an average extracellular fluid hemoglobin concentration of 5 g/dL.
Figure 1. Equilibration method for measuring arterial pCO2 introduced by Astrup during the Copenhagen polio epidemic, 1952–1954. Log pCO2 plotted versus pH results in straight lines with varying pCO2, and shifts of pH and slope when blood is acidified or alkalinized. The shift gave rise to the concept of base excess.
THE CO2 ELECTRODE
History
A carbon dioxide (CO2) electrode was first described by physiologists Gesell and McGinty at the University of Michigan in 1926, for use in expired air, but not in blood
(8). It used the effect of CO2 on the pH of a film of peritoneal membrane wet with a salt solution. Their paper was rediscovered 40 years later by M. Laver at Massachusetts General Hospital who informed Trubohovich of this effect (9).
In August 1954, Richard W. Stow, Ph.D. (Associate Professor of Physical Medicine, Ohio State University, Columbus, Ohio) (Fig. 2), a physical chemist, reported the design of a CO2 electrode at the fall meeting of the American Physiologic Society in Madison, Wisconsin (10).
Figure 2. Richard Stow, invented the CO2 electrode in 1954 to assist in managing polio patients on ventilators (10).
CO2 ELECTRODES |
111 |
Figure 3. Stow’s sketch of his 1954 CO2 electrode. (a) Cable connection enclosure. (b) Rubber membrane. (c) Retaining O ring. (h) Chamber for internal pH electrolyte. (j) Reference electrode of silver chloride, not in contact with internal electrolyte, but opening to exterior through port K.
The polio epidemic was raging at the time, and as part of the physical therapy faculty he had sought some way to measure pCO2 in the victims. He read in the library about specific ion electrodes, and conceived the electrode idea. He had wrapped a thin rubber membrane wet with distilled water over a homemade combined pH and reference electrode (Fig. 3). When he changed gas pCO2 outside the device, the pH inside changed as a log function of gas pCO2. However, he was unable to get stable readings and said he doubted it could be made useful.
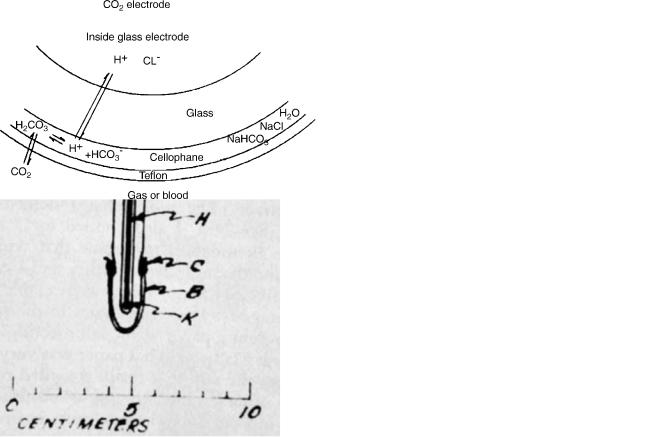
After his talk, Severinghaus asked him why he did not try adding sodium bicarbonate (NaHCO3) to the water film in the electrode. He replied that he believed this would abolish the signal because bicarbonate would buffer the effect of pCO2 on pH. Severinghaus replied that he was confident that bicarbonate would not block the sensitivity. Stow agreed that Severinghaus would further investigate this idea. In September, 1954, after returning from Madison to the National Institutes of Health, Severinghaus confirmed the advantage of adding bicarbonate ions. A schematic diagram of his modification of Stow’s electrode is shown in Fig. 4. He used a Beckman bulb-type pH electrode, a chloride-coated silver wire reference, and a Beckman pH meter. He tied a film of cellophane over the
Figure 4. The concept of a pCO2 electrode. The pH sensitive surface of a pH glass electrode is covered by a layer of electrolyte (here in cellophane), and then by a thin layer of a membrane permeable to CO2, but not to hydrogen ions (here Teflon). The pH in that film is controlled by the partial pressure of CO2 on the outside of the outer membrane as CO2 dissolves and reacts with water to form carbonic acid. The carbonic acid dissociates into hydrogen and bicarbonate ions. Because the electrolyte has 5–20 mM HCO3 ions, changes of pCO2 have no measurable effect on HCO3 . The mass law then requires Hþ to change in direct proportion to change in pCO2. A doubling of pCO2 doubles Hþ concentration, which is seen as a 0.3 pH unit fall.
pH electrode soaked in 25 mM NaHCO3 and then covered the entire tip with a thin rubber dam, later from a surgical glove. The bicarbonate not only made the device stable, but doubled the pCO2 sensitivity compared with an electrolyte of distilled water (or 1% NaCl). Salt was added to help stabilize the silver chloride reference electrode.
In 1957, Stow. Baer and Randall (11) published their discovery of the CO2 electrode without mentioning the need to add bicarbonate ion, and took no further interest in this idea. Stow had no interest in a patent, thinking it would distract him from his job, and also because his university only allowed inventors 10% of royalties. As a U.S. government employee, Severinghaus was not permitted to patent it, certainly not with a reluctant coinventor.
Severinghaus and co-worker A. Freeman Bradley proceeded to investigate and optimize the electrode design and to test its performance, linearity, drift, and response time. They constructed electrodes for laboratory use by several colleagues, but unfortunately made no attempt at commercial development for 4 years.
Between 1958 and 1960 several other investigators constructed and published similar CO2 electrodes, in several instances without being aware of the Stow–Severinghaus electrode (12–14).
CO2 ELECTRODE DESIGN DETAILS
A CO2 electrode consists of a slightly spherical surfaced glass pH electrode and a silver chloride reference electrode. Both are mounted in a glass or plastic sleeve holding a Teflon or silicone rubber membrane, typically 12 mm thick, over the glass surface, in some cases with a spacer of very thin lens-cleaning paper between membrane and glass to

112 |
CO2 ELECTRODES |
Figure 5. Cuvette with blood inlet and outlet connections in a thermostated water jacket made for the Stow–Severinghaus pCO2 electrode (National Welding Co, San Francisco, 1959).
insure a uniform distribution of the electrolyte that is NaCl or KCl with 5–20 mequiv/L of NaHCO3. For use in blood, the electrode is mounted in a 37 8C cuvette into which a small sample of blood can be injected (typically 50 mL) (Fig. 5).
The electrode output voltage is a logarithmic function of pCO2, 60 mV for a 10-fold change of pCO2, which induces a pH change of 1 pH unit. Sensitivity is defined as D pH/ D log pCO2, where S reaches nearly the ideal maximum value of 1.0 with HCO3 concentrations of 5–25 mM (Fig. 6). At higher bicarbonate levels, carbonate acts as a buffer, and reduces both sensitivity and speed of response. Response is faster at lower bicarbonate concentration, but carbonic acid pK’ is 6.1, resulting in some change of bicarbonate as pCO2 changes, reducing sensitivity. As bicarbonate concentration is lowered, sensitivity falls to 30 mV/decade pCO2 change, or S ¼ 0.5, at zero bicarbonate.
The log response is almost linear from 5 to 700 mmHg pCO2. The response time to a step change of pCO2 is exponential with a 95% response time of 30 s, depending on the membrane thickness and material, bicarbonate ion concentration and the thickness of the electrolyte layer over the glass electrode surface. It can be made to respond
in < 1 s by using thin silastic (silicone rubber) membrane, low bicarbonate concentration (i.e., 1 mequiv/L), and adding carbonic anhydrase to the electrolyte, but the downside is loss of stability and signal amplitude.
The CO2 electrode is usually calibrated to read in millimeters of mercury. It reads the same value for gas and liquid equilibrated with that gas at the electrode temperature, usually 37 8C.
A useful test of a leaking membrane is to equilibrate a dilute solution (e.g., 1 mequiv/L) of HCl, or lactic acid with a known calibration gas, and test its reading. Any leak will permit acid entry and an erroneously high pCO2.
Maintenance requires replacement of the membrane and electrolyte when errors are detected or when drift has driven the electrode beyond the ability of the apparatus to compensate its potential. The pH glass may become so impermeable to hydrogen ions that it shows low sensitivity or slow response after years of use.
The amplifier circuit must be electrically isolated from the ground because any ground path leakage will draw current through the silver chloride reference and changes
its potential causing drift. The input impedance of all modern pH and pCO2 meter amplifiers is >1011 V.
The Combined Blood Gas Analysis Apparatus
In 1956, Leland Clark disclosed his invention of the oxygen electrode at a meeting in Atlantic City to which Severinghaus had invited physiologists interested in measuring pO2. That invention made a huge difference in blood gas analysis.
While Severinghaus completed his anesthesia residency at the University of Iowa, with help from the physiology workshop, he constructed a thermostat into which he mounted both the Stow–Severinghaus CO2 electrode and the Clark O2 electrode in a stirred cuvette with a small blood tonometer. That apparatus was exhibited at the meeting of the American Society of Anesthesiologists in October 1957 and at the meeting of the Federation of American Societies of Experimental Biology in Atlantic City in the spring of 1958 and published in 1958 (15) (Fig. 7).
Figure 6. The first blood gas apparatus, with the Clark pO2 |
|
electrode (below) in a stirred cuvette, and the Stow– |
Figure 7. The first three-function blood gas analyzer, using a |
Severinghaus pCO2 electrode above, tilted to keep the internal |
McInnes Belcher pH electrode (1930) with the pCO2 and pO2 |
air bubble of the pH electrode away from the tip (1957). |
electrodes in a 37 8C bath. |

The Three-Function Blood Gas Analyzer
In 1958, after moving from the National Institutes of Health to the University of California, San Francisco, Severinghaus and Bradley added a pH electrode to the blood gas electrode waterbath, making the first threefunction blood gas apparatus (Fig. 8). Forrest Bird, Ph.D., M.D. (President, Bird Corporation, Palm Springs, California) had designed popular positive-pressure ventilators, manufacturing them at the National Welding Co. in San Francisco. He proposed to manufacture the CO2 electrode and to make it commercially available. From 1959–1961 the National Welding Co. sold the only available pCO2 electrode. The design concept was soon copied and marketed by Beckman, Radiometer, Instrumentation Labs and later by several other firms.
Impact of Blood Gas Analysis
During the 1960s, blood gas analysis became widely available in anesthesia, intensive and critical care facilities, and cardiorespiratory research laboratories. For several years, the Severinghaus paper (15) was among the most quoted articles in biologic literature, and blood gases were called the most important laboratory test for critically ill patients. Blood gas apparatus now uses automatic selfcalibration and automatic transport of sample and washing of cuvettes, printing of results, and often sending the values to remote terminals. In the United States, regulations have been used by pathologists to require that these automated instruments can only be used by licensed technicians, usually meaning that the income flows to pathologists. Gone are the days when students, nurses, residents, and faculty all took part in doing blood gas analysis.
A more complete history of the CO2 electrode and related blood gas technology is available in References (9,16).
Figure 8. Relationship of pCO2 electrode sensitivity to its internal electrolyte bicarbonate ion concentration. Maximum sensitivity occurs at 20 mM HCO3 , but for faster response, most electrodes operate at 5–10 mM.
CO2 ELECTRODES |
113 |
HISTORY AND THEORY OF TRANSCUTANEOUS BLOOD OXYGEN MONITORING
From 1951 to 1952, the discovery of oxygen related blindness in premature infants created an urgent need for continuous noninvasive monitoring of blood oxygen. A new solution to the problem came from physiologists studying skin respiration. Human skin breathes, taking up oxygen and giving off CO2 to the air. If skin is covered (as by a flat unheated pCO2 electrode) the surface tcpO2 falls to zero in a few minutes. However, in 1951 Baumberger and Goodfriend showed that if skin blood flow is greatly increased by the highest tolerable heat (45 8C), the surface pO2 rises to about paO2 (arterial blood) (17).
Within a year after Clark’s invention of the membrane covered platinum polarographic electrode (18,19), Rooth used polarography to confirm the Baumberger report (20). Researchers tried unsuccessfully to use chemical vasodilators to make skin pO2 a monitor of paO2. Kwan and Fatt (21) noted that pO2 of the palpebral conjunctiva measured with an unheated tiny Clark electrode mounted facing outward on a contact lens over the cornea simulated paO2. This device was briefly marketed a decade later, but discontinued due to the danger of infection.
In Marburg, Germany, Professor of Physiology Dietrich Lu¨ bbers and students, especially Renate Huch, pursued the concept of heating the skin under an oxygen electrode by heating the electrode itself to as high as 45 8C. They were joined by Patrick Eberhard, and the group soon found ways of making electrically heated, thermostated oxygen surface electrodes. By 1972, they had shown a good relationship between heated skin and arterial blood pO2 in infants (22). Several firms began to design electrodes for this purpose.
DEVELOPMENT OF METHODS AND UNDERSTANDING OF THEORY
By 1977, the Marburg group had published at least 11 papers documenting the validity of transcutaneous oxygen measurement. At least three commercial tcpO2 electrode systems were available (Helige, Roche, Radiometer). In November 1977, some 18 research teams joined for a workshop on transcutaneous blood gas methods in San Francisco, assessing the theory, problems, possibilities, and progress (23–30). The following summer (1978) many of these workers joined the Marburg team and others for the first international congress on transcutaneous blood gas monitoring, establishing the technology as an essential tool in neonatology and as useful in many other fields (31,32).
The agreement of tcpO2 with paO2 proved to be a cancellation of two opposing effects illustrated in Fig. 9 (27,33).
1.Heating of desaturated blood raises its pO2 by 7%/8C, or 50% at 43 8C, but in saturated blood, as in water, pO2 rises only 1.3%/8C (35);
2.Skin metabolism at the high temperature consumes
O2 as it diffuses outward from capillaries through living cells, reducing the value to about paO2.
114 |
CO2 ELECTRODES |
Figure 9. A schema of the effect of both heating of skin surface by a transcutaneous electrode, and of local metabolism, on the tissue internal oxygen tension from the arteries out past the capillaries and the living and dead epidermis to the surface, and through the electrode membrane into the cathode that keeps its surface pO2 ¼ 0 by its electrical negative potential (39).
The outward oxygen diffusion is facilitated by heat that proved to ‘‘melt’’ some skin diffusion barriers (33,36). Skin O2 conductivity C (adult volar forearm) was determined by two groups by comparison of flux with two membranes (teflon and mylar) of very high and low conductivity. With a large gold cathode Clark electrode, C ¼ 15 nL cm 2 s 1
atm 1(37) and with a mass spectrometer C ¼ 10 nL cm 2 s 1 atm 1(38).
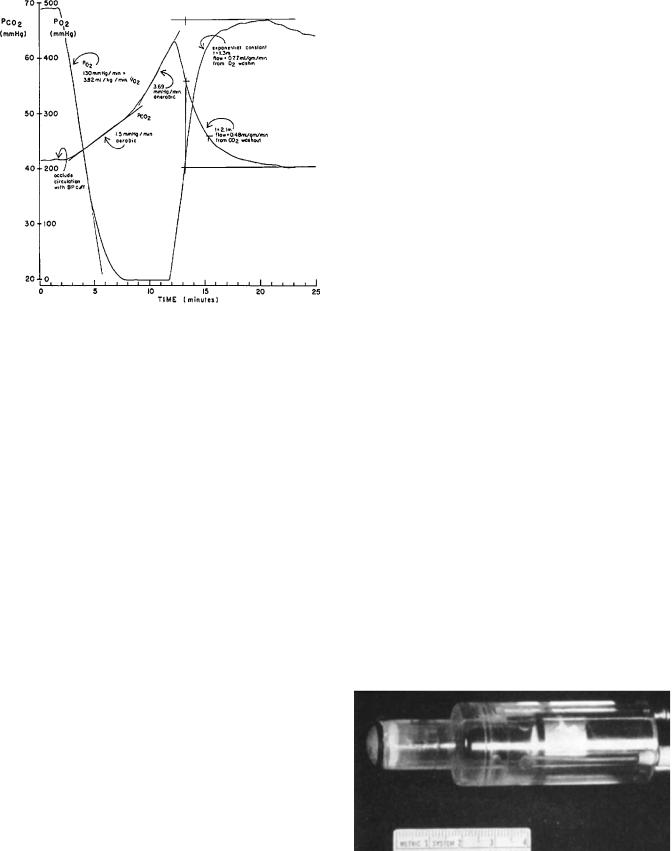
Skin O2 consumption (VO2) was determined after thermal vasodilation by the rate of fall of tcpO2 with circulatory occlusion (arm cuff) (Fig. 10) (27). Relative skin blood flow under the heated electrode was estimated by measuring the required heating power (39). Analysis of data collected at two levels of pO2 and two temperatures permitted calculation of blood flow, capillary temperature under a heated electrode, and diffusion gradient from capillary to surface (40). Mean adult volar forearm skin VO2 was
4.2 |
|
0.4 mL g 1 min 1 at 44 8C and 2.8 0.3 mL g 1 min 1 |
|||||
at |
37 |
C. At 44 |
C, skin blood flow averaged 0.64 |
0.17 mL |
|
||
1 |
|
8 |
1 |
8 |
|
||
g |
|
min , capillary temperature was 43 8C and the diffusion |
|||||
gradient was 32 |
7 mmHg. |
|
|
||||
TRANSCUTANEOUS CO2
In 1959, Severinghaus constructed a 37 8C thermostated open tipped CO2 electrode to determine pCO2 of various tissue surfaces in animals (Fig. 11) (41). Without heating the skin well above body temperature, skin pCO2 at 37 8C climbed steadily over one-half of an hour to > 80 mmHg. Dog intestinal mucosa and liver surfaces were very high.
Fifteen years later, the success in transcutaneous measurement of oxygen led to design and testing of electrodes to measure tcpCO2 by Beran et al. (42,43), Huch et al. (44) and Severinghaus et al. (45,46). Combined tcpO2–tcpCO2 electrodes were initially described by Parker et al. (47) and
Figure 10. The time course of skin pO2 and pCO2 on an arm after sudden circulatory occlusion with a blood pressure cuff. The rate of fall of pO2 from a high level is a measure of the skin metabolic rate. The pCO2 rises at first from metabolic CO2 production, but later at a steeper rate as skin generates lactic acid when skin pO2 reaches zero. With release of occlusion, the electrode recovery time is delayed by both the skin washin and washout, and by electrode equilibration (34).
Severinghaus (48). Figure 12 schematically shows the internal design of an early Radiometer combined electrode. Figure 13 shows the electrode with a membrane mounted.
When a heated combined pO2–pCO2 electrode is first attached to skin, the time needed to equilibrate is 5 min for both electrodes, although the pO2 electrode may show later small changes as thermal vasodilation slowly develops (Fig. 14). The response to step changes in alveolar and arterial pCO2 is slower as seen in Fig. 15. Here the response is delayed both by the washout or washin of CO2 into the tissue by blood flow, and the electrode’s own delay. The response is pseudoexponential, a combination of the two delays, resulting in a 95% response times of 10 min.
Without correction, tcpCO2 is not similar to paCO2. Heating of blood (and water) raises pCO2 4.6%/8C
Figure 11. The first tissue surface pCO2 electrode (41) with a circulating temperature controlled water jacket.
CO2 ELECTRODES |
115 |
Figure 12. Schema of the design of a combined tcpO2–tcpCO2 electrode. (a) pO2 cathode, the end of a 12 mm platinum wire fused in glass. (b) A silver wire reference electrode. (c) pH glass electrode surface. (d) solid silver internal pH electrode (used to improve heat transfer to skin). (e) Internal pH electrolyte.
(f) Heater Zener diode. (g) Thermistor. (h) Silver body, and reference electrode. J, K, L, M: O rings. N: Lexan jacket. Q: epoxy. P: Cable (48).
Figure 14. Initial responses of a combined pO2–pCO2 electrode when first mounted on skin. Both electrodes need 5 min to equilibrate, the pO2 showing a small late rise as skin hyperemia develops from the heating (49).
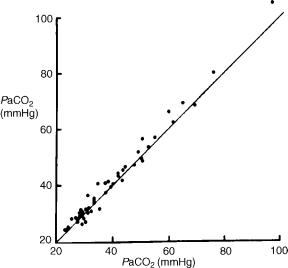
(41), metabolism adds 3 mmHg pCO2, and the cooling by skin and blood of the electrode surface further raises the electrode reading. The effect of heating on blood pCO2 may be computed as DpCO2 ¼ exp(0.046[T – 37]) (51). The net effect at 43 8C was found to be tcpCO2 ¼ 1.33paCO2 þ 4 mmHg (48,52) or tcpCO2 ¼ 1.4paCO2 (53). This form of temperature-dependent correction factor was later incorporated in most commercial transcutaneous blood gas monitoring apparatus.
With this correction factor, the relationship of tcpCO2 to paCO2 is excellent, as shown in Fig. 16. The previous correction factors appear to have become incorrect for a second generation of the Radiometer tcpCO2 electrodes, due to a design change in the internal temperature coefficient of the glass pH electrode. The additive factor of 4 mmHg changed to 8 mmHg in the newer instruments (Kagawa S, personal communication).
Although tcpCO2 appears to work at 42–43 8C, Tremper et al. showed that 44 8C was a better temperature when
Figure 13. Photograph of combined pO2–pCO2 electrode with teflon membrane (48).
Figure 15. Transcutaneous pCO2 electrode response to a step increase of ventilation adjusted by the subject to reduce end tidal pCO2 suddenly from 40 to 20 mmHg and hold it at a constant level for 18 min, followed by addition of enough CO2 to inspired gas to raise end tidal pCO2 as quickly as possible to 50 mmHg. The response time constants (63%) are 5 min (45).
116 |
CO2 ELECTRODES |
Figure 16. Transcutaneous pCO2 correlates well with arterial pCO2 in patients during anesthesia or intensive care (48).
blood pressure was or had been low (54). The tcpCO2 value was better than the PETCO2 value (end-tidal or end-expired air) in predicting paCO2 (bias and s.d. 1.6 4.3 mmHg) in anesthetized adults (n ¼24) (55).
A special advantage of tcpCO2 is that it averages out breath-by-breath variations, and has almost no inherent ‘‘noise’’ or variability, such that it often is found to be the best trend monitor for detecting small changes in paCO2 such as those induced by experimental variations (anesthesia, ventilatory settings, posture, FIO2, FICO2, blood pressure, pharmacologic agents, etc).
APPLICATIONS
Transcutaneous technology is used in many ways, some of which are discussed in accompanying papers:
1.Neonatology: Guidance of O2 therapy remains the most common use of transcutaneous monitoring (56–58). The suspected etiologic role of hyperoxia
(tcpO2 >80 mmHg) in retinitis of premature infants has been confirmed in a cohort study (59). The tcpO2 value can be measured above and below the ductus to demonstrate closure (60). In low birth weight
infants, tcpCO2 (at 40 8C!) is the best available monitor of ventilation (61).
2.Fetal Monitoring: Using specially designed electrodes attached to the fetal scalp, intrapartum monitoring revealed some important new pathophysiologic
understanding (62–65). As hoped, changes in tcpO2 rapidly reflected changing maternal and fetal condi-
tions (66). The tcpO2 value fell and tcpCO2 rose with contractions during the second stages of labor (67).
The tcpCO2 value closely followed fetal paCO2(68). When there were signs of fetal distress, fetal scalp
tcpO2 was < 15 mmHg (69). Surprisingly, O2 administration to mothers with fetal distress did not alter
fetal pCO2 or raise pO2(70). During maternal hypocapnia, fetal tcpO2 fell due to the Bohr effect, whereas it rose during hypercapnia (71). Fetal tcpO2 was considered influenced by local scalp blood flow (72). Repeated episodes of asphyxia were reported to express catecholamines, which reduced blood flow to the fetal skin, artifactually reducing tcpO2(73,74). Fetal tcpCO2 may have failed to disclose severe acidosis or circulatory impairment (75).
3.Sleep Studies: Combined pO2–pCO2 electrodes are used in sleep studies in combination with pulse oximetry, because nostril sampling of end-tidal
pCO2 is somewhat annoying and more apt to become plugged or dislodged (76–83). The combined tcpO2– tcpCO2 electrode made it possible to show that the ventilatory response to induced mild hypoxia in sleeping infants changes with age from acute depression at 1–5 days, to stimulation at 4–8 weeks, and mild or no stimulation at 10–14 weeks (84). A method was designed for estimating the ventilatory response to CO2 during sleep using capnography and tcpCO2(79).
4.Peripheral Circulation: The tcpO2 electrodes are extensively used in evaluating arterial disease in the peripheral circulation (85–88). A test of adequacy of peripheral circulation, ‘‘initial slope index’’ (ISI) was suggested by Lemke and Lu¨ bbers (89). Blood flow is stopped by an arm cuff above the electrode and restarted when tcpO2 ¼0. The initial rate of rise should be a slope per min of at least 75% of the preocclusion tcpO2.
5.Skin Circulation: Monitoring the viability of skin after injury or transplant or flap movement (90,91).
6.Ventilatory Control: In intensive care, transcutaneous electrodes greatly increased the safety and simplicity of PEEP optimization and respiratory management of adults with respiratory distress syndrome (92). They are widely used simply to reduce arterial blood sampling.
7.Hyperbaric Oxygen: Monitoring and guiding hyperbaric oxygen therapy, primarily for infections and
wound healing (93,94). The tcpO2 tracked paO2 up to 4-atm hyperbaric pressure in normal subjects
(95). Surprisingly, no one has reported using tcpO2 in hyperbaric treatment of CO poisoning despite the demonstration by Barker and Tremper in experi-
mental CO administration that transcutaneous pO2 falls linearly as COHb increases, and reaches about one-fifth of its initial value at the highest COHb levels despite the maintenance of constant arterial
pO2(96). It is thus unknown whether HBO can normalize tissue pO2 in the presence of high levels of COHb.
8.Clinical Physiology: Transcutaneous monitoring has found use in exercise tolerance studies (97,98). End-
tidal CO2 is not exactly equal to paCO2 and the difference between them varies with posture and inspired oxygen concentration. When testing hypoxic
ventilatory responses by monitoring PETCO2, tcpCO2 helps to correct these small errors (99).
9.Pharmacologic Research: Transcutaneous monitoring may be the simplest monitor of the depressant effects of opiates, sedatives, and anesthetics especially in awake children (100).
10.Animal Studies: Intestinal or other tissue animal experimental ischemia has been found to be better detected by the rise of the organ or tissue surface
pCO2 using tcpCO2 electrodes at body temperature than by gastric tonometry (101). Both tcpO2 and tcpCO2 have been widely used in small and large animal studies (102) and to assess the effect of cardiopulmonary resusitation (CPR) (103).
ACCURACY
With the widespread use of tcpO2 and tcpCO2 came concern about its accuracy and the possible sources and effects of errors, especially with severe hypotension (28,104). Peabody et al.(25) identified two groups of infants in whom tcpO2 was lower than paO2. These were infants receiving an intravascular infusion of tolazoline and infants with mean arterial blood pressures >2.5 s.d. below the predicted average value. Vasoconstrictors also lower tcpO2(105). Both of these situations represent extreme alterations in peripheral blood flow. Mild hypotension, hypothermia, anemia, radiant warmers, and bilirubin lights did not adversely affect transcutaneous accuracy (106). In a large multiinstitutional study of 327 patients older than 1 month, when paO2 was between 80 and 220 mmHg, Palmisano found the mean bias s.d. of tcpO2 was 43 40 mmHg, and the slope of the regression was 0.65 (107). It was determined that tcpCO2 correlated far better with paCO2: R ¼0.929, slope 1.052, bias and s.d. ¼1.3 4.0 mmHg (n ¼756).
Defining a tcpO2 index as tcpO2/paO2, Tremper and Shoemaker (108) studied the effect of shock. For 934 data sets taken on 92 patients not in shock, there was a correlation coefficient (r) of 0.89 and a tcpO2 index 0.79 0.12 (SD). In five patients with moderate shock, the r was 0.78 and the tcpO2 index was 0.48 0.07. In nine patients with severe shock, there was no correlation between tcpO2 and paO2 and the tcpO2 index was 0.12 0.12.
LIMITATIONS
Skin burns may occur after an electrode has been in one place over several hours at 44–45 8C, and sometimes even at 43 8C. Long-term monitoring requires site changes, or a dual electrode alternating system (109). There may be problems with drift of calibration, membrane failure, partial loss of skin contact giving errors in both O2 and CO2 readings. Maintenance of these electrodes requires training and some technical proficiency.
IMPACT OF PULSE OXIMETRY
Pulse oximetry came into widespread use in 1985–1987, and quickly replaced transcutaneous blood gas analysis in many situations. However, after an initial switch to
CO2 ELECTRODES |
117 |
oximetry, neonatologists found that oximetry failed to detect hyperoxia adequately (110) and now mostly use both technologies (111–115). In neonatology, a significant problem is that the inherent errors of pulse oximetry are 3%, which could fail to warn of paO2 >80 unless a set point of90% SpO2 is chosen (116). Some have arbitrarily dismissed transcutaneous monitoring as ‘‘. . .plagued by technical problems, . . .Its use in efforts to prevent retinopathy of prematurity, an eye disease of preterm newborns often leading to blindness, proved disappointing’’ (117). To them, the transcutaneous field served as a model of problems in medical innovation, new technology, and personnel training. Not everyone agrees with this pessimism. Most technical problems have been solved, and the occurrence of blindness in very premature infants is now believed to be multifactorial, not just due to hyperoxia. Therefore when it occurs, it is not appropriate to attribute it to failed transcutaneous methodology.
CONCLUSIONS
The enthusiasm for transcutaneous blood gas analysis of the period 1976–1986 was followed by a decrease due to the advent of pulse oximetry. The number of papers per year listing medline keywords ‘‘transcutaneous blood gas’’ reached an early peak of 75 in 1979, when the first international symposium was devoted to this field, in Marburg and 200 in 1987. However, after 1986 many papers used the keywords ‘‘transcutaneous blood gas’’ when writers meant to refer to pulse oximetry.
Transcutaneous technology is inherently somewhat complicated. Users must change membranes and calibrate, change skin sites periodically to avoid burns, beware of drift or error due to poor circulation or poor skin attachment, and take account of the slower response than given by oximetry. Nonetheless, transcutaneous blood gas measurement continues to be used because of its unique ability to meet many special situations needing its characteristics of noninvasively and continuously determining partial pressures of O2 and CO2. Several professional organizations have published guidelines for use of these monitors (118,119).
BIBLIOGRAPHY
1.Severinghaus JW. The current status of transcutaneous blood gas analysis and monitoring. Blood Gas news (Radiometer house organ) 1998;7:4–9.
2.Severinghaus JW. The Invention and Development of Blood Gas Apparatus. Anesthesiology 2002;97:253–256.
3.Severinghaus JW. Severinghaus electrode. In: JR Maltby, editor. Notable Names in Anaesthesia. London: Royal Society of Medicine Press Ltd.; 2002.
4.Severinghaus JW, Astrup P, Murray J. Blood gas analysis and critical care medicine. Am J Respir Crit Care Med 1998;157:S114–S122.
5.Severinghaus JW, Stupfel MA, Bradley AFJ. Accuracy of blood pH and pCO2 determinations. J Appl Physiol 1956;19: 189–196.
6.Astrup P. A simple electrometric technique for the determination of carbon dioxide tension in blood and plasma, total
118 |
CO2 ELECTRODES |
content of carbon dioxide in plasma and bicarbonate content in ‘‘separated’’ plasma at a fixed carbon dioxide tension. Scand J Clin Lab Invest 1956;8:33–43.
7.Siggaard-Andersen O, Engel K, Jorgensen K, Astrup P. A micro method for determination of pH, carbon dioxide tension, base excess and standard bicarbonate in capillary blood. Scand J Clin Lab Invest 1960;12:172–176.
8.Gesell R, McGinty DA. Regulation of respiration: VI. Continuous electrometric methods of recording changes in expired carbon dioxide and oxygen. Am J Physiol 1926;79:72–90.
9.Trubuhovich RV. History of pCO2 electrodes. Br J Anaesth 1970;42:360–362.
10.Stow RW, Randall BF. Electrical measurement of the pCO2 of blood (abstract). Am J Physiol 1954;179:678.
11.Stow RW, Baer RF, Randall B. Rapid measurement of the tension of carbon dioxide in blood. Arch Phys Med Rehabil 1957;38:646–650.
12.Gertz KH, Loeschcke HH. Elektrode zur bestimmung des CO2 drucks. Naturwissenschaften 1958;45:160–161.
13.Hertz CH, Siesjo B. A rapid and sensitive electrode for continuous measurement of pCO2 in liquids and tissue. Acta Physiol Scand 1959;47:115–123.
14.Snell FM. Electrometric measurement of carbon dioxide and bicarbonate ion. J Appl Physiol 1960;15:729–732.
15.Severinghaus JW, Bradley AF. Electrodes for blood pO2 and pCO2 determination. J Appl Physiol 1958;13:515–520.
16.Severinghaus JW, Astrup P. History of blood gas analysis. Int Anesthesiol Clin 1987;25:69–95.
17.Baumberger JP, Goodfriend RB. Determination of arterial oxygen tension in man by equilibration through intact skin. Fed Proc 1951;10:10.
18.Clark LC. Monitor and control of tissue O2 tensions. Trans Am Soc Artif Intern Organs 1956;2:41–48.
19.Clark LC, Clark EW. Personalized history of the Clark oxygen electrode. Inter Anesthesiol Clin 1987;25:1–30.
20.Rooth G, Sjostedt S, Caligara F. Bloodless determination of arterial oxygen tension by polarography. Sci Tools LKW Instr J 1957;4:37.
21.Kwan M, Fatt I. A noninvasive method of continuous arterial oxygen tension estimation from measured palperal conjunctival oxygen tension. Anesthesiology 1971;35:309–314.
22.Huch R, Lu¨ bbers DW, Huch A. Quantitative continuous measurement of partial oxygen pressure on the skin of adults and new-born babies. Pflu¨ gers Arch 1972;337:185–198.
23.Vesterager P. Transcutaneous pCO2 electrode. Scand J Clin Lab Invest 1977;37:27–30.
24.Friis Hansen B. Transcutaneous measurement of arterial blood oxygen tension with a new electrode. Scand J Clin Lab Invest 1977;37:31–36.
25.Peabody JL, Willis MM, Gregory GA, Tooley WH, Lucey JF. Clinical limitations and advantages of transcutaneous oxygen electrodes. Acta Anaesthesiol Scand Suppl 1978;68:76–82.
26.Tremper KK, Huxtable RF. Dermal heat transport analysis for transcutaneous O2 measurement. Acta Anaeshesiol Scand Suppl 1978;68:4–8.
27.Severinghaus JW, Stafford MJ, Thunstrom AM. Estimation
of skin metabolism and blood flow with tcPo2 and tcPco2 electrodes by cuff occlusion of the circulation. Acta Anaesth Scand Suppl 1978;68S:9–15.
28.Versmold HT, Linderkamp O, Holzmann M, Strohhacker I, Riegel KP. Limits of tcpO2 monitoring in sick neonates: Relation to blood pressure, blood volume, peripheraal blood flow and acid base status. Acta Anaesthesiol Scand Suppl 1978;S68:88–90.
29.Kimmich HP, Kreutzer F. Model of oxygen transport through skin as basis for absolute transcutaneous measurement of PaO2. Acta Anaesthesiol Scand Suppl 1968;S68:16–19.
30.Fatt I. Transmucosal measurement of blood pH at the palpebral conjunctiva. Acta Anaesthesiol Scand Suppl 1978;S68: 142–144.
31.Huch A, Huch R. The development of the transcutaneous pCO2 technique into a clinical tool. In: Huch R, Huch A, Lucey JR, editors. Continuous Transcutaneous Blood Gas Monitoring, Birth Defects: Original Article Series. Volume XV-No. 4. New York: A.R.Liss; 1979.
32.Lu¨ bbers DW, Cutaneous and Transcutaneous pO2 and pCO2 and their measuring conditions. In: Huch R, Huch A, Lucey JF, editors. Continuous Transcutaneous Blood Gas Monitoring, Birth Defects: Original Article Series. Volume XV-No. 4. New York: A. R. Liss; 1979.
33.Lu¨ bbers DW. Theoretical basis of the transcutaneous blood gas measurements. Crit Care Med 1981;9:721–733.
34.Severinghaus JW. Transcutaneous Blood Gas Analysis. Respir Care 1982;27:152–159.
35.Severinghaus JW. Simple, accurate equations for human blood O2 dissociation computations. J Appl Physiol 1979;46: 599–602.
36.Lu¨ bbers DW. Theory and development of transcutaneous oxygen pressure measurement. Int Anesthesiol Clin 1987; 25:31–65.
37.Eberhard P, Severinghaus JW. Measurement of heated skin O2 diffusion conductance and pCO2 sensor induced O2 gradient. Acta Anaesthesiol Scand Suppl 1978;68:1–3.
38.Hansen TN, Sonoda Y, McIlroy MB. Transfer of oxygen, nitrogen and carbon dioxide through normal adult human skin. J Appl Physiol 1980;49:438–443.
39.Parker D, Delpy D, Reynolds EOR, St. Andrew D. A transcutaneous pO2 electrode incorporating a thermal clearance local blood flow sensor. Acta Anaesthesiol Scand Suppl 1978; S68:33–39.
40.Thunstrom AM, Stafford MJ, Severinghaus JW. A two tem-
perature, two pO2 method of estimating the determinants of tcpO2. In: Huch R, Huch A, Lucey JR, editors. Continuous Transcutaneous Blood Gas Monitoring, Birth Defects: Original Article Series. Volume XV-No. 4, New York: A. R. Liss; 1979.
41.Severinghaus JW. CO2 Spannung und Perfusion in Gewebe. Anaesthetist 1960;9:50–55.
42.Beran AV, Huxtable RF, Sperling DR. Electrochemical sensor for continuous transcutaneous pCO2 measurement. J Appl Physiol 1976;41:442–447.
43.Beran AV, Shigezawa GY, Yeung HN, Huxtable RF. An improved sensor and a method for transcutaneous CO2 monitoring. Acta Anaesthesiol Scand Suppl 1978;S68:111–117.
44.Huch A, Seiler D, Meinzer K, Huch R, Galster H, Lu¨ bbers DW. Transcutaneous pCO2 measurement with a miniaturised electrode. Lancet 1977;1:982–983.
45.Severinghaus JW, Stafford M, Bradley AF. tcpCO2 electode design, calibration and temperature gradient problems. Acta Anaesthesiol Scand Suppl 1978;68:118–122.
46.Severinghaus JW, Bradley AF, Stafford MJ. Transcutaneous pCO2 electrode design with internal silver heat path. In: Huch A, Huch R, Lucey JF, editors. Continuous Transcutaneous Blood Gas Monitoring, Birth Defects: Original Article Series. Volume XV-No. 4, New York: A.R. Liss, Inc.; 1979.
47.Parker D, Delpy D, Reynolds EOR. Single electrochemical sensor for transcutaneous measurement of pO2 and pCO2. In: Huch R, Huch A, Lucey JF, editors. Continuous Transcutaneous Bloo Gas Monitoring, in Birth Defects: Original Article Series. Volume XV-No. 4, New York: A. R. Liss; 1979.
48.Severinghaus JW. A combined transcutaneous pO2—pCO2 electrode with electrochemical HCO3- stabilization. J Appl Physiol 1981;51:1027–1032.
49.Severinghaus JW. Transcutaneous monitoring of arterial pCO2. Resp Monit Int Care 1982; 85–91.
50.Gothgen I. Heat-indued changes in pO2 and pCO2 of blood. Acta Anaesthesiol Scand 1984;28:447–451.
51.Jacobsen E, Gothgen I. Relationship between arterial and heated skin surface carbon dioxide tension in adults. Acta Anaesthesiol Scand 1985;29:198–202.
52.Hazinski TA, Severinghaus JW. Transcutaneous analysis of arterial pCO2. Med Instrum 1982;16:150–153.
53.Wimberley PD, Pedersen KG, Thode J Fogh-Andersen, Sorensen AM, Siggaard-Andersen O. Transcutaneou and capillary pCO2 and and pO2 measurements in healthy adults. Clin Chem 1983;29:1471–1473.
54.Tremper KK, Mentelos RA, Shoemaker WC. Effect of hypercarbia and shock on transcutaneous carbon dioxide at different electrode temperatures. Crit Care Med 1980;8:608–612.
55.Phan CQ, Tremper KK, Lee SE, Barker SJ. Noninvasive monitoring of carbon dioxide: A comparison of the partial pressure of transcutaneous and end-tidal carbon dioxide with the partial pressure of arterial carbon dioxide. J Clin Monit 1987;3:149–154.
56.Hoppenbrouwers T, Hodgman JE, Arakawa K, Durand M, Cabal LA. Transcutaneous oxygen and carbon dioxide during the first half year of life in premature and normal term infants. Pediatr Res 1992;31:73–79.
57.Huch R. Review: Perinatal monitoring. Acta Anaesthesiol Scand Suppl 1995;S107:91–94.
58.Huch A. Transcutaneous blood gas monitoring. Acta Anesthesiol Scand Suppl 1995;107:87–90.
59.Flynn JT, et al., A cohort study of transcutaneous oxygen tension and the incidence and severity of retinopathy of prematurity [see comments]. New Engl J Med 1992;326: 1050–1054.
60.Schmidt S, Kakatschikaschwili T, Langner K, Dudenhausen JW, Saling E. [Circulatory adaptation of the newborn infant immediately post partum by biolocal measurement of transcutaneous pCO2]. Z Geburtshife Perinatol 1984;188: 21–23.
61.Binder N, Atherton H, Thorkelsson T, Hoath SB. Measurement of transcutaneous carbon dioxide in low brithweight infants during the first two weeks of life. Am J Perinatol 1994;11:237–241.
62.Huch A, Huch R, Schneider H. Fetal transcutaneous pO2— current knowledge. In: Huch R, Huch A, Lucey JF, editors. Continuous Transcutaneous Blood Gas Monitoring, Birth Defects: Original Article Series. Volume XV-No. 4, New York: A.R.Liss; 1979.
63.Huch R, Huch A. Fetal and maternal PtcO2 monitoring. Crit Care Med 1981;9:694–697.
64.Lofgren O. Continuous transcutaneous carbon dioxide monitoring in the fetus during labor. Crit Care Med 1981;9:750– 751.
65.Okane M, Shigemitsu S, Inaba J, Koresawa M, Kubo T, Iwasaki H. Non-invasive continuous fetal transcutaneous pO2 and pCO2 monitoring during labor. J Perinat Med 1989;17:399–410.
66.Antoine C, Young BK, Silverman F. Simltaneous measurement of fetal tissue pH and transcutaneous pO2 during labor. Eur J Obstet Gynecol Reprod Biol 1984;17:69–76.
67.Schmidt S, Langner K, Dudenhausen JW, Saling E. Reliability of transcutaneous measurement of oxygen and carbon dioxide partial pressure with a combined pO2–pCO2 electrochemical sensor in the fetus during labor. J Perinat Med 1985;13:127–133.
68.Bergmans MG, van Geijn HP, Weber T, Nickelsen C, Schmidt S, van den Berg PP. Fetal transcutaneous pCO2 measurements during labour. Eur J Obstet Gynecol Reprod Biol 1993;51:1–7.
69.Kaneoka T, Kobayashi H, Uchida K, Shirakawa K. [Continuous fetal biochemical monitoring and cardiotocography]. Nippon Sanka Fujinka Gakkai Zasshi 1988;40:721–728.
CO2 ELECTRODES |
119 |
70.Bartnicki J, Langner K, Harnack H, Meyenburg M. The influence of oxygen administration to the mother during labor on the fetal trasncutaneously measured carbon-dioxide partial pressure. J Perinat Med 1990;18:397–402.
71.Aarnoudse JG, Oeseburg B, Kwant G, Zwart A, Zijlstra WG, Huisjes HJ. Influence of variations in pH and pCO2 on scalp tissue oxygen tension and carotid arterial oxygen tension in the fetal lamb. Biol Neonate 1981;40:252–263.
72.Smits TM, Aarnoudse JG, Zijlstra WG. Fetal scalp blood flow as recorded by laser Doppler flowmetry and transcutaneous pO2 during labour. Early Hum Dev 1989;20:109–124.
73.Jensen A, Kunzel W, Kastendieck E. Fetal sympathetic activity, transcutaneous pO2, and skin blood flow during repeated asphyxia in sheep. J Dev Physiol 1987;9:337–346.
74.Paulick R, Kastendieck E, Wernze H. Catecholamines in arterial and venous umbilical blood: placental extraction, correlation with fetal hypoxia, and transcutaneous partial oxygen tension. J Perinat Med 1985;13:31–42.
75.Braems G, Kunzel W, Lang U. Transcutaneous pCO2 during labor—a comparison with fetal blood gas analysis and transcutaneous pO2. Eur J Obstet Gynecol Reprod Biol 1993;52: 81–88.
76.Fukui M, Ohi M, Chin K, Kuno K. The effects of nasal CPAP on transcutaneous pCO2 during non-REM sleep and REM sleep in patients with obstructive sleep apnea syndrome. Sleep 1993;16:S144–5.
77.Manning DJ, Stothers JK. Sleep state, hypoxia and periodic breathing in the neonate. Acta Paediatr Scand 1991;80:763– 769.
78.Morielli A, Desjardins D, Brouillette RT. Transcutaneous and end-tidal carbon dioxide pressures should be measured during pediatric polysomnography. Am Rev Respir Dis 1993;148: 1599–1604.
79.Naifeh KH, Severinghaus JW. Validation of a maskless CO2- response test for sleep and infant studies. J Appl Physiol 1988;64:391–396.
80.Naughton M, Benard D, Tam A, Rutherford R, Bradley TD. Role of hyperventilation in the pathogenesis of central sleep apneas in patients with congestive heart failure [see comments]. Am Rev Respir Dis 1993;148:330–338.
81.Naughton MT, Benard DC, Rutherford R, Bradley TD. Effect of continuous positive airway pressure on central sleep apnea and nocturnal pCO2 in heart failure. Am J Respir Crit Care Med 1994;150:1598–1604.
82.Schafer T, Schafer D, Schla¨fke ME. Breathing, transcuta-
neous blood gases, and CO2 response in SIDS siblings and control infants during sleep. J Appl Physiol 1993;74:88–102.
83.Schlaefke ME, Schaefer T, Kronberg H, Ullrich GJ, Hopmeier J. Transcutaneous monitoring as trigger for therapy of hypoxemia during sleep. Adv Exp Med Biol 1987;220:95–100.
84.Milerad J, Hertzberg T, Lagercrantz H. Ventilatory and metabolic responses to acute hypoxia in infants assessed by transcutaneous gas monitoring. J Dev Physiol 1987;9: 57–67.
85.White RA, Nolan L, Harley D, Long J, Klein S, Tremper K, Nelson R, Tabriski J, Shoemaker W. Noninvasive evaluation of peripheral vascular disease using transcutaneous oxygen tension. Am J Surg 1982;144:68–75.
86.Kram HB, Shoemaker WC. Diagnosis of major peripheral arterial trauma by transcutaneous oxygen monitoring. Am J Surg 1984;147:776–780.
87.Padberg FT, Back TL, Thompson PN, Hobson RW. Transcutaneous oxygen (TcpO2) estimates probability of healing in the ischemic extremity. J Surg Res 1996;60:365–369.
88.Wutschert R, Bounameaux H. Determination of amputation level in ischemic limbs. Reappraisal of the measurement of TcpO2. Diabetes Care 1997;20:1315–1318.