

- •VOLUME 2
- •CONTRIBUTOR LIST
- •PREFACE
- •LIST OF ARTICLES
- •ABBREVIATIONS AND ACRONYMS
- •CONVERSION FACTORS AND UNIT SYMBOLS
- •CARBON.
- •CARDIAC CATHETERIZATION.
- •CARDIAC LIFE SUPPORT.
- •CARDIAC OUTPUT, FICK TECHNIQUE FOR
- •CARDIAC OUTPUT, INDICATOR DILUTION MEASUREMENT OF
- •CARDIAC PACEMAKER.
- •CARDIAC OUTPUT, THERMODILUTION MEASUREMENT OF
- •CARDIOPULMONARY BYPASS.
- •CARDIOPULMONARY RESUSCITATION
- •CARTILAGE AND MENISCUS, PROPERTIES OF
- •CATARACT EXTRACTION.
- •CELL COUNTER, BLOOD
- •CELLULAR IMAGING
- •CEREBROSPINAL FLUID.
- •CHEMICAL ANALYZERS.
- •CHEMICAL SHIFT IMAGING.
- •CHROMATOGRAPHY
- •CO2 ELECTRODES
- •COBALT-60 UNITS FOR RADIOTHERAPY
- •COCHLEAR PROSTHESES
- •CODES AND REGULATIONS: MEDICAL DEVICES
- •CODES AND REGULATIONS: RADIATION
- •COGNITIVE REHABILITATION.
- •COLORIMETRY
- •COMPUTERS IN CARDIOGRAPHY.
- •COLPOSCOPY
- •COMMUNICATION AIDS FOR THE BLIND.
- •COMMUNICATION DEVICES
- •COMMUNICATION DISORDERS, COMPUTER APPLICATIONS FOR
- •COMPOSITES, RESIN-BASED.
- •COMPUTED RADIOGRAPHY.
- •COMPUTED TOMOGRAPHY
- •COMPUTED TOMOGRAPHY SCREENING
- •COMPUTED TOMOGRAPHY SIMULATOR
- •COMPUTED TOMOGRAPHY, SINGLE PHOTON EMISSION
- •COMPUTER-ASSISTED DETECTION AND DIAGNOSIS
- •COMPUTERS IN CARDIOGRAPHY.
- •COMPUTERS IN THE BIOMEDICAL LABORATORY
- •COMPUTERS IN MEDICAL EDUCATION.
- •COMPUTERS IN MEDICAL RECORDS.
- •COMPUTERS IN NUCLEAR MEDICINE.
- •CONFOCAL MICROSCOPY.
- •CONFORMAL RADIOTHERAPY.
- •CONTACT LENSES
- •CONTINUOUS POSITIVE AIRWAY PRESSURE
- •CONTRACEPTIVE DEVICES
- •CORONARY ANGIOPLASTY AND GUIDEWIRE DIAGNOSTICS
- •CRYOSURGERY
- •CRYOTHERAPY.
- •CT SCAN.
- •CUTANEOUS BLOOD FLOW, DOPPLER MEASUREMENT OF
- •CYSTIC FIBROSIS SWEAT TEST
- •CYTOLOGY, AUTOMATED
- •DECAY, RADIOACTIVE.
- •DECOMPRESSION SICKNESS, TREATMENT.
- •DEFIBRILLATORS
- •DENTISTRY, BIOMATERIALS FOR.
- •DIATHERMY, SURGICAL.
- •DIFFERENTIAL COUNTS, AUTOMATED
- •DIFFERENTIAL TRANSFORMERS.
- •DIGITAL ANGIOGRAPHY
- •DIVING PHYSIOLOGY.
- •DNA SEQUENCING
- •DOPPLER ECHOCARDIOGRAPHY.
- •DOPPLER ULTRASOUND.
- •DOPPLER VELOCIMETRY.
- •DOSIMETRY, RADIOPHARMACEUTICAL.
- •DRUG DELIVERY SYSTEMS
- •DRUG INFUSION SYSTEMS
CORONARY ANGIOPLASTY AND GUIDEWIRE DIAGNOSTICS |
349 |
39.Hatcher RA. Depo-Provera injections, implants, and progestinonly pills (minipills). In: Hatcher RA, et al. editors. Contraceptive Technology. New York: Ardent Media, Inc.; 2004. p 471.
40.Le J, Tsourounis C. Implanon: a critical review. Ann Pharmacother 2001;35(3):329–336.
41.Kiriwat O, et al. A 4-year pilot study on the efficacy and safety of Implanon, a single-rod hormonal contraceptive implant, in healthy women in Thailand. Eur J Contracept Reprod Health Care 1998;3(2):85–91.
42.Croxatto HB. Clinical profile of Implanon: a single-rod etonogestrel contraceptive implant. Eur J Contracept Reprod Health Care 2000;5(Suppl. 2):21–28.
43.Croxatto HB, Makarainen L. The pharmacodynamics and efficacy of Implanon. An overview of the data. Contraception 1998;58(6 Suppl.):91S–97S.
44.Espey E, Ogburn T. Perpetuating negative attitudes about the intrauterine device: textbooks lag behind the evidence. Contraception 2002;65(6):389–395.
45.Cheng D. The intrauterine device: still misunderstood after all these years. South Med J 2000;93(9) 859–864.
46.Ortiz ME, Croxatto HB, Bardin CW. Mechanisms of action of intrauterine devices. Obstet Gynecol Surv 1996;51(12 Suppl.): S42–S51.
47.Stanford JB, Mikolajczyk RT. Mechanisms of action of intrauterine devices: update and estimation of postfertilization effects. Am J Obstet Gynecol 2002;187(6):1699–1708.
48.Rivera R, Yacobson I, Grimes D. The mechanisms of action of hormonal contraceptives and intrauterine contraceptive devices. Am J Obstet Gynecol 1999;181(5 Pt. 1):1263–1269.
49.Grimes DA. Intrauterine devices (IUDs). In: Hatcher RA, et al. editors. Contraceptive Technology 18th Revised Edition. New York: Ardent Media, Inc.; 2004. p 499.
50.Hubacher D, Grimes DA. Noncontraceptive health benefits of intrauterine devices: a systematic review. Obstet Gynecol Surv 2002;57(2):120–128.
51.Bahamondes L, et al. Performance of copper intrauterine devices when inserted after an expulsion. Hum Reprod 1995;10(11):2917–2918.
52.Grimes DA. Intrauterine devices (IUDs), In: Hatcher RA, et al. editors. Contraceptive Technology 18th Revised Edition. New York: Ardent Media, Inc.; 2004. p 501.
53.Walsh T, et al. Randomised controlled trial of prophylactic antibiotics before insertion of intrauterine devices. IUD Study Group. Lancet 1998;351(9108):1005–1008.
54.Long-term reversible contraception. Twelve years of experience with the TCu380A and TCu220C. Contraception 1997; 56(6):341–352.
55.Sivin I, et al. Prolonged intrauterine contraception: a sevenyear randomized study of the levonorgestrel 20 mcg/day (LNg 20) and the Copper T380 Ag IUDS. Contraception 1991; 44(5): 473–480.
56.Peterson HB, et al. The risk of pregnancy after tubal sterilization: findings from the U.S. Collaborative Review of Sterilization. Am J Obstet Gynecol 1996;174(4):1161–1168; discussion 1168–1170.
57.Peterson HB, et al. The risk of ectopic pregnancy after tubal sterilization. U.S. Collaborative Review of Sterilization Working Group. N Engl J Med 1997;336(11):762–767.
58.Stewart F, Gabelnick HL. Contraceptive research and development, In: Hatcher RA, et al. editors. Contraceptive Technology 18th Revised Edition. New York: Ardent Media, Inc.; 2004. p 606.
59.Stewart F, Gabelnick HL. Contraceptive research and development, In: Hatcher RA, et al. editors. Contraceptive Technology 18th Revised Edition. New York: Ardent Media, Inc.; 2004. p 603.
See also COLPOSCOPY; SEXUAL INSTRUMENTATION.
CORONARY ANGIOPLASTY AND GUIDEWIRE DIAGNOSTICS
RUPAK K. BANERJEE
ABHIJIT SINHA ROY
University of Cincinnati
Cincinnati, Ohio
LLOYD H. BACK
California Institute of
Technology
Pasadena, California
INTRODUCTION
Percutaneous Transluminal Coronary Angioplasty (PTCA) is an invasive procedure, where a blocked coronary artery is opened by inserting a pressurized balloon. Since its inception in the year 1964 by Dotter and Judkins (1), coronary angioplasty has undergone much development and is commonly performed in Cardiac Catheterization today. A statistic provided by the Center for Disease Control (CDC) shows that nearly one-half of a million PTCA procedures were conducted in United States alone in the year 2002. A typical coronary angioplasty procedure includes these basic components:
Guiding Catheter
A guiding catheter serves three broad purposes: It provides support and passage to the introduction of smaller diameter guidewires. It provides a conduit to the administration of drugs and external agents, such as contrast agent for angiography. It provides damping, due to heart motion, to guidewires inserted through them.
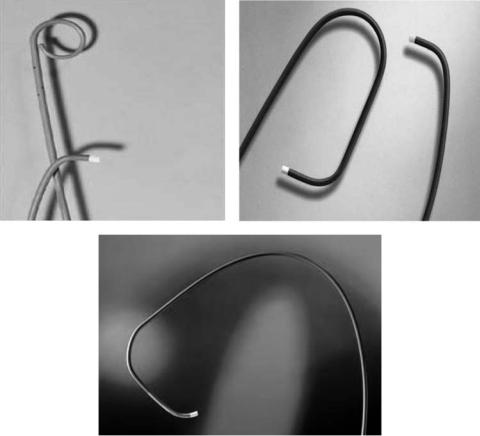
For passage of guidewires, a catheter, having a diameter at least twice that of the guidewire, is recommended. Most guidewires are made up of soft material in the tip so that instance of vessel injury is as minimal as possible. In modern practice, guiding catheter are available in different shapes and sizes, such as Judkins, Amplatz curves, pig tail. Selection of a suitable guiding catheter depends on the application. Small sized guiding catheters of size 6F and 7F are most commonly used in PTCA as their size is well suited for guidewires of size 0.014 in. (0.355 mm) and for passage of balloon catheters, appropriate for coronary dimensions in humans. Some guiding catheters may be designed with side holes at the end, which enables them to engage the coronary ostium, while maintaining continuous administration of fluoroscopy agent. The length of guiding catheters is 90–100 cm. Figure 1 shows some of the guiding catheters being used today in coronary angioplasty.
Guidewires
Modern day guidewires are designed for tip stiffness, easy maneuverability, location control and visibility to angiography. A typical guidewire has a solid core, usually made up of stainless steel or nitinol and has a gradual taper from the proximal to distal end. This core is encapsulated in a spring coil and platinum in the distal section for improved radiographic visibility. The spring coil, which is a teflon coated stainless steel, is usually welded to directly or through a band to the tapered end of a guidewire so that
350 CORONARY ANGIOPLASTY AND GUIDEWIRE DIAGNOSTICS
Figure 1. A few coronary angioplasty guiding catheters. (Courtesy of Boston Scien., MA.)
the user may bend the tip to access the desired artery. Guidewires are available in a wide range of sizes from 0.010 in. (0.254 to 0.457 mm) to 0.018 in. In modern day PTCA, 0.014 in. (0.355 mm) is the size most widely used. In some cases, double length ( 300 cm) guidewires may also be used. These enable access to the diseased vessel while other devices, such as stent, dilation catheters, are being deployed, with minimal risk of vessel injury (2).
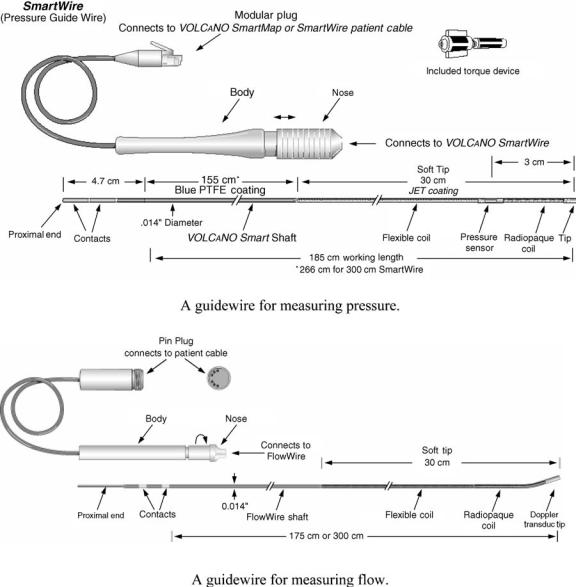
Several specialized guidewires are also available. These guidewires are designed for measurement of arterial pressure and flow to assess the ischemic severity of a stenosis. For pressure measurement, a piezoelectric pressure transducer is placed around the inner solid core of the 0.014 in. (0.355 mm) 3 cm from the tip (Fig. 2). This transducer facilitates measurement of transstenotic pressure drop and Myocardial Fractional Flow Reserve (FFRmyo) (3). These pressure sensors can measure pressure in the range of 30–300 mmHg ( 3.9–39.9 kPa) with an accuracy of1 mmHg (0.133 kPa). For phasic flow measurement, the technology most widely used is a Doppler-based flow sensor. The Doppler flow sensor is placed at the tip of the 0.014 in. (0.355 mm) guidewire ( 175 cm long). For coronary flow measurements, usually 40 MHz piezoelectric transducer is used (Fig. 2). As a general rule, the smaller the vessel size, the larger is the frequency of the sensor. The ultrasound beam describes a conical beam in the distal vessel, thus obtaining a small sample volume. Dopplerbased guidewire are capable of measuring translesional velocity, which is reported as Coronary Flow Reserve
(CFR ¼ coronary flow at hyperemia / coronary flow at basal flow). Currently, however, Doppler guidewires are designed to measure average peak velocity, mean velocity for a cycle as well as diastolic/systolic flow ratio. A unit that measures both flow and pressure simultaneously in coronary vessels is shown in Fig. 3. Another technique used to measure CFR is based on coronary thermodilution. In this method, the wire has a microsensor at a location 3 cm from the floppy tip, which enables simultaneous recording of coronary pressure measurement and temperature, with an accuracy of 0.02 8C (4,5). The shaft of this wire can be used as a second thermistor, which provides the input signal at the coronary ostium of any fluid injection at a temperature different from blood. With this method, CFR is expressed as the ratio of mean transit time at basal flow to mean transit time at hyperemic flow. Experimentally, it has been shown
that CFRdoppler and CFRthermo differ by 20% (5). To facilitate simultaneous evaluation of epicardial and micro-
vascular diseases, a single wire, having both pressure and flow sensor, is also available.
Balloon Catheter
Appropriate selection of a balloon catheter is a must for the success of coronary angioplasty. Beginning from the ‘‘over the wire’’ design, balloons have undergone many improvements. Present balloon catheters are both strong and flexible enough to handle tortuous vessel segment, with minimal intimal injury. Most balloon catheters have a silicone or hydrophilic coating, such as polyethylene, to
CORONARY ANGIOPLASTY AND GUIDEWIRE DIAGNOSTICS |
351 |
Figure 2. Guidewires for measuring pressure and flow in diseased coronary arteries. (Courtesy of Volcano Therapeutics Inc., CA.)
reduce friction. To dilate a balloon catheter, pressures upto 20 atm can be used. Figure 4a and b show a balloon catheter, having an over the wire design, with and without a stent. To generate the pressure, an indeflator is used. It consists of a cylinder, one end of which has a movable plunger and the other end is connected to the dilation catheter (Fig. 4c). The indeflator is partially filled with liquid and has an attached pressure gauge. Dilation catheters have a wide range of inflation diameters ranging from 1.5 to 4 mm depending on the artery dimension. Length of balloons varies from 10 to as much as 40 mm depending on the length of the atherosclerotic lesion. Materials used for manufacturing balloons can be polyethylene, polyolyfin, or nylon to name some, with the wall thickness varying from 0.0003 to 0.0005 in. (0.007 to 0.0127 mm). Additionally, all balloon catheters are sold with a rated burst pressure.
Besides the traditional design in which the catheter passes over the entire length of the guidewire, a design known as monorail is one in which the catheter passes just on its tip such that quick removal and insertion can be done. Some balloon catheters (perfusion balloons) are equipped with side holes at their tips in the shaft proximal and distal to the balloon to allow the blood to flow from the proximal to the distal vessel, when the balloon is inflated. This reduces the risk of ischemia in the heart. Nowadays, PTCA is usually combined with implantation of a stent in the clogged artery to keep the artery open, after balloon removal and reduce the risk of restenosis. The path of approach of catheters and guidewires into the coronaries is usually done via the femoral artery and vein with direction guidance being provided by fluoroscopy. Other paths of approarch can be done via the axillary, brachial, or radial artery. For insertion of balloon as well as normal catheters and guidewires,
352 CORONARY ANGIOPLASTY AND GUIDEWIRE DIAGNOSTICS
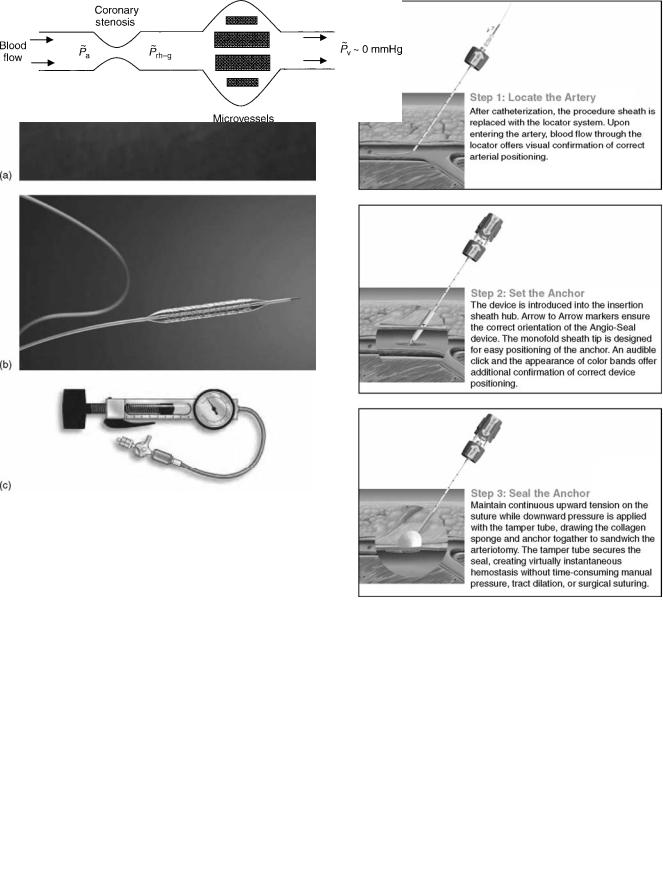
Figure 3. (a) An example of coronary dilation catheter; (b) with stent over it. This is an ‘‘over the wire design’’. (Courtesy of Boston Scientific, MA); (c) An indeflator, which is used to inflate the balloon. (Courtesy of Guidant Corp., IN.)
percutaneous needles, such as seldinger needle for femoral artery, Potts–Cournand needle (which is hollow from inside so that the user can know when the artery has been punctured) and, vascular sheaths are used. In case there is difficulty in detecting the arterial or venous pulse, a smart needle (PSG, Mountain View, CA) may be used, which has a Doppler crystal to direct the needle to the center of the vessel.
Vessel Closure Devices
On completion of PTCA, the punctured vessel needs to be closed to prevent any postprocedural bleeding followed by coagulation. The most commonly used device is a collagen
Figure 5. Measurement of myocordial fractional flow reserve is a coronary stenosis.
Figure 4. Vascular closure device, known as Angio-Seal. (Courtesy of Kensey Nash., PA.)
plug applied to skin outside the outer wall of the vessel (6). Another device, called the Hemostatic Puncture Closure Device, also known as Angio-Seal Vascular Closure device, (Kensey Nash, Exton, PA), uses an anchor on the inner wall of the vessel and uses an attached suture to raise a collagen plug to the outer wall of the vessel (7). Figure 5 shows the

|
|
|
|
CORONARY ANGIOPLASTY AND GUIDEWIRE DIAGNOSTICS |
353 |
||||
Table 1. Lesion Geometry and Hemodynamics Before, Intermediate, and After PTCAa |
|
|
|
||||||
Lesion |
Am, mm2 |
dm, mm |
% Area Stenosis |
lm, mm |
CFR |
p~a mmHg |
Dp~h mmHg |
p~rh mmHg |
FFRmyo |
|
|
|
|
|
|
|
|
|
|
Before-PTCA |
0.7 0.1 |
0.95 |
90 |
0.75 |
2.3 0.1 |
89 3 |
34 |
55 |
0.62 |
Intermediate |
1.43 |
1.35 |
80 |
0.75 |
3.3 |
86 |
14.3 |
70.4 |
0.82 |
After-PTCA |
2.5 0.1 |
1.80 |
64 |
3 |
3.6 0.3 |
84 3 |
7.4 |
75.2 |
0.89 |
aThe parameters Am, dm, and lm are the area, diameter, and length of the narrowest region of the stenoses; p~a and p~rh are the mean arterial pressure in the coronary ostium and distal to the stenosis under hyperemia; Dp~h is the hyperemic pressure drop across the stenosis.
procedure followed to close the vessel using Angio-Seal. Another device, called the Prostar device (Perclose, Redwood City, CA) uses a sheath-like device to pass a suture around the puncture through the skin to close the puncture.
DIAGNOSTICS WITH GUIDEWIRES
With widespread use of PTCA, there has been a surge in the use of guidewires for evaluation of ischemic severity of focal and diffuse lesions before and after angioplasty. Since their inception, several authors (10–13) have validated the usefulness of guidewires in clinical procures, including PTCA. However, during coronary intervention, introduction of guidewire itself produces an additional resistance to blood flow that has not been well documented.
Issues
Current usage of guidewires for coronary stenoses diagnos-
tics is for measurement of FFRmyog and CFRg. By definition (4,12), FFRmyog is the ratio of mean distal pressure (p~rhg) to mean pressure proximal to the stenosis (p~a) at hyperemia,
which is induced by administration of vasodilator agents (e.g., adenosine). Since pressure drop in normal epicardial vessels is very small, p~a mean aortic pressure. Likewise,
CFRg is the ratio of mean coronary flow at hyperemia ( ~hg)
Q
to mean coronary flow at basal (i.e., rest) ( ~ ) (13).
Qb
A value of FFRmyog ¼ 0.75 is assumed to accurately discriminate stenosis whether or not associated with indu-
cible ischemia (4,12). Both FFRmyog and CFRg increase after coronary angioplasty, thereby signifying an enhanced
and normal blood supply to distal myocardium. However, in the presence of microvascular disease, FFRmyog and CFRg measured alone cannot dissociate an epicardial coronary lesion from distal microvascular disease (12,14). To address the nonuniformity of microvascular circulation, application of Relative Coronary Flow Reserve, rCFRg (13,15) was proposed. However, in patients in whom a stenotic artery supplies an area of myocardial infarction, neither CFRg nor rCFRg can differentiate flow impairment due solely to a stenosis.
Currently, guidewires of size 0.014 in. (0.355 mm) are capable of measuring both flow (CFRg) and mean pressure drop, Dp~ (and FFRmyog) across a stenosis. However, the introduction of a guidewire causes an obstructive effect, creating an ‘‘artifactual’’ stenosis (16–19). The threshold
limit of FFRmyog ¼ 0.75 is a measured value with guidewire. However, this measured value of 0.75 must be attrib-
uted to FFRmyog and not FFRmyo, the value for the lesion without guidewire obstruction. Limited information is
available on what degree of flow blockage exists with currently used guidewires, although clinical investigators have acknowledged the limitations of mean pressure drop and flow measurements because of flow obstruction produced by guidewires (20,21). In the following sections, the authors present a summary of their past studies on, (1) quantifying the flow obstruction effect of guidewires of diameter 0.014 in. (0.35 mm) and 0.018 in. (0.46 mm),
which results in enhanced D and reduced ~ in a sig- p~h Qh
nificant, intermediate and moderate focal stenoses; and (2)
corrections to be applied to FFRmyog and CFRg to get true values of FFRmyo and CFR without guidewire, thus improv-
ing the diagnosis of focal coronary lesions.
To evaluate the flow obstruction effect, stenoses geometry of a focal pre-PTCA (22,23) and post-PTCA lesion (24,25) were obtained from the in vivo data set of Wilson et al. (21) in a 32 patient group. The patients had single-vessel, singlelesion coronary artery disease with unstable or stable angina pectoris. Dimensions and shape of the coronary stenosis before and after angioplasty were obtained from quantitative biplanar X-ray angiography. Biplane angiography of each lesion in orthogonal projections (608 left anterior oblique and 308 right anterior oblique) resolved vessel widths with cross-sectional area calculated from the equation for an ellipse, which were converted to mean diameters. The measured mean values SD of minimal area stenosis (Am), mean pressure measured proximal to the stenoses at the ostium (p~a), CFR by Wilson et al. (21) and dimensions are summarized in Table 1 and Fig. 6. Patients with abnormalities that might affect the vasodilator capacity of the arteriolar vasculature were excluded from the study (21). Measured values of CFR with a 3F pulsed Doppler ultrasound catheter (di ¼ 1.0 mm) with tip positioned proximal to the lesions (with minimal flow blockage) increased from 2.3 þ 0.1 to 3.6 þ 0.3 in the procedure; mean arterial pressure, measured in the coronary ostium, decreased from 89 þ 3 to 84 þ 3 mmHg (21). In the flow analysis, the residual composite lesion was assumed to have a smooth, rigid plaque wall, and round concentric shape. Additional dimensional data on the shape of similar size lesion are from Back and Denton (26).
Additionally, an intermediate stenosis (27) having maximal area blockage based on minimal diameter ¼ 80% was used in this study [the dimensions of which are given in Table 1 and were obtained from Back and Denton (26)] to include a wide range of lesion sizes for obtaining the correlations. However, this intermediate lesion size was not measured by Wilson et al. (21). Further, for guidewire analyses, the guidewire was placed concentrically within the lesion. The concentric configuration of the guidewire within the lesion may give the largest pressure drop
354 CORONARY ANGIOPLASTY AND GUIDEWIRE DIAGNOSTICS
|
de |
|
|
|
dm |
|
|
dr |
|
|
|
|
r |
|
|
|
|
|
|
|
|
|
|
|
|
z |
|
|
|
|
|
|
|
|
|
|
|
|
|
lc |
lm lr |
|
|
|
|
|
|
|
|
|
|
|
|
(a) |
|
|
|
|
|
|
|
|
|
de |
dr |
dm |
lc |
lm |
lr |
% Area Stenosis |
|
|
Post-Angioplasty |
3 |
3 |
1.8 |
6 |
3 |
1.5 |
|
64 |
||
|
Intermediate |
|
3 |
3 |
1.35 |
6 |
0.75 |
1.5 |
|
80 |
|
|
Pre-Angioplasty |
|
3 |
3 |
0.95 |
6 |
0.75 |
1.5 |
|
90 |
|
|
|
|
|
|
|
(b) |
|
|
|
|
|
velocity |
1.0 |
|
|
|
|
Snormal |
Dnormal |
|
|
||
0.9 |
|
|
|
|
|
|
|
|
|
|
|
0.8 |
|
|
|
|
|
|
|
|
|
|
|
0.7 |
|
|
|
|
|
|
|
|
|
|
|
Normalized |
|
|
|
|
|
|
|
|
|
|
|
0.6 |
|
|
|
|
|
|
|
|
|
0.537 |
|
0.5 |
|
|
|
|
|
|
|
|
|
||
|
|
|
|
|
|
|
|
|
|
||
0.4 |
|
|
|
|
|
|
|
|
|
|
|
0.3 |
|
|
|
|
|
|
|
|
|
|
|
p-t |
0.2 |
|
|
|
|
|
|
|
|
|
|
u/u |
0.1 |
First pulse |
|
|
|
Second pulse |
|||||
|
0.0 |
|
|
|
|
|
|
|
|
|
|
|
0.0 |
0.2 |
0.4 |
0.6 |
0.8 |
|
1.0 |
1.2 |
1.4 |
1.6 |
|
Time (s)
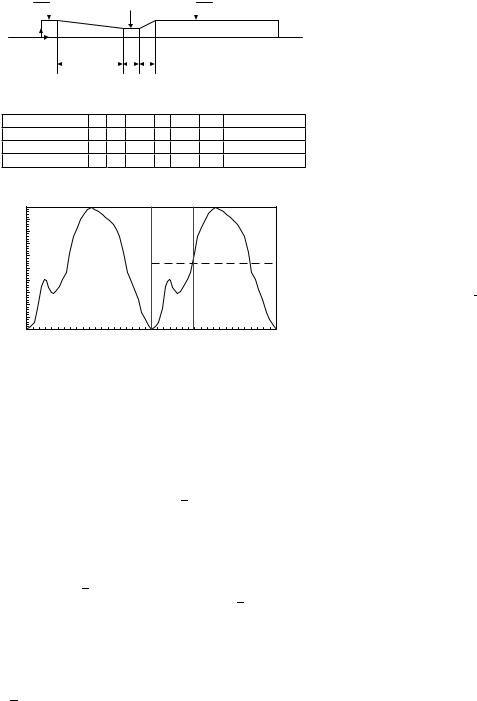
Figure 6. (a) Stenoses geometry showing the shape and dimensions in mm; (b): Normal coronary flow waveform u~=u~p-t versus t, where Snormal indicates the beginning of systole and Dnormal indicates the beginning of diastole.
(1). The geometry of the native, intermediate, and moderate lesion with and without guidewire is shown in detail in Fig. 7a–c .
The coronary velocity waveform uðtÞ (spatially averaged at each time across the cross-sectional area) used in the flow analyses was obtained in our laboratory from in vitro calibration (28), smoothing the fluctuating Doppler signal, and phase shifting the normal pattern for the proximal left anterior descending (LAD) artery. In Fig. 5b, the peak diastolic velocity up t corresponds to a normalized velocity
’
of 1.0, so that the mean peak velocity ratio u=up t is 0.537, as shown by the dashed line.
With guidewire inserted concentrically, in the proximal vessel, the spatial velocity profile in the annular gap was taken to be the analogous Poiseuille flow relation for the axial velocity u (22,25):
u=2u ¼ ½ð1 ðr=roÞ2Þlnðro=riÞ þ ð1 ðri=roÞ2Þlnðr=roÞ&=
ð1Þ
½ð1 þ ðri=roÞ2Þlnðro=riÞ ð1 ðri=roÞ2Þ&
where u is a function of r and t. Without the guidewire in the proximal vessel, the spatial velocity profile was initially taken to be the Poiseuille flow relation for the axial velocity u:
u=2 |
|
¼ ð1 ðr=roÞ2Þ |
ð2Þ |
u |
The Carreau model, given by Eq. 3, was used for shear rate dependent non-Newtonian blood viscosity with the local shear rate (Eq. 4) calculated from the velocity gradient
through the second invariant of the rate of strain tensor (35).
h ¼ h1 þ ðho h1Þh1 þ ðlg˙ Þ2iðn 1Þ=2 |
ð3Þ |
|||||
|
v |
|
|
|||
g˙ |
u |
1 |
Xi |
Xj |
4 |
|
|
|
|
|
|||
t |
|
4 |
5 |
|
||
u |
|
2 |
g˙ i jg˙ ji3 |
Þ |
||
|
¼ u2 |
|
|
ð |
||
where h1 ¼ 0:00345 Pa s ho ¼ 0.056 Pa s, l ¼ 3.313 s and n ¼ 0.3568.
Details of the numerical method used to calculate the pulsatile hemodynamics in coronary artery and lesions with and without guidewire were previously described by Banerjee et al. (22–24). A typical basal physiological
~ |
1 |
for a coronary vessel of 3 mm size |
value Qb ¼ 50 mL min |
|
was used (30). The cycle time of 0.8 s and density of blood r ¼ 1.05 g cm 3 was used. In the Reynolds number (Re), a kinematic viscosity of v ¼ 0.035 cm2 s was used, a value near the asymptote in the Carreau model for blood (h1 ! 0:00345 Pa s as g ! 1), which gives v1 ! 0.033 cm2 s. The Womersley number varied from 1.9 with guidewire size 0.35–2.25 mm in the pathophysiological scenario without guidewire.
CFR and p~rh without guidewire (21–25) and computed values of CFR and p~rh-g for the different lesions with guidewire (0.35 and 0.46 mm) were used to construct the maximal vasodilation-distal perfusion pressure curve, also known as CFR p~rh relationship. The maximal CFR p~rh curve was plotted by joining the measured (21), and computed values of CFR and p~rh at hyperemia for the native, intermediate, and residual lesions after angioplasty since blood was supplied to the same distal vasculature, which was originally with marked arteriolar dilation. The CFR p~rh relationship was then used to construct the
correlations between FFRmyo and FFRmyog, and CFR and CFRg in native, intermediate, and residual lesions
for the two guidewires. The linear CFR p~rh was also extrapolated toward its origin to estimate zero-coronary flow mean pressure (p~zf ) for the Wilson et al. (21) patient group.
Diagnostics with Angioplasty Catheters
As an initial step, the authors calculated the D ~ p~ Q
relationship post-PTCA (Curve J in Fig. 8), in conjunction with the pressure measurements, using the angioplasty catheter (di ¼ 1.4 mm) before the development of small guidewire sensors (31). For resting conditions with the catheter present, flow was believed to be 40% of normal basal flow in the absence of the catheter, and for hyperemia, 20% of elevated flow in the patient group. Also, Dp~ was significantly elevated in the tighter artifactual stenoses during the measurements. The above diagnostic measurements were compared with the pathophysiologic scenario, having no angioplasty catheter. The results of pathophysiologic conditions cannot be measured in lesions, and are descriptive of the unperturbed conditions that may have existed on average in the patient group after PTCA. In the absence of angioplasty catheter, the calculated Dp~ was only 1 mmHg (0.133 kPa) at basal
CORONARY ANGIOPLASTY AND GUIDEWIRE DIAGNOSTICS |
355 |
flow, and increased moderately to 7.4 mmHg for hyperemic flow measured proximally (CFR ¼ 3.6) with minimal blockage. On the other hand, with the catheter, Dp~ was28.7 mmHg for the basal flow showing an order of magnitude increase in Dp~.
Increased Pressure Drop and Reduced Hyperemic Flow Due to the Presence of Guidewire
Tables 1 and 2 give the mean pressure drop Dp~h and distal mean pressure p~rh at hyperemic condition in native,
(a)
|
|
|
|
|
|
|
|
|
|
|
|
|
|
|
6.0 |
|
|
|
|
|
|
0.75 |
||||||
|
|
|
|
|
|
|
|
|
|
|
|
|
|
|
|
|
|
|
|
|
|
|
||||||
|
|
|
|
|
|
|
|
|
|
|
|
|
|
|
|
|
|
|
|
|
1.5 |
|
|
|
||||
|
|
|
|
|
|
|
|
|
|
|
|
|
|
|
|
|
|
|
|
|
|
|
|
|
||||
|
|
|
|
|
|
|
|
|
|
|
|
|
|
|
|
|
|
|
|
|
|
|
||||||
R1.5 |
|
r |
|
|
|
|
|
R0.475 |
|
|
|
|
|
|
|
|
|
|
|
|
|
|||||||
|
|
|
|
|
|
|
|
|
|
|
|
|
|
|
|
|
|
|
||||||||||
|
|
|
|
|
|
|
|
|
|
|
|
|
|
|
|
|
|
|
|
|
|
|
||||||
|
|
|
|
|
|
|
|
|
|
|
|
|
|
|
|
|
|
|
|
|
|
|
|
|
|
|
|
|
|
|
|
|
|
|
|
z |
|
|
|
|
|
|
|
|
|
|
Axis |
||||||||||
|
|
|
|
|
|
|
|
|
|
|
|
|
|
|
|
|
||||||||||||
Plaque
(i) Physiological Pre-PTCA;
|
Guidewire Surface |
6.0 |
0.75 |
|
|
|
1.5 |
|
|
|
|
|
|
|
R1.5 |
r |
|
|
|
|
z |
|
Axis |
R0.175 |
|
|
|
Plaque |
|
|
|
|
|
|
|
|
(ii) Pre-PTCA with 0.35 mm gw |
|
|
|
|
|
|
|
|
|
|
|
|
|
|
Guidewire Surface |
|
|
|
|
|
6.0 |
|
|
|
|
|
|
|
|
|
|
|
|
|
|
|
|
|
|
|
|
0.75 |
|
|
|
|
|
|
|
|
|
|
|
|
|
|
|
|
|
|
|
|
|
|
|
|
|
|
|
|
|
|
|
|
|
|
|
|
|
|
|
|
|
|
|
|
|
|
|
|
|||||||||||||||||||||||||||
|
|
|
|
|
|
|
|
|
|
|
|
|
|
|
|
|
|
|
|
|
|
|
|
|
|
|
|
|
|
|
|
|
|
|
|
|
|
|
|
|
|
|
|
|
|
|
|
|
|
|
|
|
|
|
|
|
|
|
|
|
|
|
|
|
|
|
|
|
|
|
|
|
|
|
|
|
|
|
|
|
|
|
|
|||||||||||||||||||||||||||||||
|
|
|
|
|
|
|
|
|
|
|
|
|
|
|
|
|
|
|
|
|
|
|
|
|
|
|
|
|
|
|
|
|
|
|
|
|
|
|
|
|
|
|
|
|
|
|
|
|
|
|
|
|
1.5 |
|
|
|
|
|
|
|
|
|
|
|
|
|
|
|
|
|
|
|
|
|
|
|
|
|
|
|
|
|
|
|
|
|
|
|
|
|
|
|
|
|
|
|
|
|
|
|
|
|
|
|
|
|||||||||
|
|
|
|
|
|
|
|
|
|
|
|
|
|
|
|
|
|
|
|
|
|
|
|
|
|
|
|
|
|
|
|
|
|
|
|
|
|
|
|
|
|
|
|
|
|
|
|
|
|
|
|
|
|
|
|
|
|
|
|
|
|
|
|
|
|
|
|
|
|
|
|
|
|
|
|
|
|
|
|
|
|
|
|
|
|
|
|
|
|
|
|
|
|
|
|
|
|
|
|
|
|
|
|
|
|
|||||||||
|
|
|
|
|
|
|
|
|
|
|
|
|
|
|
|
|
|
|
|
|
|
|
|
|
|
|
|
|
|
|
|
|
|
|
|
|
|
|
|
|
|
|
|
|
|
|
|
|
|
|
|
|
|
|
|
|
|
|
|
|
|
|
|
|
|
|
|
|
|
|
|
|
|
|
|
|
|
|
|
|
|
|
|
|
|
|
|
|
|
|
|
|
|
|
|
|
|
|
|
|
|
|
|
|
|
|
|
|
||||||
|
|
|
|
|
|
|
|
|
|
|
|
|
|
|
|
|
|
|
|
|
|
|
|
|
|
|
|
|
|
|
|
|
|
|
|
|
|
|
|
|
|
|
|
|
|
|
|
|
|
|
|
|
|
|
|
|
|
|
|
|
|
|
|
|
|
|
|
|
|
|
|
|
|
|
|
|
|
|
|
|
|
|
|
|
|
|
|
|
|
|
|
|
|
|
|
|
|
|
|
|
|
|
|
|
|
|
|
|
|
|
|
|
|
|
|
R1.5 |
|
|
|
|
r |
|
|
|
|
|
|
|
|
|
|
|
|
|
|
|
|
|
|
|
|
|
|
|
|
|
|
|
|
|
|
|
|
|
|
|
|
|
|
|
|
|
|
|
|
|
|
|
|
|
|
|
|
|
|
|
|
|
|
|
|
|
|
|
|
|
|
|
|
|
|
|
|
|
|
|
|
|
|
|
|
|
|
||||||||||||||||||||||||||
|
|
|
|
|
|
|
|
|
|
|
|
|
|
|
|
|
|
|
|
|
|
|
|
|
|
|
|
|
|
|
|
|
|
|
|
|
|
|
|
|
|
|
|
|
|
|
|
|
|
|
|
|
|
|
|
|
|
|
|
|
|
|
|
|
|
|
|
|
|
|
|
|
|
|
|
|
|
|
|
|
|
|||||||||||||||||||||||||||||||||
|
|
|
|
|
|
|
|
|
|
|
|
|
|
|
|
|
|
|
|
|
|
|
|
|
|
|
|
|
|
|
|
|
|
|
|
|
|
|
|
|
|
|
|
|
|
|
|
|
|
|
|
|
|
|
|
|
|
|
|
|
|
|
|
|
|
|
|
|
|
|
|
|
|
|
|
|
|
|
|
|
|
|
|
|
|
|
|
|
|
|
|
|
|
|
|
|
|
|
|
|
|
|
|
|
|
|
|
|
|
|
|
|
||
|
|
|
|
|
|
|
|
|
|
|
|
|
|
|
|
|
|
|
|
|
|
|
|
|
|
|
|
|
|
|
|
|
|
|
|
|
|
|
|
|
|
|
|
|
|
|
|
|
|
|
|
|
|
|
|
|
|
|
|
|
|
|
|
|
|
|
|
|
|
|
|
|
|
|
|
|
|
|
|
|
|
|
|
|
|
|
|
|
|
|
|
|
|
|
|
|
|
|
|
|
|
|
|
|
|
|
|
|
|
|
|
|
|
|
|
|
|
|
|
|
|
|
|
|
|
|
|
z |
|
|
|
|
|
|
|
|
|
|
|
|
|
|
|
|
|
|
Axis |
|
|
|
|
|
|
|
|
|
Plaque |
|
|
|
|
|
|
|
|
|
|
|
|
|
|
|
|
|
|
|
|
|
|
|
|
|
|
|
|
|
|
|
|
R0.23 |
|
|
|
|
|||||||||||||||||||||||||||||||||||
|
|
|
|
|
|
|
|
|
|
|
|
|
|
|
|
|
|
|
|
|
|
|
|
|
|
|
|
|
|
|
|
|
|
|
|
|
|
|
|
|
|
|
|
|
|
|
|
|
|
|
|
|
|
|
|
|
|
|
|
|
|
|
|
|
|
|
|
|
|
|
|
|
|
|
||||||||||||||||||||||||||||||||||||||||
|
|
|
|
|
|
|
|
|
|
|
|
|
|
|
|
|
|
|
|
|
|
|
|
|
|
|
|
|
|
|
|
|
|
|
|
|
|
|
|
|
|
|
|
|
|
|
|
|
|
|
|
|
|
|
|
|
|
|
|
|
|
|
|
|
|
|
|
|
|
|
|
|
|
|
|
|
|
|
|
|
|
|
|
|
|
|
|
|
|
|
|
|
|
|
|
|
|
|
|
|
|
|||||||||||||
|
|
|
|
|
|
|
|
|
|
|
|
|
|
|
|
|
|
|
|
|
|
|
|
|
|
|
|
|
|
|
|
|
|
|
|
|
|
|
|
|
|
|
|
|
|
|
|
|
|
|
|
|
|
|
|
|
|
|
|
|
|
|
|
|
|
|
|
|
|
|
|
|
|
|
|
|
|
|
|
|
|
|
|
|
|
|
|
|
|
|
|
|
|
|
|
|
|
|
|
|
|
|
|
|
|
|||||||||
|
|
|
|
|
|
|
|
|
|
|
|
|
|
|
|
|
|
|
|
|
|
|
|
|
|
|
|
|
|
|
|
|
|
|
|
|
|
(iii) Pre-PTCA with 0.46 mm gw; |
|
|
|
|
|
|
|
|
|
|
|
|
|
|
|
|
|
|
|
|
|
|
|
|
|
|
|
|
|
|
|
|
|
|
|
|
|
|
|
|
||||||||||||||||||||||||||||||||||||
(b) |
|
|
|
|
|
|
|
|
|
|
|
|
|
|
|
|
|
|
|
|
|
|
|
|
|
|
|
|
|
|
|
6.0 |
|
|
|
|
|
|
|
|
|
|
|
|
|
|
|
|
|
|
0.75 |
|
|
|
|
|
|
|
|
|
|
|
|
|
|
|
|
|
|
|
|
|
|
|
|
|
|
|
|
|
|
|
|
|
|
|
|
|
|
|
|
|
|
|
|
|
|
|
|
|
||||||||||||||
|
|
|
|
|
|
|
|
|
|
|
|
|
|
|
|
|
|
|
|
|
|
|
|
|
|
|
|
|
|
|
|
|
|
|
|
|
|
|
|
|
|
|
|
|
|
|
|
|
|
|
|
|
|
|
|
|
|
|
|
|
|
|
|
|
|
|
|
|
|
|
|
|
|
|
|
|
|
|
|
|
|
|
|
|
|
|
|
|
|
|
|
|
|
|
|
|
|
|||||||||||||||||
|
|
|
|
|
|
|
|
|
|
|
|
|
|
|
|
|
|
|
|
|
|
|
|
|
|
|
|
|
|
|
|
|
|
|
|
|
|
|
|
|
|
|
|
|
|
|
|
|
|
|
|
1.5 |
|
|
|
|
|
|
|
|
|
|
|
|
|
|
|
|
|
|
|
|
|
|
|
|
|
|
|
|
|
|
|
|
|
|
|
|
|
|
|
|
|
|
|
|
|
|
|
|
|
|
|
|
|
|||||||||
|
|
|
|
|
|
|
|
|
|
|
|
|
|
|
|
|
|
|
|
|
|
|
|
|
|
|
|
|
|
|
|
|
|
|
|
|
|
|
|
|
|
|
|
|
|
|
|
|
|
|
|
|
|
|
|
|
|
|
|
|
|
|
|
|
|
|
|
|
|
|
|
|
|
|
|
|
|
|
|
|
|
|
|
|
|
|
|
|
|
|
|
|
|
|
|
|
|
|
|
|
|
|
|
|
||||||||||
|
|
|
|
|
|
|
|
|
|
|
|
|
|
|
|
|
|
|
|
|
|
|
|
|
|
|
|
|
|
|
|
|
|
|
|
|
|
|
|
|
|
|
|
|
|
|
|
|
|
|
|
|
|
|
|
|
|
|
|
|
|
|
|
|
|
|
|
|
|
|
|
|
|
|
|
|
|
|
|
|
|
|
|
|
|
|
|
|
|
|
|
|
|
|
|
|
|
|
|
|
|
|
|
|
|
|
|
|
|
|||||
|
|
|
|
|
|
|
|
|
|
|
|
|
|
|
|
|
|
|
|
|
|
|
|
|
|
|
|
|
|
|
|
|
|
|
|
|
|
|
|
|
|
|
|
|
|
|
|
|
|
|
|
|
|
|
|
|
|
|
|
|
|
|
|
|
|
|
|
|
|
|
|
|
|
|
|
|
|
|
|
|
|
|
|
|
|
|
|
|
|
|
|
|
|
|
|
|
|
|
|
|
|
|
|
|
|
|
||||||||
R1.5 |
|
|
r |
|
|
|
|
|
|
|
|
|
|
|
|
|
|
|
|
|
|
|
|
|
|
|
|
|
|
|
|
|
|
|
|
|
|
|
|
|
|
|
|
|
|
|
|
|
|
|
|
|
|
|
|
|
|
|
|
|
|
|
|
|
|
|
|
|
|
|
|
|
|
|
|
|
|
|
|
|
|
|
|
|
|
|
|
|
|
|
|
|
|
|
|
|
|
|
|
|
|
|
|
|
|
|
|
|
||||||
|
|
|
|
|
|
|
|
|
|
|
|
|
|
|
|
|
|
|
|
|
|
|
|
|
|
|
|
|
|
|
|
|
|
|
|
|
|
|
|
|
|
|
|
|
|
|
|
|
|
|
|
|
|
|
|
|
|
|
|
|
|
|
|
|
|
|
|
|
|
|
|
|
|
|
|
|
|
|
|
|
|
|
|
|
|
|
|
|
|
|
|
|
|
|
|
|
|
|
|
|
|
|
|
|
|
|
||||||||
|
|
|
|
|
|
|
|
|
|
R0.675 |
|
|
|
|
|
|
|
|
|
|
|
|
|
|
|
|
|
|
|
|
|
|
|
|
|
|
|
|
|
|
|
|
|
|
|
|
|
|
|
|
|
|
|
|
|
|
|
|
|
|
|
|
|
|
|
|
|
|
|
|
|
|
|
|
|
|
|
|
|
|
|
|
|
|
|
|
|
|
|
|
|
|
||||||||||||||||||||||
|
|
|
|
|
|
|
|
|
|
|
|
|
|
|
|
|
|
|
|
|
|
|
|
|
|
|
|
|
|
|
|
|
|
|
|
|
|
|
|
|
|
|
|
|
|
|
|
|
|
|
|
|
|
|
|
|
|
|
|
|
|
|
|
|
|
|
|
|
|
|
|
|
|
|
|
|
|
|
|
|
|
|
|
|
|
|
|
|
|
|
|
|
|
|
|
|
|
|
|
|||||||||||||||
|
|
|
|
|
|
|
|
|
|
|
|
z |
|
|
|
|
|
|
|
|
|
|
|
|
|
|
|
|
|
|
|
|
|
|
|
|
|
Axis |
|
|
|
|
|
|
|
|
Plaque |
|
|
|
|
|
|
|
|
|
|
|
|
|
|
|
|
|
|
|
|
|
|
|
|
|
|
|
|
|
|
|
|
|
|
|
|
|
|
|
|
|||||||||||||||||||||||||||
|
|
|
|
|
|
|
|
|
|
|
|
|
|
|
|
|
|
|
|
|
|
|
|
|
|
|
|
|
|
|
|
|
|
|
|
|
|
|
|
|
|
|
|
|
|
|
|
|
|
|
|
|
|
|
|
|
|
|
|
|
|
|
|
|
|
|
|
|
|
|
|
|
|
|
|
|
|
|||||||||||||||||||||||||||||||||||||
|
|
|
|
|
|
|
|
|
|
|
|
|
|
|
|
|
|
|
|
|
|
|
|
|
|
|
|
|
|
|
|
|
|
|
|
|
|
|
|
|
|
|
|
|
|
|
|
|
|
|
|
|
|
|
|
|
|
|
|
|
|
|
|
|
|
|
|
|
|
|
|
|
|
|
|
|
|
|||||||||||||||||||||||||||||||||||||
|
|
|
|
|
|
|
|
|
|
|
|
|
|
|
|
|
|
|
|
|
|
|
|
|
|
|
|
|
|
|
|
|
|
|
|
|
|
|
|
|
|
|
|
|
|
|
|
|
|
|
|
|
|
|
|
|
|
|
|
|
|
|
|
|
|
|
|
|
|
|
|
|
|
|
|
|
|
|
|
|
|
|
|
|
|
|
|
|
|
|
|
|
|
|
|
|
|
|
|
|
|
|
|
|
||||||||||
|
|
|
|
|
|
|
|
|
|
|
|
|
|
|
|
|
|
|
|
|
|
|
|
|
|
|
|
|
|
|
|
|
|
(i) Intermediate stenoses |
|
|
|
|
|
|
|
|
|
|
|
|
|
|
|
|
|
|
|
|
|
|
|
|
|
|
|
|
|
|
|
|
|
|
|
|
|
|
|
|
|
|
|
|
|
|
|
|
|
|
|
|
|
|
|
|
|
|
||||||||||||||||||||||
|
|
|
|
|
|
|
|
|
|
|
|
Guidewire Surface |
|
|
6.0 |
|
|
|
|
|
|
|
|
|
|
|
|
|
|
|
|
|
|
0.75 |
|
|
|
|
|
|
|
|
|
|
|
|
|
|
|
|
|
|
|
|
|
|
|
|
|
|
|
|
|
|
|
|
|
|
|
|
|
|
|
|
|
|
|
|
|
|
|
|
|
|||||||||||||||||||||||||||||||
|
|
|
|
|
|
|
|
|
|
|
|
|
|
|
|
|
|
|
|
|
|
|
|
|
|
|
|
|
|
|
|
|
|
|
|
|
|
|
|
|
|
|
|
|
|
|
|
|
|
|
|
|
|
|
|
|
|
|
|
|
|
|
|
|
|
|
|
|
|
|
|
|
|
|
|
|
|
|
|
|
||||||||||||||||||||||||||||||||||
|
|
|
|
|
|
|
|
|
|
|
|
|
|
|
|
|
|
|
|
|
|
|
|
|
|
|
|
|
|
|
|
|
|
|
|
|
|
|
|
|
|
|
|
|
|
|
|
|
|
|
1.5 |
|
|
|
|
|
|
|
|
|
|
|
|
|
|
|
|
|
|
|
|
|
|
|
|
|
|
|
|
|
|
|
|
|
|
|
|
|
|
|
|
|
|
|
|
|
|
|
|
|
|
|
|
|
||||||||||
|
|
|
|
|
|
|
|
|
|
|
|
|
|
|
|
|
|
|
|
|
|
|
|
|
|
|
|
|
|
|
|
|
|
|
|
|
|
|
|
|
|
|
|
|
|
|
|
|
|
|
|
|
|
|
|
|
|
|
|
|
|
|
|
|
|
|
|
|
|
|
|
|
|
|
|
|
|
|
|
|
|
|
|
|
|
|
|
|
|
|
|
|
|
|
|
|
|
|
|
|
|
|
|
|
||||||||||
|
|
|
|
|
|
|
|
|
|
|
|
|
|
|
|
|
|
|
|
|
|
|
|
|
|
|
|
|
|
|
|
|
|
|
|
|
|
|
|
|
|
|
|
|
|
|
|
|
|
|
|
|
|
|
|
|
|
|
|
|
|
|
|
|
|
|
|
|
|
|
|
|
|
|
|
|
|
|
|
|
|
|
|
|
|
|
|
|
|
|
|
|
|
|
|
|
|
|
|
|
|
|
|
|
|
|
|
|
|
|||||
|
|
|
|
|
|
|
|
|
|
|
|
|
|
|
|
|
|
|
|
|
|
|
|
|
|
|
|
|
|
|
|
|
|
|
|
|
|
|
|
|
|
|
|
|
|
|
|
|
|
|
|
|
|
|
|
|
|
|
|
|
|
|
|
|
|
|
|
|
|
|
|
|
|
|
|
|
|
|
|
|
|
|
|
|
|
|
|
|||||||||||||||||||||||||||
|
|
|
|
|
|
|
|
|
|
|
|
|
|
|
|
|
|
|
|
|
|
|
|
|
|
|
|
|
|
|
|
|
|
|
|
|
|
|
|
|
|
|
|
|
|
|
|
|
|
|
|
|
|
|
|
|
|
|
|
|
|
|
|
|
|
|
|
|
|
|
|
|
|
|
|
|
|
|
|
|
|
|
|
|
|
|
|
|
|
|
|
|
|
|
|
|
|
|
|
|
|
|
|
|
|
|
|
|
|
|
|
|
|
|
R1.5 |
|
|
r |
|
|
|
|
|
|
|
|
|
|
|
|
|
|
|
|
|
|
|
|
|
|
|
|
|
|
|
|
|
|
|
|
|
|
|
|
|
|
|
|
|
|
|
|
|
|
|
|
|
|
|
|
|
|
|
|
|
|
|
|
|
|
|
|
|
|
|
|
|
|
|
|
|
|
|
|
|
|
|
|
|
|
|||||||||||||||||||||||||||||
|
|
|
|
|
|
|
|
|
|
|
|
|
|
|
|
|
|
|
|
|
|
|
|
|
|
|
|
|
|
|
|
|
|
|
|
|
|
|
|
|
|
|
|
|
|
|
|
|
|
|
|
|
|
|
|
|
|
|
|
|
|
|
|
|
|
|
|
|
|
|
|
|
|
|
|
|
|
|
|
|
|
|
|
|||||||||||||||||||||||||||||||
|
|
|
|
|
|
|
|
|
|
|
|
|
|
|
|
|
|
|
|
|
|
|
|
|
|
|
|
|
|
|
|
|
|
|
|
|
|
|
|
|
|
|
|
|
|
|
|
|
|
|
|
|
|
|
|
|
|
|
|
|
|
|
|
|
|
|
|
|
|
|
|
|
|
|
|
|
|
|
|
|
|
|
|
|
|
|
|
|
|
|
|
|
|
|
|
|
|
|
|
|
|
|
|
|
|
|
|
|
|
|
|
|
|
|
|
|
|
|
|
|
|
|
|
|
|
|
|
|
|
|
|
|
|
|
|
|
|
|
|
|
|
|
|
|
|
|
|
|
|
|
|
|
|
|
|
|
|
|
|
|
|
|
|
|
|
|
|
|
|
|
|
|
|
|
|
|
|
|
|
|
|
|
|
|
|
|
|
|
|
|
|
|
|
|
|
|
|
|
|
|
|
|
|
|
|
|
|
|
|
|
|
|
|
|
|
|
|
|
|
|
|
|
|
|
|
|
|
|
|
|
|
|
|
|
|
|
|
|
|
|
|
z |
|
|
|
|
|
|
|
|
|
|
|
|
|
|
|
|
|
Axis |
|
|
|
|
|
|
|
|
Plaque |
|
|
|
|
|
|
|
|
|
|
|
|
|
|
|
|
|
|
|
|
|
|
|
|
|
|
|
|
|
|
|
|
R0.175 |
|
|
|
|||||||||||||||||||||||||||||||||||||||
|
|
|
|
|
|
|
|
|
|
|
|
|
|
|
|
|
|
|
|
|
|
|
|
|
|
|
|
|
|
|
|
|
|
|
|
|
|
|
|
|
|
|
|
|
|
|
|
|
|
|
|
|
|
|
|
|
|
|
|
|
|
|
|
|
|
|
|
|
|
|
|
|||||||||||||||||||||||||||||||||||||||||||
|
|
|
|
|
|
|
|
|
|
|
|
|
|
|
|
|
|
|
|
|
|
|
|
|
|
|
|
|
|
|
|
|
|
|
|
|
|
|
|
|
|
|
|
|
|
|
|
|
|
|
|
|
|
|
|
|
|
|
|
|
|
|
|
|
|
|
|
|
|
|
|
|
|
|
|
|
|
|
|
|
|
|
|
|
|
|
|
|
|
|
|
|
|
|
|
|
|
|
|
|||||||||||||||
|
|
|
|
|
|
|
|
|
|
|
|
|
|
|
|
|
|
|
|
|
|
|
|
|
|
|
|
|
|
|
|
|
|
|
|
|
|
|
|
|
|
|
|
|
|
|
|
|
|
|
|
|
|
|
|
|
|
|
|
|
|
|
|
|
|
|
|
|
|
|
|
|
|
|
|
|
|
|
|
|
|
|
|
|
|
|
|
|
|
|
|
|
|
|
|
|
|
|
|
|
|
|
|
|
||||||||||
|
|
|
|
|
|
|
|
|
|
|
|
|
|
|
|
|
|
|
|
|
|
|
|
|
|
|
|
|
|
|
|
|
|
(ii) Intermediate stenoses with 0.35 mm gw |
|
|
|
|
|
|
|
|
|
|
|
|
|
|
|
|
|
|
|
|
|
|
|
|
|
|
|
|
|
|
|
|
|
|
|
|
|
|
|
|
||||||||||||||||||||||||||||||||||||||||
|
Guidewire Surface |
|
0.75 |
|
|
|
6.0 |
|
|
|
|
1.5 |
|
|
|
|
|
|
|
R1.5 |
r |
|
|
|
|
z |
|
Axis |
R0.23 |
|
|
|
Plaque |
|
|
|
|
|
|
|
|
(iii) Intermediate stenoses with 0.46 mm gw |
|
|

356 CORONARY ANGIOPLASTY AND GUIDEWIRE DIAGNOSTICS
(c) |
6.0 |
|
|
|
|
|
|
3.0 |
|
|
|
1.5 |
|
|
|
||||||||||||
|
|
|
|
|
|
|
|
|
|
|
|
|
|
|
|||||||||||||
|
|
|
|
|
|
|
|
|
|
|
|
|
|
|
|
|
|
|
|
|
|
||||||
R1.5 |
|
r |
|
|
|
|
|
|
|
|
|
|
|
|
|
|
|
|
|
|
|
|
|||||
|
|
|
|
|
|
|
|
|
|
|
|
|
|
|
|
|
|
|
|
|
|||||||
|
|
|
R0.9 |
|
|
|
|
|
|
|
|
|
|||||||||||||||
|
|
|
|
|
|
|
|
|
|
|
|
|
|
|
|
|
|
|
|||||||||
|
|
|
|
|
|
|
|
|
|
|
|
|
|
|
|
|
|
|
|
|
|
|
|||||
|
|
|
|
|
|
|
|
z |
|
|
Axis |
|
|
|
|
Plaque |
|||||||||||
|
|
|
|
|
|
|
|
|
|
|
|
|
|||||||||||||||
|
|
|
|
|
|
|
|
|
|
|
|
|
|||||||||||||||
|
|
|
|
|
|
|
|
|
|
|
|
|
|
|
|
|
|
|
|
|
|
|
|||||
|
|
|
|
|
|
|
|
|
|
|
|
|
(i) Physiological Post-PTCA |
|
|
|
|
|
|
|
|
|
|||||
|
|
|
|
|
|
|
|
Guidewire Surface |
|
|
|
|
|
|
|
|
|
||||||||||
|
|
|
6.0 |
|
|
|
|
|
|
3.0 |
|
|
|
1.5 |
|
|
|
||||||||||
|
|
|
|
|
|
|
|
|
|
|
|
|
|
||||||||||||||
|
|
|
|
|
|
|
|
|
|
|
|
|
|
|
|
|
|
|
|
|
|||||||
R1.5 |
|
r |
|
|
|
|
|
|
|
|
|
|
|||||||||||||||
|
|
|
|
|
Axis |
|
|
|
|||||||||||||||||||
|
|
|
|
|
|
|
|
z |
|
|
Plaque |
||||||||||||||||
|
|
|
|
|
|
|
|
|
|
||||||||||||||||||
|
|
|
|
|
|
|
|
|
|
|
|
|
|
|
|
|
|
|
|
|
|
|
|
|
|||
|
|
|
|
|
|
|
|
|
|
|
|
|
(ii) Post-PTCA with 0.35 mm gw |
|
|
|
|
|
|
|
|||||||
|
|
|
|
|
|
|
|
Guidewire Surface |
|
|
|
|
|
|
|
|
|
||||||||||
|
|
|
6.0 |
|
|
|
|
|
|
3.0 |
|
|
|
1.5 |
|
|
|
||||||||||
|
|
|
|
|
|
|
|
|
|
|
|
|
|
||||||||||||||
|
|
|
|
|
|
|
|
|
|
|
|
|
|
|
|
|
|
|
|
|
|
||||||
R1.5 |
|
r |
|
|
|
|
|
|
|
|
|
|
|
|
|
|
|
|
|
|
|
|
|||||
|
|
|
|
|
|
|
|
|
|
|
|
|
|
Axis |
|
|
|
||||||||||
|
|
|
|
|
|
|
|
|
|
|
|
|
|
|
|
|
|
|
|
||||||||
|
|
|
|
|
|
|
|
z |
|
|
Plaque |
||||||||||||||||
|
|
|
|
|
|
|
|
|
|
|
|
|
|
|
|
|
|
|
|
|
|
|
|
|
|||
|
|
|
|
|
|
|
|
|
|
|
|
|
(iii) Post-PTCA with 0.46 mm gw |
|
|
|
|||||||||||
|
|
|
|
|
|
|
|
Catheter Surface |
|
|
|
|
|
|
|
|
|
||||||||||
|
|
|
6.0 |
|
|
|
|
|
|
3.0 |
|
|
|
1.5 |
|
|
|
||||||||||
|
|
|
|
|
|
|
|
|
|
|
|
|
|
|
|||||||||||||
|
|
|
|
|
|
|
|
|
|
|
|
|
|
|
|
|
|
|
|
|
|
|
|
|
|
|
|
R1.5 |
|
r |
|
|
|
|
|
|
|
|
|
|
|
|
|
|
|
|
|
|
|
|
|||||
|
|
|
|
|
|
|
|
|
|
|
|
|
|
Axis |
|
|
|
||||||||||
|
|
|
|
|
|
|
|
|
|
|
|
|
|
|
|
|
|
|
|
|
|
|
|
||||
|
|
|
|
|
|
|
|
z |
|
|
Plaque |
||||||||||||||||
|
|
|
|
|
|
|
|
|
|
|
|
|
|
|
|
|
|
|
|
|
|
|
|
|
|||
|
|
|
|
|
|
|
|
|
|
|
|
|
(iv) Post-PTCA with large angioplasty catheter |
|
|
|
|||||||||||
R0.175 
R0.23
R0.7
Figure 7. (a) Stenoses geometries with guidewire inserted: Pre-PTCA; (b): Stenoses geometries with guidewire inserted: Intermediate; (c) Stenoses geometries with guidewire inserted: Post-PTCA.
Figure 8. Mean pressure drop Dp~ versus mean flow rate
~ in pre-PTCA, intermediate, and post-PTCA lesion
Q
with (0.35 and 0.46 mm) and without guidewire.
|
50 |
|
|
|
|
|
|
|
|
A |
|
48 |
|
|
|
|
|
|
|
|
|
|
46 |
|
|
|
|
|
|
|
|
B |
|
44 |
|
|
|
|
|
|
|
|
|
|
|
|
|
|
|
|
|
|
|
|
|
42 |
|
|
|
|
|
|
|
|
|
|
40 |
|
|
|
|
|
|
|
|
|
, mmHg |
38 |
|
|
|
|
|
|
|
|
|
36 |
|
|
|
|
J |
|
|
|
C |
|
34 |
|
|
|
|
|
|
|
|
||
32 |
|
|
|
|
|
|
|
|
|
|
~ p |
30 |
|
|
|
|
|
|
|
|
|
∆ |
|
|
|
|
|
|
|
|
|
|
drop |
28 |
|
|
|
|
|
|
|
|
|
26 |
|
|
|
|
|
|
|
|
D |
|
24 |
|
|
|
|
|
|
|
|
||
Pressure |
|
|
|
|
|
|
|
|
E |
|
22 |
|
|
|
|
|
|
|
|
||
|
|
|
|
|
|
|
|
|
||
20 |
|
|
|
|
|
|
|
|
F |
|
18 |
|
|
|
|
|
|
|
|
||
|
|
|
|
|
|
|
|
|
||
16 |
|
|
|
|
|
|
|
|
|
|
Mean |
|
|
|
|
|
|
|
|
|
|
14 |
|
|
|
|
|
|
|
|
G |
|
12 |
|
|
|
|
|
|
|
|
||
|
|
|
|
|
|
|
|
|
H |
|
|
10 |
|
|
|
|
|
|
|
|
|
|
|
|
|
|
|
|
|
|
I |
|
|
8 |
|
|
|
|
|
|
|
|
|
|
|
|
|
|
|
|
|
|
|
|
|
6 |
|
|
|
|
|
|
|
|
|
|
4 |
|
|
|
|
|
|
|
|
|
|
2 |
|
|
|
|
|
|
|
|
|
|
0 |
10 |
20 |
30 |
40 |
|
60 |
70 |
80 |
90 100110 120 130 140150160 170 180 190200 |
|
0 |
50 |
~
Mean Flow Rate Q , mL min–1
min–1
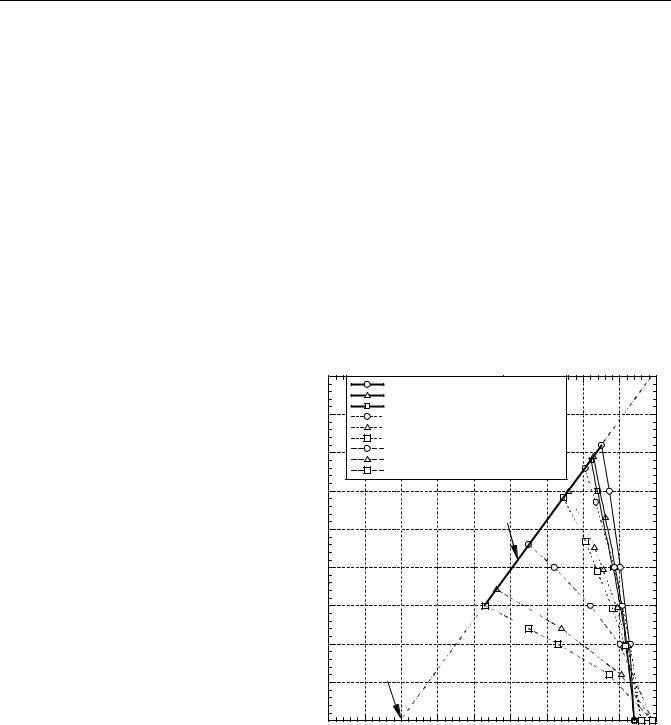
|
|
|
|
|
|
|
|
CORONARY ANGIOPLASTY AND GUIDEWIRE DIAGNOSTICS |
357 |
|||||||||||
Table 2. Hyperemic Mean Pressure Gradients D p~gh and Distal Mean Pressure p~rh Before, Intermediate, and After |
||||||||||||||||||||
Intervention with Guidewirea |
|
|
|
|
|
|
|
|
|
|
|
|
|
|
||||||
|
|
|
|
|
|
|
Guidewire size: di ¼ 0.35 mm |
|
|
|
|
|
|
|
Guidewire size: di ¼ 0.46 mm |
|
|
|||
Lesion |
p~ , mmHg |
|
|
di |
|
~ |
1 D p~ , mmHg |
p~ , mmHg |
|
|
di |
|
~ |
1 |
D p~ |
mmHg |
p~ |
mmHg |
||
|
a |
|
|
dm |
Qgh mL min |
gh |
rh |
|
|
dm |
Qgh; |
mL min |
gh; |
|
rh; |
|
||||
Before-PTCA |
89 |
|
0.37 |
86.0 |
43.0 |
46.0 |
|
0.48 |
|
75.0 |
46.0 |
|
43.0 |
|||||||
Intermediate |
86 |
|
0.26 |
149.7 |
18.9 |
65.8 |
|
0.34 |
|
145.6 |
20.2 |
|
64.5 |
|||||||
After-PTCA |
84 |
|
0.19 |
172.5 |
9.9 |
72.8 |
|
0.26 |
|
170.0 |
10.6 |
|
72.1 |
|||||||
aValues obtained from linear CFR-p~rh curve.
intermediate and residual lesions with and without guidewire (22–26). The ratio of guidewire diameter di to throat diameter dm for different stenoses are given in Table 2. From Tables 1 and 2, overall guidewires of size 0.35 and 0.46 mm caused 30–45% overestimation in Dp~h in the three stenoses as hyperemic flow was reduced by 5–37% from the physiologic condition without guidewire obstruction. While diagnosis of severely blocked arteries is relatively easier and additional pressure drop due to the guidewire does not affect the diagnosis that much, it can be seen that additional pressure drop due to the guidewire could have an important role in clinical evaluation of moderate and intermediate stenoses. Further, it can be seen that with guidewire of size 0.35 and 0.46 mm,
FFRmyog < FFRmyo and CFRg < CFR at hyperemia. The maximum decrease was observed in the native stenoses.
The residual stenoses (i.e., post-PTCA) showed the least decrease. In summary, Fig. 8 shows the mean pressure drop from basal to hyperemic for the three stenoses with and without 0.35 and 0.46 mm guidewire.
Figure 9 shows the maximal CFR p~rh for the native, intermediate, and residual lesions after angioplasty with and without guidewire (27). Distal mean perfusion pressure for hyperemic flow p~rh increased from 55 mmHg in pre-PTCA without guidewire to 75 mmHg (9.99 kPa) in post-PTCA without guidewire. A p~rh of 55 mmHg (7.33 kPa) is indicative of subendocardium ischemia.
Extrapolation of the nearly linear CFR p~rh relation toward its origin gave a zero-coronary flow mean pressure (p~zf ) of 20 mmHg (2.66 kPa). This value is near a measured value (32) of 18 mmHg (2.39 kPa), where myocardial blood flow ceased in the subendocardium layer of dog hearts, which were maximally dilated by infusion of adenosine.
FFRmyo-FFRmyo-g and CFR–CFRg Correlations
Table 3 provides the values of CFR, CFRg, FFRmyo, and FFRmyog for the different stenosis configurations (27). Figures 10 and 11 show the correlation plots between
Figure 9. Relative mean coronary flow rate increase
ð~ ~ Þ versus distal mean coronary pressure ~ before
Q=Qb pr
and after intervention. The maximum vasodilationdistal perfusion pressure relation (CFR- ~prh) is shown by the nearly linear solid line.
|
4.5 |
|
4.0 |
b |
3.5 |
~ |
|
/Q |
|
~ |
|
Q |
|
increase, |
3.0 |
|
|
flow |
2.5 |
|
|
coronary |
2.0 |
|
|
Mean |
1.5 |
|
|
|
1.0 |
|
0.5 |
|
0.0 |
0
Post-PTCA without guidewire
Post-PTCA with 0.35 mm guidewire
Post-PTCA with 0.46 mm guidewire
Intermediate lesion without guidewire
Intermediate lesion with 0.35 mm guidewire
Intermediate lesion with 0.46 mm guidewire
Pre-PTCA without guidewire
Pre-PTCA with 0.35 mm guidewire
Pre-PTCA with 0.46 mm guidewire
~ |
|
|
|
|
|
|
|
|
|
|
|
|
|
|
|
|
|
|
|
|
|
|
|
|
|
|
|
|
|
|
|
CFR-prh |
Linear curve: |
|
|
|
|
|
|
|
|
|
|
|
|||
|
|
|
|
|
|
|
|
|
|
|
|||||
|
~ |
- 1.296, R |
2 |
= 0.99 |
|
|
|
|
|
|
|
||||
CFR=0.065 × prh |
|
|
|
|
|
|
|
|
|||||||
|
|
|
|
|
|
|
|
|
|
|
|
|
|
|
|
|
|
|
|
|
|
|
|
|
|
|
|
|
|
|
|
|
|
|
|
|
|
|
|
|
|
|
|
|
|
|
|
|
|
|
|
|
|
|
|
|
|
|
|
|
|
|
|
|
|
|
|
|
|
|
|
|
|
|
|
|
|
|
|
|
|
|
|
|
|
|
|
|
|
|
|
|
|
|
|
|
|
|
|
|
|
|
|
|
|
|
|
|
|
|
|
|
|
|
|
|
|
|
|
|
|
|
|
|
|
|
|
|
|
|
|
|
|
|
|
|
|
|
|
|
|
|
|
|
|
|
|
|
|
|
|
|
|
|
|
|
|
|
|
~ |
= 20 mmHg |
|
|
|
|
|
|
|
|
pzf |
|
|
|
|
|
|
|
||
10 |
20 |
30 |
40 |
50 |
60 |
70 |
80 |
90 |
|
|
|
|
|
|
|
~ |
, mmHg |
|
|
|
|
Distal mean coronary pressure, pr |
|
|
|||||
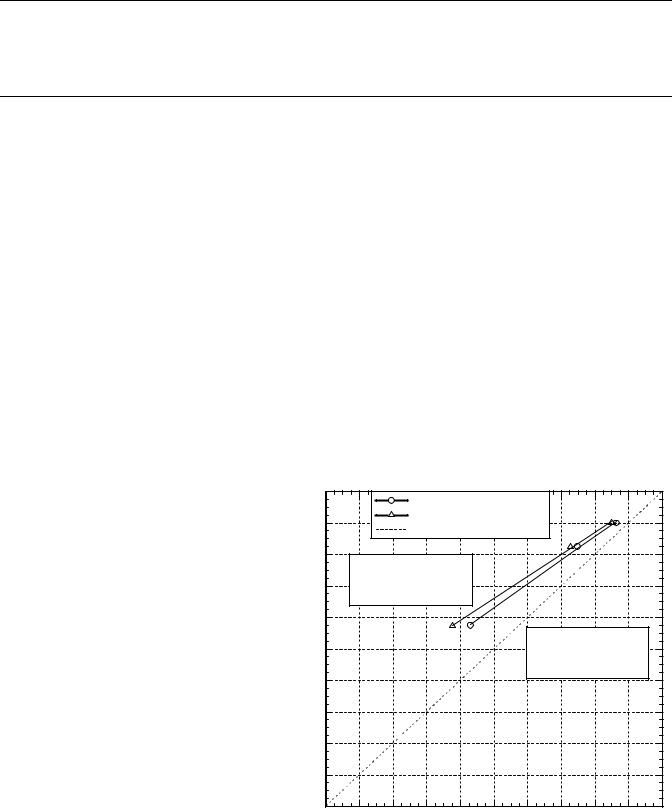
358 CORONARY ANGIOPLASTY AND GUIDEWIRE DIAGNOSTICS
Table 3. Effect of the Presence of Guidewire on the Values of CFR and FFRmyo at Hyperemic Conditions in Comparison to Values of CFR and FFRmyo Under Pathophysiological Condition for Different Guidewire Sizes di ¼ 0.35 mm (0.014 in.) and 0.46 mm (0.018 in.)a
|
Physiological |
|
|
|
|
0.35 mm Guidewire |
|
|
0.46 mm Guidewire |
|
|
|
|
|
|
|
|
|
|
|
|
Lesion |
CFR |
FFRmyo with p~v 0 |
CFRg |
FFRmyo-g with p~v 0 |
CFRg |
FFRmyo-g with p~v 0 |
||||
Before-PTCA |
2.3 |
0.62 |
|
1.72 |
0.52 |
|
1.50 |
0.48 |
||
Intermediate |
3.3 |
0.82 |
|
2.99 |
0.76 |
|
2.91 |
0.75 |
||
After-PTCA |
3.6 |
0.89 |
|
3.45 |
0.87 |
|
3.40 |
0.86 |
||
aFFRmyo-g is FFRmyo measured with guidewire.
CFR and CFRg, and between FFR and FFRg with their linear regression lines. In Fig. 10, CFR was related to
CFRg |
by the equation: with |
guidewire size |
0.46 mm, |
|||||
CFR |
¼ |
CFR |
g 0.689 |
þ 1.271 (R |
2 |
¼ 0.99), and |
with guide- |
|
|
||||||||
|
|
|
|
2 |
||||
wire size 0.35 mm, CFR ¼ CFRg 0.757 þ 1.004 (R ¼ 0.99). With central venous pressure (p~v) 0, as used in present clinical practice, FFRmyo and FFRmyog correlated equally
well (Fig. 11): with |
guidewire size 0.46 mm, FFR |
|||
|
2 |
|
myo ¼ |
|
FFR |
|
|
¼ 0.99), and with |
guidewire size |
myog 0.737 þ 0.263 (R |
|
2 |
||
0.35 mm, FFRmyo ¼ FFRmyog 0.790 þ 0.210 (R ¼ 0.99), |
||||
which gave FFRmyo ¼ 0.8 for a measured FFRmyog ¼ 0.75. The study showed that the correlations for FFR and CFR
for guidewire size 0.35 mm are closer to the ideal (expected) relationship, that is, CFR ¼ CFRg and FFR ¼ FFRg due to relatively lesser flow obstruction effect than guidewire size 0.46 mm.
Usefulness of FFRmyo-g-FFRmyo and CFR-CFRg Correlations
Though there are uncertainties associated with measurements of CFR with guidewires in diagnostic procedures as
these measurements are made distal to the stenosis, these corrections could be useful in measuring CFR and FFR simultaneously. This could provide useful information about the status of both the epicardial stenosis and distal microcirculation during the procedure. In light of this, CFR measurement proximal to the stenosis will be more accurate as this is the region of more stable flow. Further, the heterogeneity of stenoses could produce variations in the slope of the correlations. However, the correlations were obtained based on stenosis shape and size measured invasively by Wilson et al. (21) in a group of patients, and have shown a direct and stronger relation to the minimal stenosis area as compared to the overall length and shape of the stenosis. Further clinical evaluation with a larger patient group will be needed to confirm the dominant effect of minimal stenosis area on these correlations.
While several studies have focused on the relationship between CFR measured with guidewire and CFR measured with a noninvasive flow probe, for examples a Doppler cuff in animal studies, no similar study has been done to distinguish the effect of guidewire on FFRmyo as pressure
Figure 10. CFR versus CFRg correlation. Dotted line shows the ideal CFR versus CFRg relation.
|
4.0 |
|
|
With 0.35 mm guidewire |
|
|
|
|
|||
|
|
|
|
|
|
|
|
||||
|
3.6 |
|
|
With 0.46 mm guidewire |
|
|
|
|
|||
|
|
|
Ideal relation |
|
|
|
|
|
|
||
|
|
|
|
|
|
|
|
|
|
||
|
3.2 |
Guidewire 0.46 mm: |
|
|
|
|
|
|
|
||
|
|
|
|
|
|
|
|
|
|||
|
2.8 |
CFR = CFRg × 0.689 + 1.271 |
|
|
|
|
|
|
|||
|
R 2 = 0.99 |
|
|
|
|
|
|
|
|
||
|
|
|
|
|
|
|
|
|
|
||
|
2.4 |
|
|
|
|
|
|
|
|
|
|
CFR |
|
|
|
|
|
|
Guidewire 0.35 mm: |
|
|
||
2.0 |
|
|
|
|
|
CFR = CFRg × 0.757 + 1.004 |
|
||||
|
|
|
|
|
|
|
R2 = 0.99 |
|
|
|
|
|
1.6 |
|
|
|
|
|
|
|
|
|
|
|
1.2 |
|
|
|
|
|
|
|
|
|
|
|
0.8 |
|
|
|
|
|
|
|
|
|
|
|
0.4 |
|
|
|
|
|
|
|
|
|
|
|
0.0 |
|
|
|
|
|
|
|
|
|
|
|
0.0 |
0.4 |
0.8 |
1.2 |
1.6 |
2.0 |
2.4 |
2.8 |
3.2 |
3.6 |
4.0 |
CFRg
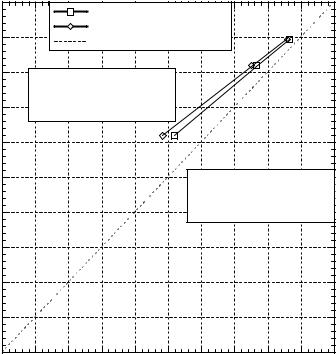
CORONARY ANGIOPLASTY AND GUIDEWIRE DIAGNOSTICS |
359 |
|
1.0 |
|
|
With 0.35 mm guidewire |
|
|
|
|
|||
|
|
|
|
|
|
|
|
||||
|
0.9 |
|
|
With 0.46 mm guidewire |
|
|
|
|
|||
|
|
|
Ideal relation |
|
|
|
|
|
|||
|
|
|
|
|
|
|
|
|
|||
|
0.8 |
Guidewire 0.46 mm: |
|
|
|
|
|
|
|
||
|
|
|
|
|
|
|
|
|
|||
|
|
FFRmyo = FFRmyo-g × 0.737 + 0.263 |
|
|
|
|
|
||||
|
0.7 |
R 2 = 0.99 |
|
|
|
|
|
|
|
|
|
myo |
0.6 |
|
|
|
|
|
|
|
|
|
|
|
|
|
|
|
|
|
|
|
|
|
|
FFR |
0.5 |
|
|
|
|
|
Guidewire 0.35 mm: |
|
|
||
|
|
|
|
|
|
|
FFRmyo = FFRmyo-g × 0.790 + 0.210 |
||||
|
0.4 |
|
|
|
|
|
R 2 = 0.99 |
|
|
|
|
|
0.3 |
|
|
|
|
|
|
|
|
|
|
|
0.2 |
|
|
|
|
|
|
|
|
|
|
|
0.1 |
|
|
|
|
|
|
|
|
|
|
|
0.0 |
|
|
|
|
|
|
|
|
|
|
|
0.0 |
0.1 |
0.2 |
0.3 |
0.4 |
0.5 |
0.6 |
0.7 |
0.8 |
0.9 |
1.0 |
FFRmyo-g
Figure 11. FFRmyo versus FFRmyog correlation (with
p~v 0). Dotted line shows the ideal FFRmyo versus FFRmyo-g relation.
can be measured invasively using guidewires only. Earlier In vitro measured Dp data reported by DeBruyne et al. (33) for steady flow of a saline solution through various blunt
hollow plug stenosis models (50–90% area |
stenosis; |
de ¼ dr ¼ 4 mm; lm ¼ 10 mm) with and without |
a small |
guidewire pressure sensor (di ¼ 0.38 mm) also indicated appreciable overestimation of the true Dp as the severity of stenoses increased. In particular, for a 90% area stenosis ([di/dm] ¼ 0.30) at a flow rate Q ¼ 120 mL min 1, the measured ratio (Dpg/Dp) increased by the factor 23/16 mmHg (3.06/2.13 kPa) ( 40%) due to the increased flow resistance with the guidewire spanning the model stenosis in the rigid plastic tube de ¼ 4 mm. Our detailed hemodynamic analysis in a smaller coronary vessel (de ¼ 3 mm; 90% area stenosis; larger ([di/dm] ¼ 0.48) also indicated significant increases in flow resistance with the guidewire present
(Tables |
1 and 2). Similarly, the stenosis resistance |
~ |
Rh, |
||
defined |
~ |
0.29 |
as (D ph=Qh), decreased considerably from |
to 0.04 mmHg mL min 1 from preto post-PTCA, respec-
~ |
decreased |
tively (27). With guidewire size 0.35 mm, Rhg |
|
from 0.5 for pre-PTCA to 0.06 for |
post-PTCA |
mmHg mL min 1 (27). While the 32 patient group in Wilson et al. (21) had normal microvascular function, the presence of microvascular impairment could produce different correlations between FFRmyo - FFRmyog and CFR– CFRg with epicardial stenoses, and could be the focus of future studies on guidewire effect and microcirculation.
BIBLIOGRAPHY
1.Dotter CT, Judkins MP. Transluminal treatment of arteriosclerotic obstruction. Description of a new technic and a preli-
minary report of its application. 1964. Radiology 1989;172:904– 920.
2.Baim DS. Percutaneous transluminal coronary angioplasty. Cardiac catheterization, angiography, and intervention. 5th ed. (MA): Williams & Wilkins; 2000. pp 537–580.
3.Dervan JP, McKay RG, Baim DS. The use of an exchange guide wire in coronary angioplasty. Cathet Cardiovasc Diagn 1985;11:207–212.
4.Pijls NH, et al. Measurement of fractional flow reserve to assess the functional severity of coronary-artery stenoses. N Engl J Med 1996;334:1703–1708.
5.Pijls NH, et al. Coronary thermodilution to assess flow reserve: validation in humans. Circulation 2002;105:2482–2486.
6.De Bruyne B, et al. Coronary thermodilution to assess flow reserve: experimental validation. Circulation 2001;104:2003– 2006.
7.Siebes M, et al. Single-wire pressure and flow velocity measurement to quantify coronary stenosis hemodynamics and effects of percutaneous interventions. Circulation 2004;109: 756–762.
8.Ernst SM, et al. Immediate sealing of arterial puncture sites after cardiac catheterization and coronary angioplasty using a biodegradable collagen plug: results of an international registry. J Am Coll Cardiol 1993;21:851–855.
9.Aker UT, et al. Immediate arterial hemostasis after cardiac catheterization: initial experience with a new puncture closure device. Cathet Cardiovasc Diagn 1994;31:228–232.
10.Gruentzig AR, Senning A, Siegenthaler WE. Nonoperative dilation of coronary artery stenosis: Percutaneous Transluminal Coronary Angioplasty. N Engl J Med 1979;301:61–68.
11.Ganz P, Harrington DP, Gaspar J, Barry WH. Phasic pressure gradients across coronary and renal artery stenoses in humans. Am Heart J 1983;106:1399–1406.
12.Ganz P, et al. Usefulness of transstenotic coronary pressure gradient measurements during diagnostic catheterization. Am J Cardiol 1985;55:910–914.