

The Physics of Coronory Blood Flow - M. Zamir
.pdf310 9 Basic Unlumped Models
|
|
|
|
q1 |
q2 |
|
1.1 |
|
|
|
|
|
1.05 |
|
|
|
|
|
1 |
|
|
|
|
flow |
0.95 |
|
q2 |
|
|
|
|
|
|
||
peak |
0.9 |
|
|
|
|
|
|
|
|
|
|
normalized |
0.85 |
|
|
|
|
0.8 |
|
q1 |
|
|
|
|
|
|
|
||
0.75 |
|
|
|
|
|
|
|
|
|
|
|
|
0.7 |
|
|
|
|
|
0.65 |
|
|
|
|
|
0 |
1 |
2 |
3 |
4 |
|
|
|
tree level |
|
|
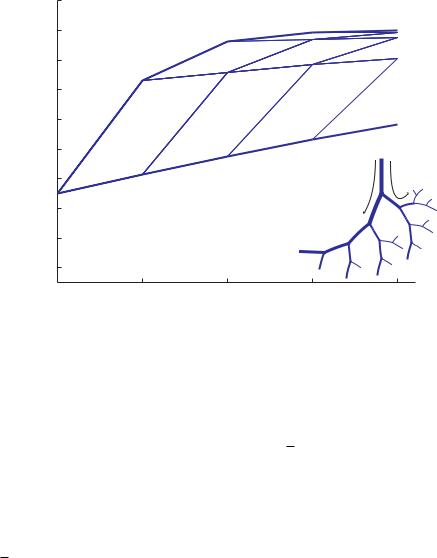
Fig. 9.3.3. Normalized peak flow rates reached at di erent branch segments of the 5-level tree shown in the inset. A value of 1.0 represents a peak flow equal to that in steady flow. This value is reached more rapidly along the bounding path marked q2 consisting of branch segments with the smaller radii, and more slowly along the other path, marked q1. Other lines represent values of the peak flow along other paths within the tree structure.
Fig. 9.3.3 indicate that peak flows reach the Poiseuille flow values more rapidly along the bounding path with the smaller branch segments than they do along the path with the larger branch segments. The reason for this is that the oscillatory flow profile is a more complete Poiseuille profile at smaller values of the frequency parameter Ω, which are reached more rapidly along the path with the smaller branch segments.
Another flow property of particular interest is the oscillatory shear stress τφ exerted by the fluid on the tube wall and defined by
τφ(t) = −μ |
∂uφ(r, t) |
(9.3.9) |
∂r |
||
|
|
r=a |
Using the solution for uφ(r, t) in Eq. 8.5.11, and noting that

9.3 Pulsatile Flow in Rigid Branching Tubes |
311 |
|
1.05 |
|
|
|
|
|
1 |
|
|
|
|
stress |
0.95 |
|
τ2 |
|
|
|
|
|
|
||
0.9 |
|
|
|
|
|
shear |
|
|
|
|
|
0.85 |
|
|
|
|
|
peak |
0.8 |
|
|
q a3 |
|
|
τ1 |
τ1 |
τ2 |
||
normalized |
|
|
|
||
0.75 |
|
|
|
|
|
0.7 |
|
|
|
|
|
0.65 |
|
|
|
|
|
|
|
|
|
|
|
|
0.6 |
|
|
|
|
|
0 |
1 |
2 |
3 |
4 |
|
|
|
tree level |
|
|
Fig. 9.3.4. Normalized peak shear stress reached at di erent branch segments of the 5-level tree shown in the inset. A value of 1.0 represents a peak shear stress equal to that in steady flow. This value is reached more rapidly along the bounding path marked τ2 consisting of branch segments with the smaller radii, and more slowly along the other path, marked τ1. Other lines represent values of the peak flow along other paths within the tree structure. The results are based on the cube law relation between flow rate and vessel radius, q aγ , γ = 3.0, as indicated in the inset.
dJ0(ζ) |
= −J1(ζ) |
(9.3.10) |
dζ |
we find
τφ(t) |
= |
2 |
|
J1(Λ) |
eiωt |
(9.3.11) |
τs |
Λ |
|
J0(Λ) |
where τs is the constant shear stress in steady Poiseuille flow in a tube of radius a under a pressure gradient ks, which is given by
τs = |
−ksa |
(9.3.12) |
|
2 |
|||
|
|
Within each oscillatory cycle the normalized shear stress reaches a peak value given by
| |
τφ(t) |
| = |
|
2 |
|
J1(Λ) |
|
(9.3.13) |
τs |
Λ |
J0(Λ) |
||||||
|
|
|
|
|
|
|
|
|
|
|
|
|
|
|
|
|
|

312 9 Basic Unlumped Models
|
1.05 |
|
|
|
|
|
1 |
|
τ2 |
|
|
|
|
|
|
|
|
stress |
0.95 |
|
|
|
|
0.9 |
|
|
|
|
|
shear |
|
|
|
|
|
0.85 |
|
τ1 |
q a2 |
|
|
|
|
|
|||
peak |
0.8 |
|
|
τ1 |
τ2 |
|
|
|
|
|
|
normalized |
0.75 |
|
|
|
|
0.7 |
|
|
|
|
|
0.65 |
|
|
|
|
|
|
|
|
|
|
|
|
0.6 |
|
|
|
|
|
0 |
1 |
2 |
3 |
4 |
|
|
|
tree level |
|
|
Fig. 9.3.5. Normalized peak shear stress reached at di erent branch segments of the 5-level tree shown in the inset, as in Fig. 9.3.4, but here the results are based on a power law index γ = 2.0.
Because of the way it is normalized the value of the peak shear stress is expressed as a fraction of the constant shear stress in steady Poiseuille flow. Thus, a normalized value of 1.0 represents peak oscillatory shear stress equal to that in Poiseuille flow. The distribution of peak shear stress within the 5-level tree is shown in Fig. 9.3.4. It is similar to that of peak flow rate, as would be expected, because shear stress is high at high flow rates and low at low flow rates.
We recall that in steady flow, a cube law relation between vessel radius and flow rate, namely q a3, ensures a constant shear stress throughout the tree structure, as illustrated in Section 9.2. This is not the case in pulsatile flow, as we see in Fig. 9.3.4 where the results are based on the cube law. Other values of the power law index, namely γ = 2.0 and γ = 4.0, produce similar results as shown in Figs. 9.3.5, 6. The reason for this is that in steady flow the shear stress depends on the ratio of flow rate over the third power of the radius (Eq. 8.4.32), while in pulsatile flow the corresponding relation is not as simple [221].
9.4 Elastic Branching Tubes |
313 |
|
1.05 |
|
|
|
|
|
1 |
|
|
|
|
stress |
0.95 |
|
τ2 |
|
|
|
|
|
|
||
0.9 |
|
|
|
|
|
shear |
|
|
|
|
|
0.85 |
|
|
|
|
|
peak |
0.8 |
|
|
q a4 |
|
|
|
|
|
||
|
|
|
τ1 |
τ2 |
|
normalized |
0.75 |
|
τ1 |
||
|
|
|
|||
|
|
|
|
||
0.7 |
|
|
|
|
|
0.65 |
|
|
|
|
|
|
|
|
|
|
|
|
0.6 |
|
|
|
|
|
0 |
1 |
2 |
3 |
4 |
|
|
|
tree level |
|
|
Fig. 9.3.6. Normalized peak shear stress reached at di erent branch segments of the 5-level tree shown in the inset, as in Fig. 9.3.4, but here the results are based on a power law index γ = 4.0.
9.4 Elastic Branching Tubes
Results for pulsatile flow in an elastic tube discussed in Section 8.6 indicate that when the wave-length-to-tube-length ratio, λ = λ/L, is of the order of 100 or greater, the basic characteristics of the flow are nearly the same as those of pulsatile flow in a rigid tube. In particular, the oscillatory velocity profiles in the elastic tube (Fig. 8.6.4) and the wave form of the oscillatory flow rate (Fig. 8.6.5) are very close to those in a rigid tube. In the human coronary circulation the length of a main coronary artery may be between 5 and 10 cm, while the length of the propagating wave is between 5 and 10 m. Thus, λ 100 is a good estimate of the order of magnitude of the wave-length- to-tube-length ratio in the coronary circulation. However, the length λ of a propagating wave is related to the wave speed c and the angular frequency ω by
λ = |
2πc |
(9.4.1) |
|
ω |
|||
|
|
Thus, at a fundamental frequency of 1 Hz, or ω = 2π radians/s, the wave length is directly related to the wave speed. If the wave speed can be assumed

314 9 Basic Unlumped Models
|
|
|
|
|
c1 |
c2 |
|
1 |
|
|
|
|
|
(normalized) |
0.8 |
|
|
|
|
|
0.6 |
|
|
|
|
|
|
speed |
|
|
c1 |
|
|
|
|
|
|
|
|
||
0.4 |
|
|
|
|
|
|
of wave |
|
|
|
|
|
|
0.2 |
|
|
|
|
|
|
real part |
|
|
|
|
|
|
|
|
c2 |
|
|
|
|
0 |
|
|
|
|
|
|
|
0 |
2 |
4 |
6 |
8 |
10 |
|
|
|
|
tree level |
|
|
Fig. 9.4.1. The real part of the wave speed, normalized in terms of the MoenKorteweg wave speed c0, in a vascular tree model in which the root segment has approximately the same diameter (4 mm) as a main coronary artery in the human heart and in which subsequent branching follows the cube law with power law index γ = 3.0 as described in Section 8.4 and bifurcation index α = 0.7. The two bounding paths marked c1, c2 in the tree model are singular paths along which the branch with the larger diameter is followed at each junction in one case (c1), and the branch with the smaller diameter is followed in the second (c2). They represent two paths along which the real part of the wave speed decreases most slowly (c1), or most rapidly (c2), as indicated on the graph. Everywhere else within the tree structure the value of the real part of the wave speed is bound by these two curves. Thus, since the normalized values are everywhere less than 1.0, the figure indicates that the wave speed is everywhere lower than the Moen-Korteweg wave speed.

9.4 Elastic Branching Tubes |
315 |
|
|
|
|
|
c1 |
c2 |
(normalized) |
1 |
|
|
|
|
|
0.8 |
|
|
|
|
|
|
|
|
|
|
|
|
|
wave speed |
0.6 |
|
|
|
|
|
0.4 |
|
|
c1 |
|
|
|
part of |
0.2 |
|
|
|
|
|
imaginary |
0 |
|
|
c2 |
|
|
|
|
|
|
|
||
|
|
|
|
|
|
|
|
0 |
2 |
4 |
6 |
8 |
10 |
|
|
|
|
tree level |
|
|
Fig. 9.4.2. The imaginary part of the wave speed associated with the real part shown in Fig. 9.4.1. Since the Moen-Korteweg wave speed is purely real, it follows that the wave speed here is di erent from the Moen-Korteweg wave speed everywhere along the tree structure, consistent with the results in Fig. 9.4.1. Remaining caption is the same as in that figure.
constant throughout the coronary circulation, the same assumption can be made about the wave length, and the above estimate of λ 100 can be used throughout. However, in Section 8.6 we saw that the value of the wave speed actually depends on the frequency parameter Ω such that when Ω > 3 the wave speed can indeed be assumed constant and equal to the Moen-Korteweg wave speed c0 (Eq. 8.6.1), but when Ω < 3 the wave speed departs significantly from this value. In fact, its value becomes complex, with real and imaginary parts depending on the value of Ω as shown in Fig. 8.6.2. Now, values of Ω in the coronary arterial tree were estimated in Section 9.3 and are shown in Figs. 9.3.1, 2. It is seen in these two figures and in Fig. 8.6.2 that the coronary circulation lies entirely in the region Ω < 3 where the wave speed is certainly not constant and not equal to the Moen-Korteweg wave speed c0. Therefore, in a model of the coronary circulation consisting of elastic tubes, it is necessary to map out the values of c within the tree structure on which the model is based. To do so, the value of Ω for each vessel segment in that model must be used to calculate the corresponding value of c according to the solution for

316 9 Basic Unlumped Models
pulsatile flow in an elastic tube as was done in Section 8.6. Results, using the 11-level tree model as an example, are shown in Figs.9.4.1,2 where the real and the imaginary parts of the wave speed are shown normalized in terms of the Moen-Korteweg wave speed c0.
|
260 |
|
|
|
|
|
length ratio |
250 |
λ2 |
|
|
|
|
|
|
|
|
|
||
240 |
|
λ1 |
|
λ1 |
λ2 |
|
- |
|
|
|
|
|
|
-tube |
|
|
|
|
|
|
230 |
|
|
|
|
|
|
-to |
|
|
|
|
|
|
wave-length |
220 |
|
|
|
|
|
210 |
|
|
|
|
|
|
|
2000 |
2 |
4 |
6 |
8 |
10 |
|
|
|
|
tree level |
|
|
Fig. 9.4.3. The ratio of wave length to tube length (λ = λ/L) for vessel segments along the same 11-level tree model used in Fig. 9.4.1 and using values of the wave speed shown in that figure. The two bounding paths marked λ1 and λ2 correspond to those marked c1, c2 in Fig. 9.4.1 and have the same interpretation. The figure
indicates that the value of λ is significantly above 100 everywhere along the tree structure, which means that the e ects of wave propagation on flow within individual vessel segments is minimal if wave reflections are absent. Because of the large number of vessel junctions, however, wave reflections are ubiquitous and their e ects on pressure and flow within the tree structure must be calculated.
At the root segment of this tree model, in which the root segment has approximately the same diameter (4 mm) as a main coronary artery in the human heart, the real part of the wave speed is below the normalized value of 1.0, which means that it is below the Moen-Korteweg value. Thereafter, at smaller and smaller branch segments, the wave speed continues to decrease in value, more rapidly along the bounding path with the smaller branches. Similarly, the imaginary part of the wave speed, is above zero everywhere along the tree

9.5 E ective Impedance, Admittance |
317 |
structure, which means that the wave speed is complex and hence di erent from c0 everywhere along the tree structure.
Based on these values of c, the wave-length-to-tube-length ratio can be calculated for each vessel segment using the radii and lengths of vessel segments prescribed in the model. In particular, the model assumes that the hierarchy of radii at di erent levels of the tree follows the cube law as described earlier (Section 8.4), and that the length-to-diameter ratio for each vessel segment is 10. Thus, at a fundamental frequency of 10 Hz, or ω = 2π radians/s, from Eq. 9.4.1 we have
|
= |
λ |
|
(9.4.2) |
|
λ |
|||||
L |
|||||
|
|
|
|||
= |
|
c |
(9.4.3) |
||
|
|||||
10 × d |
|||||
Results are shown in Fig. 9.4.3 where it is seen that, based on this model, values of λ would be well above 100 throughout the coronary circulation. From these results, therefore, it would seem that the model of pulsatile flow in branching rigid tubes considered in Section 9.3 should be a good model for pulsatile flow in the coronary circulation. This is decidedly not the case, however, because pulsatile flow in an elastic tube is characterized by wave propagation, a phenomenon which does not (cannot) arise in a rigid tube. The only exception to this, as mentioned previously, is when the fluid is compressible, which is not under consideration here. Wave propagation is a critically important element in any model of pulsatile flow in an elastic tube not only because of the di erent patterns of flow that it brings with it, namely those described in Sections 8.5 and 8.6, but because wave propagation brings the prospect for wave reflections.
9.5 E ective Impedance, Admittance
From a functional standpoint, the e ects of wave reflections in a tube or vascular tree can be thought of in terms of the way they a ect the opposition to flow. The term “opposition” is used here deliberately because the opposition to pulsatile flow in the presence of wave reflections is neither pure “resistance” as it is in steady flow, nor pure “impedance” as it is in oscillatory flow in a rigid tube. In fact, the opposition to pulsatile flow in the presence of wave reflections is best described by a modified impedance usually referred to as “e ective” impedance. The pure impedance in oscillatory flow in a rigid tube is then renamed “characteristic impedance” to di erentiate between the two. Thus, the di erence between the characteristic impedance and the e ective impedance in a tube or vascular tree is a direct and functionally meaningful measure of the e ects of wave reflections.
In general, opposition to flow is defined in terms of the amount of flow produced by a given amount of driving pressure. More specifically, in steady

318 9 Basic Unlumped Models
Poiseuille flow the ratio of pressure di erence driving the flow to flow rate is termed the “resistance” to flow, as discussed in Section 2.4. In oscillatory flow, if the driving pressure and the flow rate are simple harmonic (sine or cosine) functions, the ratio of the amplitudes of pressure over flow is termed the “impedance” as discussed in Section 4.9.
The resistance in steady Poiseuille flow in a tube depends on only static properties of the tube and of the fluid (Eq. 2.4.4). The impedance in oscillatory flow through a rigid tube (hence in the absence of wave propagation and the potential for wave reflections) depends on static properties of the tube and of the fluid as well as on the frequency of oscillation (Eqs.4.9.8,11). The impedance in oscillatory flow through an elastic tube, where flow is characterized by wave propagation and the potential exists for wave reflections, depends on static properties of the tube and of the fluid as well as on the frequency of oscillation, as in a rigid tube, but now also on the extent of wave reflection e ects if any. Now, wave reflection e ects depend on the properties of a reflection site at the downstream end of a tube or many reflection sites far downstream in a vascular tree structure, and in both cases the e ects depend critically on the frequency of oscillation or more accurately on the ratios of wave lengths to tube lengths as we saw in Section 8.7. As mentioned earlier, in order to distinguish between impedance to flow when these added wave reflection e ects are absent or when they are present, the term “characteristic impedance” is used for the first and “e ective impedance” is used for the second.
From a solution of the wave equations for pressure and flow, an input oscillatory pressure of the form
pin(t) = p0eiωt |
(9.5.1) |
in the absence of wave reflections, leads to a pressure wave and a flow wave within the tube, of the form
P (x, t) = p0eiω(t−x/c) |
(9.5.2) |
||||
Q(x, t) = q0eiω(t−x/c) |
(9.5.3) |
||||
q0 |
= Y0p0 |
(9.5.4) |
|||
Y0 |
= |
πa2 |
|
(9.5.5) |
|
ρc |
|||||
|
|
|
|||
where a is tube radius, ρ is fluid density and c is wave speed which is assumed constant within the tube. It is seen that
Y0 = q0 (9.5.6) p0
= |
Q(0, t) |
(9.5.7) |
||
|
P (0, t) |
|
||
|
|
|
||
The name “admittance” for Y0 is thus appropriate as it represents a measure of the amount of oscillatory flow which the tube “admits” for a given oscillatory
