

Visual CSharp 2005 Express Edition (2006) [eng]
.pdfChapter 6
Figure 6-1
Figure 6-2
84

Debugging Applications in C# Express
Break Mode versus Executing Mode
There will be times when you will need to stop, or pause, code as it is executing. When you are doing it to debug the code and plan on continuing the execution, then the code is placed in break mode. Once in break mode, there are a number of ways you can research various issues with the code and examine various aspects of your application, including examining and manipulating variables. Another task you can accomplish is fixing those semantic and logical errors mentioned before. Remember how they don’t show up on the error list? Well, break mode is one of the best ways to find these errors. Break mode enables you to go step-by-step through your program and watch the code working. Several tools are available to you in break mode.
The remainder of this chapter introduces the various tools that you have at your disposal for debugging your applications. You can cause the application to go into break mode several ways. The way that you will probably use the most is by setting breakpoints. These are discussed in the next section in greater detail.
The other way is to move into the editor and choose Debug Break All from the menu. When this happens you will then be taken to the editor in break mode, with the line of code the application is breaking on highlighted in green.
Try It Out |
Put the Application into Break Mode Using the Menus |
Using the application you created in the last Try It Out:
1.Drag and drop another button onto the form.
2.Type btnBreakUsingMenus for the Name property, Breach Using Menus for the Text property.
3.Double-click the button you added. The routine for the Click event will be created as shown here:
private void btnBreakUsingMenus_Click(object sender, EventArgs e)
{
}
4.Type the following line of code to add a command that will cause the application to pause:
MessageBox.Show(“Break Me”);
5.Press F5 to build and execute the application.
6.Click the new button you created.
7.Switch back to the editor.
8.Choose Debug Break All from the menu. The code will break and display the last line it was on, in this case the line of code with the MessageBox.Show() method was called. You can see this in Figure 6-3.
9.At this point, you can press F5 to continue executing the application or quit by pressing Shift+F5.
While it is nice to be able to break into the application whenever you need to, it can get kind of hard to break it exactly at the right spot where you want it to break. C# Express provides other ways to break into your application. The main way is by using breakpoints.
85

Chapter 6
Figure 6-3
Working with Breakpoints
When you add breakpoints in your application, you are specifying which lines of code you want to have the program stop on. The great thing about breakpoints is that you can toggle them on and off as your need them for debugging purposes in just about anyplace in the code. With breakpoints you can:
Set breakpoints. While in the code file, either in editing or break mode, you can set breakpoints a number of ways, all of them able to toggle the breakpoints on and off: pressing F9, choosing Debug Toggle Breakpoint, or clicking the left mouse button in the gray gutter on the left-hand side of the window. No matter how you set the breakpoints, a red circle will appear in the gutter, and the whole line will be highlighted in red.
Delete Breakpoint. While you can toggle using the different methods described, you also can right-click the left gutter and choose Delete Breakpoint.
Disable Breakpoints. Disabling breakpoints enables you to keep a breakpoint in the program, but not have it run. For example, say you are testing a piece of code a few times and want
the code to run through a couple times in between without having to reset the breakpoints,. You can disable a breakpoint by right-clicking the breakpoint in the gutter and choose Disable Breakpoint from the menu. If in the highlighted breakpoint line, you can then choose Breakpoint Disable Breakpoint.
You can see a couple of breakpoints set in Figure 6-4.
86

Debugging Applications in C# Express
Figure 6-4
Edit and Continue Feature in C# Express
One exciting feature in C# Express is the ability to edit your application in break mode and then continue on with executing your application. This is exciting because in the past whenever you had to edit your program in break mode, Visual Studio would have to reset the application and you would have to rerun it.
In Figure 6-4, you can see that the following code
int intTest1 = 3; int intTest2 = 5;
TestRoutine1(intTest1 + intTest2);
87

Chapter 6
was passing 3+5 to TestRoutine1. If you decided mid-execution you wanted change it to be
TestRoutine1((intTest1 + intTest2)*3);
you would do this by setting a breakpoint on the line of code calling TestRoutine1. When you execute the program and it halts on that line of code, you can just change the line of code as needed. Once the line of code is changed, you could then press F5 to continue. Once F5 is pressed, a dialog box, as shown in Figure 6-5 appears, asking if you want to have Edit and Continue apply the changes to the code.
Click Yes and the code continues executing with the most current changes. Answer No and the program continues on, but with the code as it was before changes at runtime.
Figure 6-5
88
Debugging Applications in C# Express
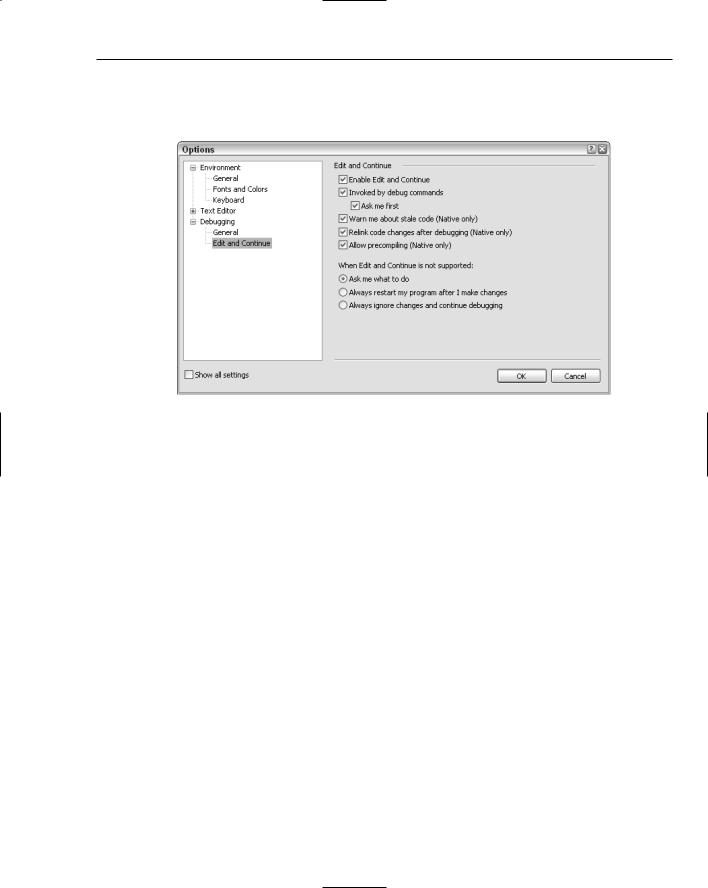
You have a lot of options for how you can use Edit and Continue, and the way to see those options is to choose Tools Options. Then click the Edit and Continue option under Debugging. When you click these options, the options appear, as shown in Figure 6-6.
Figure 6-6
Now take some time to look through them and experiment a bit. Then we will discuss displaying and modifying the contents of variables.
Displaying and Modifying Variables when in Break Mode
While in break mode, besides being able to view what part of the code you are in, there are a number of ways that you can view and even modify the variables in your applications. The quickest way to look at variables is to use a feature that is also used for other purposes in the C# Express IDE, called IntelliSense.
Using IntelliSense
One of the ways to use IntelliSense is, when in break mode, placing the mouse over a variable. This feature goes along with other IntelliSense features such as displaying classes, properties, and methods as you are typing the name of the objects in code.
Once you have the mouse over the variable, you then see the name and value currently stored in the variable. But IntelliSense doesn’t stop there; you can click the value portion of the variable and change it right there. When you change it, C# Express doesn’t even call the Edit and Continue feature, but uses the
89

Chapter 6
new value. Previously, when you wanted to change values, you had to use the Watch or Immediate windows, both of which are discussed in the next sections.
First, you should try out changing a variable yourself.
Try It Out |
Change a Variable at Runtime Using IntelliSense |
Utilizing the project that you created for this chapter:
1.Press F5 to build and execute the applications.
2.Click the Breakpoint button on the main form. The code should break on the following line of code:
TestRoutine1(intTest1 + intTest2);
3.Place the mouse over the variable called intTest2. You now see the name of the variable and the value displayed.
4.Click the mouse button in the variable portion of the IntelliSense display, and change the value as desired.
5.Press F5 to continue execution. The value displayed in the message box now uses the new value you placed in intTest2.
Additional Ways of Displaying Variables
Besides using IntelliSense, there are a few other ways to display and modify variables as the code is running. The following sections briefly discuss each one and explain how to use them.
Locals Window
When you are running your code, you will have variables that are used locally by your program. In addition to the variables you create, C# generates and uses variables as well. The Locals window displays these variables, including giving you access to the properties and collections for variables that have them. A good example is that when you are in a form, you will be able to see the various form properties, as shown in Figure 6-7.
You can get to the Locals window when the application is running or in break mode via the Debug Windows menu item. You also will find the rest of the various tools that I discuss off this menu. If you right-click an entry in the Locals window, you can choose Edit Value to modify a value of one of the local variables.
You also can get to the majority of the debugging tools using the Debug toolbar, located above the editor windows. The toolbar, with the Windows options displayed, is shown in Figure 6-8.
90

Debugging Applications in C# Express
Figure 6-7
Figure 6-8
Immediate Window
On the right side of the screen in Figure 6-7, you can see the Immediate window. This window provides the ability to display and modify variables as well execute commands. As you get more comfortable with programming and debugging your applications, you will find yourself using this window more. To start with, you can see in Figure 6-9 where intTest1 is displayed using the ?, and is set to a new value using the Immediate window.
91

Chapter 6
Figure 6-9
Watch Window
The Watch window is useful when you have a variable you want to keep track of throughout your application. When the application is running, you can add a variable to the Watch window by right-clicking the variable in break mode and choosing Add Watch. Once this is done, you can then see and manipulate the variable in the Watch window, shown in Figure 6-10.
Figure 6-10
Additional Windows
There are some additional windows you can take advantage of such as the Output and Quick Console windows. These windows offer you different ways to debug your applications, where you can send your output to the Output window and perform commands using the Quick Console windows.
Stepping through Code
After breaking in your code, at times you will want to step through your code either line by line or using a little less granular method, but still one that provides more control than using F5. A number of
92

Debugging Applications in C# Express
commands offer you control over stepping through code. When in code you can access these commands using either the Debug toolbar or choosing them off the Debug menu:
Step Into. This command single-steps you through code, including stepping into routines that are called from other routines. When the routine called is completed, the step goes back up to the next line of code in the calling routine. F11 also is used to invoke the Step Into command.
Step Over. Much like the Step Into command except when you are on the call for a routine, it will execute the call (and the routine) but continues on the line of code following the routine.
Step Out Of. Just as it sounds, this command steps you out of a routine and sends you back up into the calling routine, once again continuing on the next line of code that called the routine.
The following commands can be found by right-clicking the mouse in the code window during break mode. For these commands, place the cursor where you want the commands executed.
Run to Cursor. This command starts executing the program until either a breakpoint is encountered or the line of code is reach that you invoked this command on.
Set Next Statement. This command enables you to totally skip lines by jumping to the cursor location.
Other Debugging Tools
A number of additional tools are available for debugging your applications, some of which are a bit more advanced; others just make sense to cover in other chapters. Following are some of these tools:
Call Stack window. This window displays the routines that have been called in the current execution of the program. The routines are displayed in reverse order. An example of the call stack is shown in Figure 6-11.
Figure 6-11
As you click the routines displayed, you are taken to those routines, and the last line executed is displayed in green.
93