

5
Preparation of Reforming Catalysts
J. R. Regalbuto
University of Illinois at Chicago, Chicago, Illinois, U.S.A.
George J. Antos
UOP, LLC, Des Plaines, Illinois, U.S.A.
1INTRODUCTION
Discussion of the preparation of catalysts for naphtha reforming remains predominantly a discussion of the preparation of platinum-containing catalysts. Platinum remains the chief metal component for all commercial reforming catalysts. The catalysts utilized when the first commercial reformers were employed in the late 1940s were monometallic-supported platinum catalysts. Since then, there has been considerable evolution in the reforming catalyst, centering largely on the chemical formulation although support modifications have some importance. Platinum has remained the key component. The bimetallic catalysts introduced in the late 1960s employed a second element, such as Re, Sn, Ge, and Ir, which interacted with platinum to result in catalysts that offered better gasoline selectivity or better overall performance stability. This offered the possibility of operating at lower pressures. Process innovations were developed, and the new direction for catalytic reforming was initiated. This has been the major direction since then, as discussed in Chapter 13 of this book.
Most conventional bimetallic or multimetallic reforming catalysts remain predicated on achieving a well-dispersed platinum function on an alumina support that is promoted with a halogen. This halogen is usually chlorine, and its function is to provide acidity. This bifunctional catalysis is described in Chapters 2 and 3 of this book. For the past 30 years, researchers have looked for methods to
141
142 |
Regalbuto and Antos |
improve on this basic recipe for monometallic and bimetallic catalysts. Multimetallic catalysts abound in the patent and scientific literature. Some of these have reportedly been commercialized. All will employ platinum on alumina as a foundation. There was much consideration to employ platinum deposited or exchanged in zeolites, with further ion exchange using alkaline ions such as potassium and barium.[1 – 4] Catalysts utilizing L-zeolites have reportedly been commercialized by Chevron and UOP. Despite the high selectivity for dehydrocyclization of n-hexane and n-heptane, the number of units in service are not a significant fraction of the total. This may be related to the sensitivity to poisoning by sulfur compounds[5] or a reduced need for aromatics such as benzene. Additional detail on the nature of these catalysts is found in Chapter 6 on characterization. As a comparison, attempts to utilize a zinc/H-MFI catalyst to reform naphtha, and in particular to convert C6 and C7 paraffins, are described in Chapter 9. This work is progressing through development scale-up.
This chapter deals with the preparation of platinum-based reforming catalysts. It differs from the chapter in the previous edition of this book[6] in that there is an in-depth exploration of the chemistry involved in impregnating a support with chloroplatinic acid. Many advances in the understanding of the speciation and interaction with the alumina surface have been made since the first edition. This information is useful in the preparation of any platinum-containing catalyst for any process application. In common with the first edition, the first part of this chapter will deal with the alumina support system and the generation of acidity on the alumina surface.
2REFORMING CATALYST SUPPORTS
Prior to the successful use of platinum in 1949, reforming catalysts consisted of chromium or molybdenum oxides deposited on alumina.[7] Early patents describe the deposition of chloroplatinic acid on an acidic support of fluorided alumina[8] or chlorided alumina.[9] All modern industrial reforming catalysts consist of platinum, frequently combined with one or more metals, deposited on a chlorided alumina. Given its vital importance in the process, alumina is the only support discussed in depth in this chapter. The first part of this section describes the two main forms of alumina used, their synthesis, structural and surface characteristics, and their shaping. The second part describes the steps involved in catalyst preparation, including impregnation, drying, and oxidation of the impregnated alumina support.
2.1g- and h-Al2O3
Aluminas constitute a large group including aluminum hydrates, transition aluminas, and a-Al2O3. Aluminum hydrates include amorphous hydroxide, crystallized trihydrates, gibbsite, bayerite, and norstrandite and the monohydrates
Preparation of Reforming Catalysts |
143 |
boehmite and diaspore. Several methods are available for preparing these hydrates:[10] acidification of sodium aluminate, neutralization of an aluminum salt, and hydrolysis of an aluminum alcoholate.
The hydrate conversions to the oxide state are complex and provide several low-temperature transition aluminas: r, x, h, and g. These can in turn be converted to one or more of the following high-temperature transition aluminas: d, k, and u. The final stage in these transformations is a-Al2O3, which is thermodynamically the most stable. Figure 1, based on references 10–23, gives an idea of the complexity of these relationships between the different aluminas.
The two main alumina supports with any use in catalytic reforming are the two transition aluminas h- and, above all, g-Al2O3. g-Al2O3 is usually obtained by the calcination in air of boehmite. Boehmite, which is generally described as an aluminum monohydrate, actually represents a broad continuum of products Al2O3.nH2O with varying degrees of hydration and organization without any clear borderlines: gelatinous boehmite is the most hydrated with n possibly even exceeding 2, pseudoboehmite or microcrystalline boehmite, crystalline boehmite, and, finally, highly crystallized boehmite in large rhombohedral crystals with n close to 1. Furthermore, depending on the conditions used, boehmite crystals with different shapes can be obtained, e.g., acicular or platelets.[10,21] The transformation of an alumina hydrate is a topotactic reaction in which the morphology and size of the particles are preserved. The properties of g-Al2O3 and the shape of the crystallite formed and its specific surface area depend on the initial boehmite.
Pseudoboehmite or microcrystalline boehmite leads to g-Al2O3 with a large area (.350 m2 g21 at 5008C) that is very poorly organized[28,30]. Calcination of the
crystalline boehmite at about 5008C promotes the formation of g-Al2O3 with a surface area close to 250 m2 g21. Highly crystallized boehmite converts to an alumina similar to g-Al2O3 with a low area (,100 m2 g21) at 5008C.
These low surface areas cannot generate enough acidity for the reforming reaction catalysis and are therefore not used in commercial reforming catalysts. The precursor selection is very important in the preparation of commercially viable reforming catalysts. Contamination of the boehmites with iron or sodium occurs depending on the raw materials used to make the boehmitic phase. Catalyst manufacturers are very selective regarding the sources of alumina raw materials used in the manufacture of reforming catalyst supports.
h-Al2O3 is obtained by calcination above 250–3008C in air or in vacuum of the alumina trihydrate bayerite, or in vacuum of gibbsite. The usual precursor, bayerite, is typically obtained in the form of large crystals 0.1 mm.[10] However, the liberation of the water caused by calcination apparently generates fine micropores in the large particles obtained. The specific surface area of the h- Al2O3 varies widely with the final calcination temperature: from 500 to about
400 m2 g21 between 2508C and 4508C and from 400 to about 250 m2 g21 between 450 and 5508C.[11]

144 |
Regalbuto and Antos |
Figure 1 Relationship of different aluminas.
Preparation of Reforming Catalysts |
145 |
The structures of g-Al2O3 and h-Al2O3 are similar.[11,24] They are based on
the compact cubic arrangement of the oxygen of the spinel MgAl2O4 structure,[11,23] but with a slight tetragonal deformation. This deformation,
which is a result of a disorder in the stacking of the oxygens, is more pronounced in h-Al2O3 than in g-Al2O3. The Al3þ cations are distributed over the 32
octahedral sites and the 64 tetrahedral sites. Tetrahedral sites are slightly more occupied in h-Al2O3 than in g-Al2O3.[11,24] The nature of the exposed crystal
faces at the surface of the two aluminas also appears to be different. Based on
¨ [25]
spectroscopic data, Knozinger and Ratnasamy concluded that the surface
consists of the three faces, (111), (110) and (100) in varying proportions in the
two aluminas, with a predominance of the (111) face in h-Al2O3 and the (110) face in g-Al2O3. This assumption was confirmed in a further study[21] in which it
was observed that the ratio of the proportions of the (110) and (111) faces exposed varies according to the morphology and the size of the crystals of g-Al2O3.
2.2Surface Acidity
The two main models of the surface acidity–basicity that have been proposed for
g- and h-Al |
O |
3 |
are those of Peri[26] |
and of Knozinger¨ |
and Ratnasamy.[25] The |
2 |
|
|
|
|
latter model considers the environment of the Al3þ cations connected to the hydroxyls for the, (111), (110) and (100) faces of the two aluminas. The number of different OH sites is five on the (111) face, three on the (110) face, and one on the (100) face. The authors attributed the catalytic properties of the aluminas to the combination of one of these OH sites with neighboring surface defects that have an energetically less favorable configuration and hence a very low probability of existence. These catalytic sites are formed only above 60% dehydroxylation. The degree of dehydroxylation of the aluminas, which governs the number of defects, appears as an essential parameter for acidity.[25 – 28] Further information on the characterization of the acidity is to be found in Chapter 6 of this book.
2.3Influence of Halogen on Alumina Acidity
Although the increase in acidity caused by the fixation of a halogen on the surface of an alumina has been known for many years, the nature of the halogenated surface complexes has still not been fully clarified. Contradictory results have been obtained with fluorided aluminas,[29 – 37] and the acidity seems to be promoted in different ways according to the halogen used.[29 – 31] Chloriding of
[38 – 45] ¨
alumina has been studied using CCl4 or HCl . The type of acidity, Bronsted or Lewis, seems to depend closely on the fixed chloride content and the chloride
precursor used. The maximal level of chloride fixed on g-Al2O3 using gaseous HCl appears limited to around 2 wt% (i.e., around 2.5 atoms of Cl per nm2).[40] At
146 |
Regalbuto and Antos |
such low chloride contents, Gates et al.[23] proposed the following mechanism for the promotion of Bro¨nsted acidity, which will play an important role in some of the numerous reforming reactions:
The acidity of an OH group is strengthened by the inductive effect exerted by a Cl2 ion adjacent to the OH group. This model agrees with the observations of Tanaka and Ogasawara.[39]
At high chloride contents, 2 wt % , Cl2 , 10 wt %, strong acid sites of
the Lewis type are formed.[40 – 45] They correspond to the formation of a gemdichlorinated aluminum complex at the surface.[40,43 – 45] These sites are
generated with compounds having at least two chlorine atoms on the same carbon atom: CH2Cl2, CHCl3, CCl4, etc.[45] The acidity corresponding to these high
chloride contents is unsuitable for reforming catalysts, for which the usual chloride content is about 1% by weight.
2.4.Forming of Alumina Macroparticles
The use of g- or h-Al2O3 as a reforming catalyst support requires a shaping operation adapted to the type of process: moving bed or fixed bed. For a moving bed, it is necessary to prepare 1- to 4-mm-diameter beads to facilitate circulation and to limit the mechanical abrasion of the catalyst. For the fixed bed, the support can be in the form of either beads or cylindrical extrudates 1–4 mm in diameter. The catalyst support is shaped essentially by three methods: granulation, drop coagulation, and extrusion.[10,46]
In the granulation process, a powder is agglomerated in the form of spherical beads by progressive humidification in a large bowl, called a pan granulator, with granulation seeds and water to which a peptizing agent may be added. As the bead grows, gravity and centrifugal force tend to push its trajectory to the side of the granulator, where it is ultimately ejected upon reaching a certain size.
Drop coagulation, as typified by the “oil drop technique”, is a particularly important technique for the formation of alumina beads used as reforming catalyst supports. The first patents issued on this technique date from the 1950s.[47 – 49] In general, the oil drop technique consists of dropping an alumina hydrosol in a water-
immiscible liquid in a vertical column. The alumina hydrosol can be prepared by the hydrolysis of an acid salt of aluminum, such as aluminum chloride,[41] nitrate,[47] or
sulfate,[50] or by the digestion of aluminum metal under heat by an aqueous
aluminum salt solution.[47 – 51] The water-immiscible liquid is preferably an oil,[48,50,52] such as a light gas oil[51] or a paraffinic cut[53] with a high interfacial
tension with respect to water. The higher the interfacial tension, the greater the
Preparation of Reforming Catalysts |
147 |
sphere forming tendency of the hydrosol in the liquid. The liquid is then heated to 50–1058C for a given time to permit the hydrosol spheres to transform progressively
into a hydrogel. To promote gellation of the hydrosol droplets, ammonia precursors such as hexamethylenetetraamine,[47,48,51,54 – 56] urea,[51,54,55] or a solution of
ammonium acetate and ammonium hydroxide[48] may be added to the hydrosol, or the water-immiscible organic liquid can be saturated with ammonia.[44]
In practice, the hydrogel spheres are held, or “aged”, in the oil medium for an extended period to harden the spheres so as to avoid deformation of the spheres during subsequent handling. In many cases, a subsequent complete
coagulation is achieved by immersion in an aqueous alkaline media, such as an ammonium hydroxide solution, for a further extended period.[44,51] This latter
procedure imparts a high mechanical resistance to the spheres. Various
modifications of the general oil drop technique have been mentioned in other
patents.[52,54,57 – 60]
The oil drop technique previously described applies easily to the synthesis of g-Al2O3 beads. It can also be used to produce h-Al2O3 beads provided that bayerite alumina spheres are formed through a final aging step.[55]
Extrudates are formed using two main steps. In the first mixing step, a peptizing agent is added to a mixture of water and alumina powder (such as pseudoboehmite) and the mixture is thoroughly stirred to form a plastic paste that may typically contain 40% by weight of alumina. In the second extrusion step, the paste is forced through dies of a shape and diameter selected in accordance with the desired end product. Whether beads or extrudates, the supports thus obtained are dried and then calcined in air, generally between 4008C and 6008C. This completes the conversion to the gamma phase.
The shaping operation normally has a negligible effect on the microporosity (pore diameter dp , 5 nm) and hence on the specific surface area of the aluminas because it does not alter the size of the precursor crystallites. It may nevertheless have a significant influence on the macroporosity (dp . 50 nm) and hence on the pore volume of the support beads.[10] This macroporosity stems essentially from the free voids between the more or less large agglomerates of crystallites and is a function of the shaping method. Moreover, it can be adjusted, before shaping, by
the addition of a pore-forming substance that is combustible or decomposable, or through the addition of a nondispersive inorganic filler.[10,46,61] The relative
importance of microand macropore volume and pore radii are explored through modeling and experimentation in Chapter 7 of this book.
3PLATINUM-CONTAINING CATALYSTS
3.1Key Features
When preparing the bifunctional monometallic Pt/Al2O3-Cl catalyst, the following main features must be achieved to guarantee optimal performance and cost:
148 |
Regalbuto and Antos |
Low Pt content (usually ,0.5 wt%) with uniform macroscopic distribution across the catalyst particle and maximum accessibility, i.e., maximum atomic dispersion. This high dispersion also reduces metal sintering during high-temperature treatments.
Acid sites in close proximity of the atoms or small particles of Pt. Adequate mechanical properties ideally undiminished from those of the
support.
To deposit platinum on an alumina support, two types of impregnation chemistries can be used: impregnation with or without interaction. In the first case, the platinum precursor forms an electrostatic or chemical bond with the surface of the support. In the second, the precursor displays no affinity for the surface and remains localized in the solution and deposits when the solution evaporates. It has been demonstrated that the impregnation techniques with interaction are substantially superior to the other in terms of metal dispersion and catalyst performance.[62,63] The following discussion of the preparation of a monometallic catalyst is therefore limited to this category.
3.2Industrial Impregnation
Modern techniques for the preparation of reforming catalysts use solutions of chloroplatinic acid as a platinum precursor with the addition of an acid such as hydrochloric acid. The mechanism and impact of a second acid is described in the next section. These solutions may be placed in contact with the alumina support in several different procedures.
1.The dried alumina is impregnated with a volume of solution corresponding exactly to the quantity required to fill the pore volume Vp (“capillary” or “dry” or “without excess solution” impregnation).
2.The dried alumina is immersed in a volume of solution substantially larger than Vp (impregnation with excess solution).
3.The alumina, which is previously saturated with water or with a solution of hydrochloric acid, is immersed in the aqueous solution containing H2PtCl6 (difffusional impregnation).
Strong interaction develops in an acidic medium between the support and H2PtCl6, slowing down the diffusion of the latter toward the center of the beads. The rate of diffusion determines the impregnation time. In technique 1, capillary aspiration of the solution by the support enables the rapid penetration (a few dozen seconds to a few minutes) of the solution into the pores.[64 – 66] The solution that reaches the center of the bead will be depleted of the Pt precursor, owing to the strong interaction of the latter with the support. A homogeneous Pt profile from the outside to the core of support grains is attained in this technique by allowing sufficient time for platinum diffusion in the solution in the pore volume. In
Preparation of Reforming Catalysts |
149 |
technique 3, the H2PtCl6 acid must diffuse in the aqueous phase from the external solution to the centers of the beads, and impregnation is purely diffusional. The diffusion is slow and may require many hours to ensure good distribution of the Pt in the bead.[67 – 69] Technique 2 is intermediate between the other two techniques.
In technique 1, which may also be carried out by spraying the support with the solution, the considerable liberation of heat that occurs may raise the temperature by a few dozen degrees.[64] If uncontrolled, this could lead to insufficient penetration of the metallic precursor. In technique 2, the excess solution favors rapid elimination of liberated heat. If the very dilute solution contains only the quantity of metal to be introduced onto the support in a single operation, a long immersion of a few hours is required to exhaust the metallic precursor from the solution. If, on the other hand, the solution is concentrated to enable the introduction of the desired quantity of platinum by simply filling the pores of the support, the latter must be dipped and then withdrawn very quickly to prevent rapid depletion of the precursor from the solution. In this case, removal of the heat is obviously less effective than in the other methods.
During capillary impregnation carried out in techniques 1 and 2, air bubbles are trapped in the pores, and especially in the micropores, where they are highly compressed.[64] The Young–Laplace law P ¼ 2g=r expresses the overpressure applied to the air bubbles trapped by the solution with a surface tension g in pores with radius r. If r is very small, very high pressures may be reached (for example, P ¼ 14 MPa approximately for r ¼ 10 nm), which may be detrimental to the mechanical properties of the beads [64]. Under the effect of such pressures, the air is progressively dissolved and migrates toward the macropores where less compressed and hence larger bubbles tend to appear. Removal of most of the imprisoned air to the exterior of the beads is generally complete after a few dozen minutes.[64] Additional practical information can also be obtained in Ref. 56.
3.3Impregnation
Fundamental Phenomena of Impregnation
The fundamental phenomena occurring during noble metal impregnation of alumina can be categorized into several areas: chemistry of surface hydroxyl groups, role of alumina dissolution, and nature of the metal complex–oxide surface interaction. In this section, the contrasting adsorption mechanisms that have arisen from these areas will be introduced and examined in light of the most recent literature data.
Surface Chemistry of Hydroxyl Groups. The first consideration is the chemistry of the support surface, which is populated by hydroxyl groups that serve to balance charge at the discontinuity of the solid metal–oxygen framework. It has been known for a great while in the colloid science literature that oxide surfaces can

150 |
Regalbuto and Antos |
become either positively or negatively charged at different pH values, as these
hydroxyl groups become either protonated or deprotonated in response to the solution pH. Different models of hydroxyl chemistry have arisen.[70,71] An elegant
method has been developed to identify “proton affinity distributions”—multiple types and chemistries of hydroxyl groups on a single oxide[72]—but most models for adsorption employ only a single site. This site is assumed to act as an amphoteric acid, becoming protonated and positively charged at low pH, and deprotonated and negatively charged at high pH according to the following equations:
. SOH2þ $ SOH þ Hþ, |
K1 ¼ 10 6(pK1 ¼ 6) |
. SOH $ SO þ Hþ, |
K2 ¼ 10 11(pK1 ¼ 11) |
The values of the “surface acidity” constants K1 and K2 given above are typical of alumina.[73,74] The pH at which the surface is neutral, termed the point of zero charge (pHPZC, or simply PZC), occurs midway between pK1 and pK2.[70] Most
aluminas have a PZC of about 8.5 + 0.5,[75] independent of phase. The difference between pK2 and pK1, or DpK, can be found experimentally[73,75] and has been
predicted theoretically.[76] The surface density of OH groups can also be measured independently and is thought to be about 5 OH/nm2 for alumina.[77] The surface charging of alumina can then be described by a PZC of 8.5, a DpK of 5, and NS ¼ 5 OH/nm2 which results in the distribution of protonated, neutral, and
deprotonated surface species as a function of pH shown in Figure 2. Recent work[73,75,76] has concurred that the value of DpK for common oxides such as silica
Figure 2 Distribution of species on an alumina surface as a function of pH, using typical PZC and DpK parameters (8.5 and 5, respectively).[75]

Preparation of Reforming Catalysts |
151 |
and alumina is large, such that virtually the entire surface is covered with neutral OH groups at the PZC, and on one side of the PZC or the other, the surface polarizes in only one way.
An issue related to surface charging is the solution-buffering effect of the surface. As protons are taken up or released by the hydroxyl groups at the oxide surface, the bulk pH can be influenced to a tremendous extent. Although this very significant effect has been in the literature for more than a decade, it is still relatively unappreciated by the catalysis community at large. The influence of an oxide surface on bulk pH was first demonstrated in an elegantly simple technique to determine oxide PZC termed “mass titration”.[78] In this experiment, small masses of oxide are added progressively to a liquid solution, and with each addition, the solution pH steps up or down toward the oxide pH. A schematic of mass titration taken from[78] is shown in Figure 3.
A microscopic interpretation of mass titration is given in Figure 4 for an oxide placed in a solution at a pH below the PZC of the oxide. With the initial addition of oxide, there exists a driving force for adsorption of protons, and as
Figure 3 “Mass titration”—the response of liquid pH to the stepwise addition of an oxide.[78]

152 |
Regalbuto and Antos |
Figure 4 Microscopic interpretation of mass titration. (a) Depiction of the oxide surface. (b) Bulk pH vs. oxide loading. (c) Surface charge vs. oxide loading.

Preparation of Reforming Catalysts |
153 |
they are lost from the bulk liquid, the solution pH drops (Fig. 4a, b). A surface charge s0 is established (Fig. 4c). As more mass is added, and although more protons adsorb (Fig. 4a), causing a further drop in the bulk pH (Fig. 4b), the area density of adsorbed protons actually decreases (Fig. 4a) such that the surface charge s0 decreases (Fig. 4c). As more oxide is added, the solution pH increases until the solution pH approaches the PZC, at which point there is no driving force for proton adsorption. At this condition, only a miniscule fraction of the oxide surface is charged (Fig. 4a, c); the amount of oxide in solution or, more appropriately, the number of hydroxyl groups at the oxide surface is very large
compared to the number of protons in solution. The surface charge is effectively zero at this condition and the oxide surface acts as a pH buffer.[74]
The first quantification of the oxide buffering effect appeared in 1995.[74] In this model, a proton balance was solved simultaneously with the single-site, amphoteric model of surface OH chemistry shown above, and a surface charge– surface potential relationship assumed from electric double layer theory. Figure 5 is taken from this work and is representative of an alumina surface. Final pH is plotted against initial pH for different values of the critical parameter of oxide surface loading. Oxide loading, the most direct measure of the amount of surface in solution, has units of m2/liter and is the product of specific surface area (m2/g)
Figure 5 Model results for shifts in pH during impregnation for a representative alumina support.[75]

154 |
Regalbuto and Antos |
times mass loading (g/liter). The highest loading, 180,000 m2/liter, corresponds to pore filling (at 1.1 ml/g) of a 200 m2/g alumina. At this condition, the model predicts that an impregnating solution initially at a pH as low as 2 will end up near 8, the assumed PZC of the oxide. At this condition, the surface is uncharged and there would be no interaction with an anionic–metal complex. The sets of
curves shown in Figure 5 at different surface loadings have been verified experimentally.[74,75] From this model a practical consequence follows for
impregnation by pore filling (or incipient wetness). If a strong electrostatic
interaction between metal complex and surface is desired, the starting pH must be extremely acidic or basic in order to achieve a significant surface charge.[74,79]
Otherwise, no strong interaction will exist and at least the initial dispersion of the metal complex will be poor. For typical g-aluminas, this would mean starting with a pH of less than 1 if a positive surface charge is desired or more than 13 if a negatively charged surface is desired.
Electrostatic Adsorption Models. A charged oxide surface is the basis of many adsorption models. A landmark theory of the late 1970s posited that noble metal adsorption onto common support oxides, such as silica and alumina, was essentially an electrostatic interaction[80] between ionic metal complexes in solution and the oppositely charged hydroxyl groups at the oxide surface. As depicted in Figure 6, cation adsorption can occur at pH values above the PZC of the oxide, whereas anion adsorption can occur below the PZC.
The hexachloroplatinate ion ([PtCl6]22) should then interact strongly with an alumina surface in the acidic pH range where the surface is fully protonated (. SOHþ2 ), and metal cations such as tetraamine platinate ([(NH3)4Pt]2þ) should
Figure 6 Qualitative “ion exchange” adsorption theory of Brunelle.[80]

Preparation of Reforming Catalysts |
155 |
adsorb in the basic pH range where the surface is negative (.SO2). In another seminal paper,[81] just such behavior and a semiquantitative model for it were reported for the palladium complexes [PdCl4]22 and [(NH3)4Pd]2þ in the respective pH ranges over alumina.
The first quantitative theory based on electrostatic interactions appeared somewhat earlier in the colloid science literature.[82] In this work the attempt was made to calculate a priori the free energy of adsorption from coulombic and solvation energies, although a “chemical” energy term had to be employed to compensate for an admittedly crude solvation energy calculation. There was a subtle difference between this model and the Brunelle scheme. The maximal adsorbate density was calculated on a steric basis, as a monolayer of close-packed
complexes which retained a hydration sheath. In the work of Brunelle[80] and others[83], the process was thought to be more like ion exchange, in which equal
equivalents of protons and metal cations or hydroxyls and metal anions exchanged at the surface. Both interpretations, based on a purely physical and mainly coulombic interaction between a charged surface and oppositely charged metal complexes, can be thought of as “physical” adsorption models.
In more recent work the original physical adsorption model of James and Healy[82] has been revised,[79,84,85] initially using a more rigorous calculation of
the solvation energy term, which led to a much smaller and less dominant value for this term.[84] In later works it was discovered that the solvation free-energy term could be eliminated entirely[79,85] and the free energy of adsorption, from
which the adsorption equilibrium constant is calculated, is based entirely on the coulombic energy.
The three components of the revised physical adsorption (RPA) model are shown in Figure 7. The first is a description of the surface charging, which includes the proton balance illustrated in Figure 5. Second, the adsorption equilibrium constants are calculated a priori based on the coulombic free energy. Third, the speciation of Pt complexes in the liquid phase must be accounted for as
a function of pH, as the pH will change greatly upon adsorption. Up to this point, a single Pt species has been employed in the RPA models[79,85,86] based on the
assumption that other chlorohydroxo complexes such as [PtCl4(OH)2]22 will have the same charge and about the same radius. In a later section on the coordination chemistry of CPA (chloroplatinic acid), this assumption is discussed.
In the model a Langmuir isotherm is assumed:
KadsC
G ¼ Gmax (1 þ KadsC)
where Kads ¼ exp[2DGcoulombic/RT] and C is the equilibrium concentration of the metal species. The coulombic energy DGcoulombic is derived from the surface-charging portion of the model discussed above. Earlier experimental
156 |
Regalbuto and Antos |
Figure 7 Three regimes of an adsorption model.[79]
work and a survey of the literature[87] suggested that the maximal uptake of anionic Pt and Pd complexes, Gmax, as in James and Healy’s model,[82] corresponded to a steric monolayer of complexes that retained one hydration sheath. For CPA this number is about 1.6 mmole/m2, or about one Pt complex/ nm2. An illustration of these hydrated complexes, along with a hydroxyl group density of about 5 OH/nm2, is given in Figure 8. Note that, contrary to an “ion exchange” interpretation of noble metal adsorption, steric limitations prevent electrical saturation of the surface. Cationic complexes such as [(NH3)4Pt]2þ and [(NH3)4Pd]2þ have been reported to adsorb at a maximum of 0.8 mmole/nm2, or
one complex per 2 nm2, and thus appear to retain two hydration sheaths upon adsorption.[87,88]
Representative experimental results and an RPA model simulation are shown in Figure 9. These are measurements of CPA uptake onto alumina vs. pH (Fig. 9a), at a constant initial CPA concentration of 180 ppm and a surface loading of 500 m2/liter, which implies a great excess of liquid. For a series of aluminas of different phase and specific surface area (m2/g), the mass of oxide was adjusted to give the same surface loading. When alumina powder is used (as opposed to spheres, pellets, or extrudates), adsorption occurs rapidly; close to 100% of equilibrium coverage was obtained within 1 h, and perhaps 75% within 10 min.[75]

Preparation of Reforming Catalysts |
157 |
Figure 8 Depiction of the maximal extent of CPA adsorption over an alumina surface.[79]
Since all these aluminas have about the same PZC, near 8.5,[75] they can be modeled with one set of parameters. The shift in pH during adsorption can be calculated from the proton balance portion of the model; plots of final vs. initial pH for these adsorption experiments are shown in Figure 9b. The particulars of the model are given in [79]. In short, at the PZC the surface is uncharged and there is little or no adsorption. As the pH decreases from the PZC the surface charges and uptake increases. In the lowest pH range, Pt uptake is retarded not due to
competition from chloride (HCl was used to acidify the solutions) but rather to the electric screening effect;[79,84] high ionic strength effectively reduces the adsorption
equilibrium constant. Competitive adsorption of chloride is a commonly cited phenomenon in the impregnation literature[89,90] but does not appear to occur to a
significant extent. A careful measurement of Cl2 concentration in the pH range where retardation occurred, in the experiment of Figure 9, showed that Cl2 did not adsorb and is not responsible for the retardation.[75] According to the RPA model, rather than a chloride-filled surface, it is simply empty since all adsorption equilibrium constants are very low at high ionic strength.[75]
The RPA model has been used with one set of independently measured parameters to simulate all extent sets of CPA/alumina adsorption data to a reasonable degree.[79] Many groups have recorded data as isotherms, in which uptake was measured as CPA concentration was increased.[91 – 94] To apply the RPA model to these datasets, the final pH of the solution had to be estimated using an initial estimate of pH from the concentration of the CPA, and then

158 |
Regalbuto and Antos |
Figure 9 (a) Measured Pt uptake over a series of aluminas vs. pH, and the parameter free RPA model simulation of the data.[75] Surface area and phase of alumina is given in the figure legend, (b) measured and simulated pH shifts.

Preparation of Reforming Catalysts |
159 |
Figure 10 RPA model simulation of literature data. (a) Uptake vs. CPA concentration.
(b) Uptake vs. final pH.[79]
employing the proton balance portion of the model. A representative simulation of literature data[91] is shown in Figure 10, which can be plotted as uptake vs.
CPA concentration (Fig. 10a), or uptake vs. final pH (Fig. 10b). The same set of model parameters (PZC ¼ 8.5, DpK ¼ 5, NS ¼ 5 OH/nm2) was used for the simulation of Figure 10 as employed for Figures 2, 5, and 9.
Effect of Dissolved Aluminum: “Coordination” Adsorption Models. Other models have arisen from the complicating fact that aluminum dissolution often occurs during impregnation, especially in the acidic pH range. Figure 11 from Ref. 80 below indicates the solubility of alumina in the acidic and basic pH ranges. Superimposed onto this figure are the pH ranges of anion and cation adsorption. It is not surprising that several adsorption theories have predicted an impact of dissolved alumina and in entirely different ways. One group, noting that the adsorption of Pt onto alumina diminished at low pH as aluminum
dissolved, compared to higher pH, suggested that the decrease in Pt uptake was due to the loss of adsorption sites from the alumina surface.[95]
In a completely contrary hypothesis, an adsorption mechanism has been proposed in which platinum species stemming from CPA are deposited onto the surface only after aluminum has dissolved from the alumina surface and formed a hetero complex with platinum.[94] From a kinetic analysis, the adsorption step was postulated as shown in Figure 12. In a later work,[96] this mechanism was inferred from a series of alumina supports over which the extent of Pt adsorption (from CPA) directly correlated with the degree of Al dissolution. In both of these papers the adsorption of Pt-containing species is postulated to occur only after the dissolution of aluminum and the formation of a heterogeneous coordination complex. This sort of mechanism might then be thought of as a “coordinative” mechanism.

160 |
Regalbuto and Antos |
Figure 11 Aluminum solubility as a function of pH.[80]
Evidence against a direct role of dissolved aluminum has accrued since these works[94,95] were published. In the first place, similar adsorption capacities
have been demonstrated for aluminas that differ widely in solubility. This is seen in the Pt uptake results of Figure 9, from Ref. 75, where all phases of alumina behave similarly. The alumina solubility for this series of samples is shown below in Figure 13, taken from Ref. 75. a-Alumina is sparing soluble, h and u are
Figure 12 Dissolution–complex formation–adsorption mechanism.[96]

Preparation of Reforming Catalysts |
161 |
Figure 13 Dissolved alumina vs. pH in the presence and absence of Pt.[75]
moderately so, and g-alumina is the most soluble. Since the same surface loading was employed for all samples, the trend seen here should truly reflect the
difference in intrinsic dissolution rates. In the earlier work in which Pt uptake was correlated to Al dissolution,[97] the same mass of alumina was used for aluminas
with different specific surface areas. Not surprisingly, the samples with the
highest surface area exhibited the highest degrees of both aluminum dissolution and Pt uptake. It was seen[87] that if the uptake results from that study are
normalized for surface area, in fact all samples adsorbed Pt in an amount close to the monolayer capacity of 1.6 mmole/m2.
The influence of dissolved aluminum is manifested by upward shifts in pH, as the overall dissolution equation
Al2O3 þ 6Hþ ! 2Al(OH)3
dictates that three protons are consumed for each aluminum dissolved. These upward shifts have been observed in addition to proton adsorption (see figures 4
and 7 of Ref. 75) and were more severe for the more soluble aluminas. Above a pH of about 3.5, dissolution is negligible.[75,80]
Finally, in Figure 13 the solid lines are for dissolved aluminum measured during the adsorption experiment, while the dashed lines were recorded for a control experiment, in the absence of Pt, in aqueous HCl in the same pH range. In essentially all cases, the amount of dissolved aluminum is independent of the
162 |
Regalbuto and Antos |
presence of Pt. Thus, it appears that the dissolution of aluminum is a kinetically limited process that is independent of Pt adsorption.
As a quick aside, a version of this model has reappeared in the literature as a “geochemical” model for nonnoble metals. It was first reported that alumina can be induced to dissolve in the normally stable neutral pH range, near its PZC, when in the presence of Co(II), Ni(II), or Zn(II), which form hydrotalcite-like complexes.[97] Most recently, tungsten and molybdenum have been reported to
form stable Keggin-like heteropoly complexes with aluminum in the neutral pH range.[98,99] In this model the driving force for metal uptake is formation of a new
solid compound. The alumina support actually participates in a chemical reaction, and while it was originally thought that these reactions occur on a very
large time scale (hence, “geochemical”), the most recent papers suggest that the reactions occur in minutes.[98,99] The solid experimental verification of the
heteropoly complexes and the good agreement of results with thermodynamic theory[98,99] strongly support this theory in the case of these nonnoble metals.
“Chemical” Adsorption Models. A final type of adsorption model can be thought of as a blend of the electrostatic and coordinative models. Historically the electrostatic model of James and Healy was abandoned, perhaps due to the magnitude of the “chemical” or adjustable free-energy term. The size of this term usually swamped the coulombic and solvation terms;[84] the model was too often
a one-parameter fit of an adsorption uptake curve. In its place arose the “triple layer” or “site binding” model[100] in which metal complexes adsorb at an outer
layer, and small electrolytes such as Cl2 and Naþ were postulated to adsorb, via some unspecified “chemical” interaction, at the inner layer. This is the extent of the chemical interaction; there is no dissolution and reaction of the aluminum in the support with the impregnated metal complexes as occurs in the previous model. The presence of the inner layer ions can be used to attenuate the outer layer surface potential and so adjust the uptake of metal complexes.
A triple-layer model was employed relatively recently for CPA adsorption over alumina.[89] The data that were modeled are presented in Figure 14. This is a
relatively complete set of data, since not only was the uptake of Pt recorded, but also shifts in pH and the amount of dissolved aluminum at a particular pH were monitored. The trend in Pt uptake vs. pH has the familiar volcano shape. Besides the retardation of Pt adsorption at low pH, the shifts in pH must also be simulated.
The triple-layer model equations used to simulate this set of data are shown in Figure 15. First, there are the hydroxyl protonation–deprotonation reactions as seen in Figure 7. The surface ionization constants K1 and K2 have the same meaning as before. In addition, the inner layer adsorption of Cl2 and Naþ is modeled with four additional equilibrium constants. The retardation was simulated by fitting the data using large values of the equilibrium constants of equations (3) and (5) of Figure 15, which give rise to large values of “chemically”

Preparation of Reforming Catalysts |
163 |
Figure 14 pH shift, Pt uptake, and Al dissolution data from Mang et al.[89]
adsorbed Cl2. Metal adsorption is described by either four or seven additional adsorption equilibria, the last three of which (11–13) of Figure 15 are surface– ligand exchange reactions that release OH2 and so can account for the observed upward shifts in solution pH.
The fit of the chemical adsorption model for this set of Pt uptake data is shown in Figure 16a. With the large number of adjustable parameters it contains, the fit of the chemical adsorption parameter is good, although the number of adjustable parameters this sort of model contains is a major drawback. However, the fit of the RPA model using the unadjusted set of parameters as in the earlier figures is even better, as seen in Figure 16b. In addition, the pH shifts are well predicted by the proton balance of the RPA model; these data are shown in Figure 16c. The pH shifts are calculated independently from Pt adsorption. Again, the

164 |
Regalbuto and Antos |
Figure 15 The triple layer or “chemical” adsorption model of Mang et al.[89]
most recent experimental evidence also seems to support the RPA model; chloride adsorption has been shown not to occur in the low-pH regime of Pt
adsorption retardation,[75] and pH shifts (Fig. 16c) are observed to occur in the absence of Pt adsorption.[74,75]
The most recent appearance of a chemical adsorption mechanism stems from a molecular level characterization of Pt coordination complexes.[101 – 103] Extended X-ray absorption for fine structure (EXAFS) and 195Pt nuclear magnetic resonance (NMR) spectroscopy have been used to study the coordination chemistry of adsorbed Pt complexes. This work will be discussed in more detail in the following section. Here it will be pointed out that based on this characterization the adsorption process is thought to occur in large part as an electrostatic mechanism, but also with some “specifically adsorbed” and some “grafted” complexes.[103] A molecular depiction of the specifically adsorbed Pt complexes is shown in Figure 17a. In this picture, the protonated hydroxyl groups

Preparation of Reforming Catalysts |
165 |
Figure 16 Models of Pt adsorption. (a) “Chemical” adsorption and (b) RPA simulations of the Mang et al. uptake data.[79] (c) RPA proton balance for final vs. initial pH.
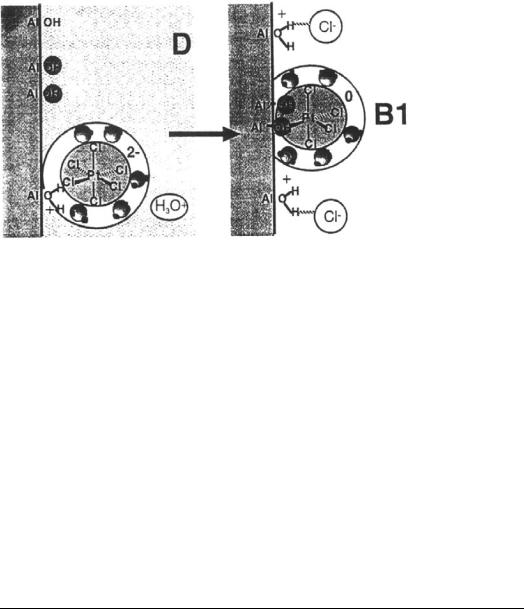
at the alumina surface have replaced one or two water molecules in the hydration shell surrounding the Pt complex. This hydrogen bonding (and thus, “specific”) interaction was inferred from small shifts in the NMR signal. In more basic pH solutions, the NMR signal for the pentaand tetrachloride species disappears altogether, which is taken as a signal of a “grafting” reaction in which the chloride ligands in the Pt complex are replaced by OH groups from the alumina surface (species B1 in Fig. 17b) or OH groups at the alumina surface are replaced by Cl ligands from the Pt complex (species B2 in Fig. 17b). An alternative explanation for the disappearance of the NMR signal will be given in the next section.
166 |
Regalbuto and Antos |
Figure 17 Molecular depiction[103] of (a) “specifically adsorbed” Pt complexes and
(b) grafted species.
Of all possible adsorption models, the revised physical adsorption model appears to capture most completely and most simply the fundamental phenomena that occur during catalyst impregnation of powdered catalysts. The key phenomena appear to be the charging of the oxide surface, the influence of bulk pH by proton transfer to the surface, and electrostatic adsorption. The charging of the surface and electrostatic adsorption appear to be independent phenomena, coupled by the bulk liquid pH. The dissolution of aluminum and Pt adsorption also appear to be independent phenomena, weakly coupled by solution pH and ionic strength. Recent advances in the molecular characterization of dissolved and adsorbed Pt complexes will enable the adsorption mechanism of CPA onto alumina to be further refined. At present, this is the cutting edge of CPA/alumina impregnation research and is the subject of the following section.
Coordination Chemistry of Dissolved and Adsorbed Pt Complexes from CPA
In recent years, sensitive in situ spectroscopic characterization of the coordination chemistry of Pt complexes has been directed to a molecular level

Preparation of Reforming Catalysts |
167 |
description of the mechanism of Pt adsorption and a more precise determination of the composition of adsorbed and adsorbing Pt complexes.
Chloroplatinic Acid in Solution. As a first consideration, contradictory
sets of formation constants on CPA speciation are available in the literature. Sillen and Martell[104] give the most comprehensive and most cited set of
equilibrium constants. Their speciation pathway, shown in Figure 7, presumes that up to two chlorides can exchange successively for water ligands:
½PtCl6 |
&2 þ H2O $ ½PtCl5(H2O)& þ Cl |
|
(1) |
½PtCl5 |
(H2O)&1 þ H2O $ ½PtCl4(H2O)2&0 |
þ Cl |
(2) |
and at basic pH the chloroaquo complexes behave as weak acids and deprotonate as follows:
½PtCl5 |
(H2O)& $ ½PtCl5(OH)&2 þ Hþ |
(3) |
½PtCl4 |
(H2O)2&0 $ ½PtCl4(OH)(H2O)& þ Hþ |
(4) |
½PtCl4 |
(OH)(H2O)& $ ½PtCl4(OH)2&2 þ Hþ |
(5) |
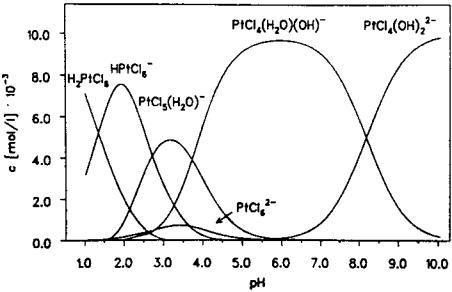
Dissociation of the chloroplatinic acid is presumed complete and up to two chloride ligands may be exchanged. The Pt species predicted at different pH values according to the Sillen and Martell data are shown in Figure 18. Since the equilibrium constants were determined at low pH and high Pt concentrations, it is
Figure 18 Speciation of CPA according to the mechanism and formation constants reported by Sillen and Martell.[104]
168 |
Regalbuto and Antos |
Figure 19 Speciation of CPA reported by Mang et al.[89]
likely that the equilibrium constants only accurately predict the Pt species in acidic- to-neutral aqueous solutions. They acknowledge that at higher pH more extensive
hydrolysis is possible,[104] perhaps leading to Pt(OH)26 in strongly basic solution. Based on the data of Cox and Peters[105] and Davidson and Jameson,[106] Mang et al.[89] showed a speciation of CPA similar to that of the Sillen and Martell
mechanism but for the fact that chloroplatinic acid itself, H2PtCl6, behaves as a weak acid. According to their model, shown in Figure 19, at low pH a large fraction of the CPA remains protonated. Below a pH of about 2 there is no hydrolysis, and in weakly acidic solutions one chloride ion is exchanged by water. As with Sillen and Martell’s model above, up to two Cl ligands can undergo hydrolysis, and in basic solution Cl ligands are exchanged by hydroxide ion.
Finally, Gmelin’s handbook[107] qualitatively gives the mechanism established by Miolati in the early 1900s.[108] A sequence of hydroxide for chloride ligand exchange reactions can proceed stepwise from PtCl26 to the insoluble Pt(OH)26 as follows:
PtCl6 n(OH)2n þ H2O $ PtCl5 n(OH)2nþ1 þ Hþ þ Cl
where n ¼ 0–5 depending on pH and concentration.
The liquid-phase speciation of Pt complexes stemming from CPA has recently been characterized by two groups using NMR and EXAFS,[101 – 103] sensitive spectroscopies not previously available. The 195Pt NMR results on liquid-phase speciation of concentrated CPA solutions (2400 and 13,200 ppm Pt) obtained by Lambert and coworkers[10] are shown in Figure 20 and appears much

Preparation of Reforming Catalysts |
169 |
Figure 20 Speciation of concentrated CPA solutions reported by Lambert et al.[99]
in line with the Sillen and Martell scheme. The water–chloride ligand exchanges are thought to occur slowly, and the chloroaquo complexes are thought, as weak acids, to dissociate quickly.
Even more recent EXAFS results obtained for dilute solutions at the highly sensitive Advanced Photon Source at Argonne National Laboratory reveal that the speciation pathway is more complicated in the low-concentration regime[109]
and calls into question the mechanistic interpretation of rapid deprotonation.[101,104]. Figure 21 shows that the Pt-Cl coordination number decreases
approximately linearly with decreasing Pt concentration below 2400 ppm. The
Pt-Cl coordination of the 2400 ppm CPA solution determined by the Pt NMR study[101] is included in this figure and is in good agreement with these EXAFS
determinations. But many more than two chlorides are exchanged at low Pt concentration. The calculated coordination for a 200 ppm sample at a pH of about 2.7 is an average of 2.7 Cl2 and 3.3 OH2 or H2O ligands, and with aging the chloride coordination decreases even further to a value of about 2.[109] Figure 22 illustrates the effect of pH and aging on the speciation of 200 ppm CPA. (It is important to study the speciation in the basic pH range, to account for the pH buffering effect of alumina that will pull the liquid pH into this range.) In the more basic pH range with aging, up to five chlorides are exchanged. It is clear from these EXAFS results that dilute CPA solutions clearly undergo more extensive hydrolysis than predicted by the Sillen and Martell model.
The slow, large shifts in pH after 24 h aging, noted with arrows in Figure 22, give rise to a mechanism for the formation of chlorohydroxoaquo complexes

170 |
Regalbuto and Antos |
that is significantly different than previously thought. Prior to this study, the
deprotonation reactions [Eqs. (3)–(5)] were thought to be rapid, as the result of dissociation of weak acids.[101,104] The EXAFS and pH measurements basically
showed that the chlorides exchanged rapidly and then protons were released only slowly thereafter. This slow evolution of protons was attributed to the exchange of hydroxide for water;[109] the deprotonation of the complex was postulated not to occur via weak acid dissociation, which would be rapid, but by a kinetically slow substitution reaction, as indicated below:
½PtClx(OH)y(H2O)z&4 x y þ OH $ ½PtClx(OH)yþ1(H2O)z 1&4 x y |
|
þ H2O |
(6) |
While these large downward shifts during aging were also noted in the NMR study, they were attributed in some fashion to the process of hydrolysis.[101] However, it is difficult to detect changes caused by hydrolysis in the spectra of fresh and aged samples.
While the actual mechanism of the formation of chloroaquo and chlorohydroxo species is still under debate, an overall speciation pathway independent of mechanism can be formulated from the EXAFS study. This overall scheme is shown in Figure 23. This comprehensive pathway subsumes
Figure 21 Decrease in chloride coordination with decreasing CPA concentration.[109]

Preparation of Reforming Catalysts |
171 |
Figure 22 Changes in the chloride coordination of 200 ppm CPA with respect to pH and aging. (Adapted from Ref. 109.)
earlier versions: the Gmelin pathway is seen as the bottom diagonal of the figure, and the Sillen and Martell pathway is seen in the first three columns and is represented by the horizontal and vertical pathways.
Since aquo species definitely form, the pathway of Gmelin is incorrect. The chloride coordination was also seen to be a function of pH at constant excess chloride concentration.[109] With the Sillen and Martell pathway composed of the horizontal water–chloride exchanges [Eqs. (1) and (2)] and the vertical hydroxyl– water exchanges [Eqs. (3)–(5)] in Figure 23, this functionality is impossible to obtain. Thus, an additional pathway must be added in which hydroxyls directly exchange with chloride ligands;[40] these new pathways are represented in Figure 23 as the diagonal arrows, and the new path is indicated in Eq. (7).
½PtClx(OH)y(H2O)z&4 x y þ OH $ ½PtClx 1(OH)yþ1(H2O)z&4 x y |
|
þ Cl |
(7) |
Careful pH measurements were combined with the EXAFS analysis to determine the most prevalent species in this scheme.[109] These measurements suggest a valence of 0 for the 1000 ppm CPA solution, i.e., [PtCl4(H2O)2]0 would appear to be the dominant species at low pH. Furthermore, at dilute concentrations and at low pH, it appears that zero valent species are often preferred. The [PtCl6]22 complex is only seen at high CPA concentration and low pH, or at low CPA concentration in a great excess of chloride. With further characterization of these
172 |
Regalbuto and Antos |
dilute CPA solutions, especially in the mid-pH range, the full set of formation constants for the overall pathway might soon be obtained.
CPA Adsorbed onto Alumina. Recently, attention has also been paid to the
molecular level characterization of CPA complexes adsorbed onto alumina, such as used to formulate Figure 17.[102,103,110] Two of the most powerful techniques
are again EXAFS and 195Pt NMR. EXAFS performed with an advanced photon source has the advantage of extremely high sensitivity, allowing access to dilute solutions, but is incapable of distinguishing between OH and H2O ligands. NMR can make this distinction but has much poorer sensitivity, which limits the range of dilution and lengthens data acquisition time compared to EXAFS.
In the Lambert study, small shifts in the 195Pt NMR signal from adsorbed
[PtCl6]22 with respect to the dissolved species were interpreted as a perturbation of the hydration shell of the adsorbed complex.[102,103] The interactions depicted
in Figure 17 are thought to be partly electrostatic and partly “specific adsorption” owing to a hydrogen bond between a proton from a protonated surface hydroxyl group and a chloride ligand from the complex. NMR analysis also revealed a conversion of [PtCl6]22 to [PtCl5(OH)]22 during the aging of a sample impregnated with an initial pH of 1.15, and that the integrated signal of the
hexa-, penta-, and tetrachloro species decreased greatly over time when the impregnation was conducted with a solution initially at pH 2.8.[102] The loss of
NMR signal was taken as evidence of a grafting reaction, illustrated in Figure 24, in which hydroxide ligands from the support exchange with chloride.
EXAFS analysis of this latter sample after drying revealed a chloride coordination of only 3, which is somewhat difficult to explain by grafting. In fact, an alternate explanation for the decrease in chloride coordination upon aging in
the one adsorbed sample and the loss of the NMR signal in the other can be proposed from just-completed EXAFS work of the Regalbuto group.[110] In that
work the adsorption of [PtCl6]22 was compared to that of Pt complexes with about half the chloride exchanged for hydroxide or water. The experiments performed and the results are summarized in Table 1. In this series of experiments, the target Pt loading was varied by changing the oxide loading. The highest oxide loading, samples 1 and 2, yielded the lowest Pt loading and the highest upward pH shifts, as expected in view of the proton balance of Figure 25. The [PtCl6]22 complex was made by adding excess chloride to half the samples; the increased ionic strength in these samples partially inhibited Pt uptake, also as expected in view of Figure 9. A perhaps unexpected result is that the adsorbed complex in either series, whether initiating as [PtCl6]22 or “PtCl3O3” (possibly [PtCl3(OH)(H2O)2]0, from Figure 23) ended up as “PtCl2O4”.
The interpretation of these data relied on the earlier liquid-phase speciation study[109] and on the RPA model. The electrochemical equilibrium at the oxide
interface results in a Boltzman distribution of protons such that below the PZC of an

Preparation of Reforming Catalysts |
173 |
Figure 23 A comprehensive pathway of CPA speciation.[109]
174 |
Regalbuto and Antos |
Figure 24 Grafting mechanism of Shelimov et al.[103]
oxide, the pH at the surface, and slightly away from the surface at the adsorption plane, is higher than that of the bulk. In Figure 25, the chloride coordination numbers of the adsorbed species are superimposed onto the results from the liquid-phase study, using the respective pH of the adsorption plane for each solid sample. Both sets of solid samples fall between the curves of the fresh and aged samples. It was concluded not only that the local environment at the adsorption plane is at higher pH than the bulk but that it is devoid of chloride ions. This hypothesis is consistent with the earlier observation that chloride does not adsorb onto alumina.[75] An illustration of the adsorption of [PtCl6]22 from dilute solution is given in Figure 26. The hydrated hexachloroplatinate ion is stable in the bulk liquid in excess chloride and low pH, but at the adsorption plane it speciates as if in a higher pH, low-chloride solution.
Table 1 Comparison of Adsorptive Behavior of PtCl6 and PtCl3O3
|
|
|
Surface |
|
|
|
|
|
|
Target |
NaCl |
load |
|
|
|
|
Actual |
|
wt % |
(mol/ |
(m2/ |
Initial |
Final |
CN Cl |
CN Cl |
wt % |
Sample |
Pt |
liter) |
liter) |
pH |
pH |
liquid |
solid |
Pt |
|
|
|
|
|
|
|
|
|
1 |
1 |
— |
5000 |
2.63 |
4.34 |
2.7 |
1.6 |
1.0 |
2 |
1 |
0.1 |
5000 |
2.60 |
5.59 |
6.0 |
1.5 |
0.7 |
3 |
4.8 |
— |
1000 |
2.59 |
2.84 |
2.7 |
2.1 |
3.7 |
4 |
4.8 |
0.1 |
1000 |
2.54 |
3.43 |
6.0 |
1.9 |
1.9 |
5 |
7.2 |
— |
650 |
2.50 |
2.81 |
2.7 |
2.1 |
4.1 |
6 |
7.2 |
0.01 |
650 |
2.55 |
2.87 |
(6) |
2.2 |
3.2 |
|
|
|
|
|
|
|
|
|

Preparation of Reforming Catalysts |
175 |
Figure 25 Chloride coordination numbers of adsorbed species (squares) and liquid phase species (circles).[110]
There is still work to be done to confirm this interpretation. The adsorbed species shown in Figure 26 is the dianion [PtCl2(OH)4]22, which is consistent with an electrostatic model. Liquid-phase speciation in the pH range above 2.6 and below 12 has not been characterized, however, and the valence of this Pt complex is only assumed. At pH 2.6, as indicated in Figure 23, the Pt complexes are zero valent. The assumption made in drawing Figure 26 is that in the mildly acidic range above pH 3–4, the aquo ligands will exchange with (or deprotonate to) hydroxo ligands. Additional EXAFS studies will be conducted to confirm or disprove this model.
The purely electrostatic interpretation can be extrapolated to higher Pt concentrations to arrive at an alternative explanation to grafting as proposed by the Lambert group. The transformation of adsorbed [PtCl6]22 to [PtCl5(OH)]22 during the aging of an impregnation with a solution initially at pH 1.15 can be explained by the complex being subject to increased pH upon adsorption and aging. This would come about in a number of ways. First, from Figure 5 it can be appreciated that the consumption of protons by the surface (the oxide buffering effect) at the surface loading employed, about 150,000 m2/liter, would raise the pH significantly from 1.15. The pH at the adsorption plane would be even higher, and dissolution of aluminum might slowly increase the pH even further. While the transformation of adsorbed [PtCl6]22 to PtCl2O4 was seen to be rapid in dilute solutions,[110] in concentrated solutions it might be slower. The disappearance of
176 |
Regalbuto and Antos |
Figure 26 Microscopic interpretation of the speciation of adsorbed Pt complexes.
the integrated NMR signal from hexa-, penta-, and tetrachloroplatinates for the sample impregnated at an initial pH of 2.8[102] can be explained by the same
reasoning. At this relatively high initial pH, the shift in pH upon impregnation would be very large and likely approach the oxide PZC. At this high pH, the loss of chloride ligands might be expected in solution for even a concentrated solution.
Independent of the grafting or the “localized electrostatic” speciation theories, the fact is that adsorbed Pt complexes lose chloride upon adsorption except at high chloride concentrations. Further characterization of this system should shed more light on the coordination chemistry of the dissolved and adsorbed species and the adsorption mechanism in general.
Pt uptake in Zeolites and MAPSO and SAPO Zeotypes
As opposed to an electrostatic adsorption mechanism, the uptake of Pt onto zeolites is generally considered to occur via ion exchange at the chargeunbalanced aluminum sites in the zeolite framework. In a classic and comprehensive review of zeolites and their industrial use, ion exchange

Preparation of Reforming Catalysts |
177 |
isotherms for many zeolites and ion pairs are given.[111] This implies, of course, that only cationic complexes of Pt can be easily incorporated into the zeolite and this indeed is the standard recipe [112 and references within]. Since the exchange occurs at a very localized site, another implication of an ion exchange mechanism is that the uptake should be independent of pH.
While a full review of Pt uptake onto zeolites is beyond the scope of this chapter, a limited number of recent data will be presented that are pertinent to the fundamental considerations being presented. A recent study has been conducted[113] to confirm the ion exchange mechanism over zeolites and to contrast zeolite uptake behavior to that of several common oxides and “zeotype”[114] aluminum phosphate materials. In this study, the uptake of anionic and cationic Pt complexes over zeolites and zeotypes with different PZCs was monitored as a function of pH and was directly compared to alumina and silica materials with similar PZCs.
Figure 27 shows the platinum adsorption results over the zeolites/zeotypes and silica and alumina from 120 ppm CPA solutions. First, alumina and silica both show the expected characteristics of electrostatic adsorption, i.e., uptake
Figure 27 Platinum adsorption from 120 ppm CPA solutions over zeolites, zeotypes, alumina, and silica as a function of the solution pH.[113]

178 |
Regalbuto and Antos |
over alumina (filled circles) below its PZC and negligible uptake over silica (filled triangles). The PZC values of the materials are given in the legend. All tested zeolites show generally very little uptake over the entire pH range. The characteristics of Y-54 are especially noteworthy, as it has a PZC similar to that of alumina, yet it does not show the typical electrostatic uptake behavior. The two zeotypes, MAPSO-31 and SAPO-11, seem to exhibit a limited adsorption with the characteristics of the electrostatic mechanism with uptake below their PZCs (6.4 and 6.3) and drop off toward the low-pH region.
In the same fashion, Figure 28 shows the platinum uptake from cationic platinum tetraamine (TAPC) solutions. Again, alumina and silica display the expected electrostatic adsorption, with the silica surface accruing a much stronger negative charge as pH is increased due to its lower PZC. The zeolites generally show a pH-independent, PZC-independent, complete uptake of cationic platinum, which is likely due to ion exchange with the equilibrium far on the side of Pt2þ in the zeolite. Head-to-head comparisons between alumina and Y-54, with similar high PZC values, and mordenite and silica, with similar low PZCs, again show that platinum adsorption over zeolites cannot be explained with an
Figure 28 Platinum adsorption from 120 ppm TAPC solutions over zeolites, zeotypes, alumina, and silica as a function of the solution pH.[113]
Preparation of Reforming Catalysts |
179 |
electrostatic surface adsorption mechanism. The largely pH-independent but lower uptake of the K-L zeolite is most probably due to its lower exchange capacity. The maximal ion exchange observed here corresponds to only roughly 40% of the theoretically determined values based on aluminum content. It is thought that potassium in L zeolites only partially be exchanged, as some negatively charged framework sites seem to be inaccessible to larger ions.[115] The zeotypes again seem to follow the physical surface adsorption mechanism applicable to silica and alumina, as the uptake of the cationic platinum is negligible below their PZC values of 6.3 and 6.4.
3.4Drying, Oxidation, and Reduction of the Impregnated Support
Drying is intended to eliminate most of the aqueous solution from the pores. It is well known that this operation can cause substantial movements of the solution and hence a significant redistribution of the precursors still present in the dissolved state in the particles of the support. For reforming catalyst in which the uniformly impregnated precursor in the presence of HCl acid is virtually entirely fixed, such a redistribution can be ignored. However, drying may modify the form of the adsorbed platinum complex. In particular, the ligand balance between chloride and hydroxide may change.
Oxidation in air causes further progressive replacement of the chloride ligand by oxygen, with the formation of a complex close to “[PtIVOxCly]”
between 5008C and 6008C, such as the four-ligand complex [PtO2Cl2]22 according to Lieske et al.[116] or the six-ligand complex “[PtO4(5Cl1(5]” according to Berdala et al.[117] This complex [PtIVOxCly] could preferentially occupy the high-energy sites of the alumina,[38] first saturating the kink sites, then the step
sites, and finally occupying the terrace sites.
Simultaneously, oxidation in air causes a decrease in the chloride content of the alumina, whether it is h- or g-Al2O3.[118] The higher the chloride content after
drying, the higher is the decrease. This decrease is also accentuated by the presence of small amounts of water in the air.[118] Under identical conditions,
chloride retention depends on the alumina employed; thus, after oxidation at 5508C, a g-Al2O3 with a surface area of 190 m2 g21 containing 0.9 wt % of
chloride loses 40% of the chlorine, whereas a h-Al2O3 with 200 m2 g21 containing 1 wt % of chloride loses only about 17%.[118]
The reduction step, typically conducted between 5008C and 5508C, converts the above platinum species to highly dispersed platinum metal.[119] EXAFS indicates the formation of small metal particles in which the metal atoms
have four to six immediately neighboring platinum atoms and also indicates the presence of some Pt-O bonds.[117]
180 |
Regalbuto and Antos |
4BIMETALLIC CATALYSTS
The deposition of chloride and platinum on alumina occurs through complex reactions as discussed in Sec. 3. Both elements must be uniformly distributed in the grains of the support, and platinum must be well dispersed at the end of the impregnation step. The good dispersion, obtained as a result of a strong metallic precursor–support interaction, and a uniform macroscopic distribution, obtained in spite of this strong interaction, must be preserved in the subsequent steps of drying, oxidation, and reduction in order to attain excellent catalytic performance and resistance to sintering. These considerations are still valid for multimetallic catalysts, although every additional metal brings its own unique chemistry, which may impose adaptation and optimization of the means of introducing the various metals. In this section the main preparation methods for Pt-Re, Pt-Sn, and Pt-Ir reforming catalysts are described.
4.1Platinum–Rhenium
Formulations based on Pt and Re (typically containing between 0.1 and 0.8 wt %
of each metal) are among the most important industrial reforming catalysts. Such combinations, initially developed by Chevron in 1969,[120,121] increase the
stability of catalytic performance, allowing much longer operating periods of the unit between regenerations. This improved stability is explained by a double
effect of rhenium: higher resistance to deactivation by coking and stability of the metallic phase on the support.[7,23,122] However the presence of rhenium induces
a high degree of hydrogenolysis, which necessitates a sulfurization step during the initial startup of the catalyst.
It is generally accepted that the optimal Pt-Re phase consists of Pt and Re completely reduced to the metal state[123 – 126] and modified with trace sulfur. A fraction of rhenium is alloyed with platinum as bimetallic clusters, and this fraction may vary according to the conditions of preparation. Industrial catalysts have utilized mole ratios of Re/Pt in all proportions from .1 to ,1. Equal molar is another well-represented ratio. The reduction of rhenium oxides is catalyzed by the presence of platinum. Moreover, water increases the mobility of Re oxide on
the surface of alumina; hence, its movement toward neighboring platinum. This favors its reduction and the alloy formation.[127,128]
The widely used platinum precursor for the bimetallic catalyst is the PtCl26 ion. Two types of rhenium precursors can be distinguished: mineral compounds and organometallic compounds.
Mineral Compounds
The main mineral compounds reported in the literature are the heptaoxide, perrhenates (especially NH4ReO4), and some halides (ReCl3). The heptaoxide,
Preparation of Reforming Catalysts |
181 |
which is very soluble in an aqueous acidic solution, easily gives ReO4 anions, which can be fixed on the alumina surface.[129,130] Impregnation chemistry has
not been as well studied as chloroplatinate.
Usually, alumina is impregnated with an aqueous solution containing H2PtCl6, HReO4, and an acid such as HCl. A mathematical model based on
diffusion and adsorption phenomena and successfully predicting the radial profiles of Pt and Re has been proposed by Ardiles et al.[131] Since both
precursors show different affinities for the support, it seems rather difficult to obtain similar distribution profiles of metals even with adjusted conditions.[131 –
133] This is probably why successive impregnations of the two metals are claimed in some patents.[134,135]
After impregnation of the precursors, the impregnated supports are thermally treated. The reactions occurring during the thermal treatment are complicated and poorly understood. Besides the removal of impregnation solvent from the pores of the support, precursors are transformed into oxidized species and then reduced to a highly dispersed bimetallic phase. During these treatments, it is important to control the mobility of Re species on the support surface.
An important feature of bulk rhenium precursors or oxides is their high volatility: the volatilization, which begins at a lower temperature (near 1008C), is complete above 400–4508C. The volatility is decreased considerably by interaction with the alumina support. Therefore, the oxidation temperature of the impregnated catalyst can be adjusted so as to decompose the precursor while preventing the volatilization of rhenium.[136] Thermal oxidation enhances the
dehydration of the alumina surface, leading to more potential interaction between Re2O7 and the support.[127] A more stable Re precursor requires a higher
temperature for its volatilization and/or decomposition, and this leads to an increased dehydroxylation level of the alumina with greater interaction between rhenium and alumina. According to Reyes et al.,[137] ammonium perrhenate, which exhibits the highest stability in oxygen, seems to be the best-suited precursor. A strong interaction between Re2O7 and the support limits the volatization of rhenium oxides and the mobility of rhenium species on the support. As mentioned above, such mobility is needed to favor the platinum– rhenium interaction.[128] Moisture is thus expected to be an important parameter. The oxidation step for these rhenium precursors has only a slight effect on the macroscopic distribution, which is determined during impregnation, but has a strong effect on the “bimetallic nature” of the resulting sites.
Organometallic Compounds
The use of Re2(CO)10 dirhenium decacarbonyl as an organometallic precursor has been reported in numerous papers and patents.[131,138] Techniques using such
182 |
Regalbuto and Antos |
a precursor require either impregnation with an organic solvent or sublimation in an inert gas in the 100–2008C range. This compound can interact either with the alumina support or with the supported platinum. The interaction with alumina is
accompanied by a partial decarbonylation, and ligands exchange with the surface of the support.[138,139] However, the affinity of rhenium carbonyl is higher for
reduced platinum. This limits the fixation of the precursor on the support sites and favors the formation of an alloy.[140,141] The total decomposition step is performed in an inert gas in order to avoid platinum oxidation.[140] The
decomposition can be complicated by the presence of hydroxyl groups, which can lead to oxidized surface complexes.[142] Other types of Re organometallic compounds have been decomposed on reduced platinum. From an industrial point of view, considering the problem of handling and maintaining reduced catalysts and of using nonaqueous solvents, this kind of precursor is less attractive than water-soluble mineral precursors.
4.2Platinum–Tin
The appearance of platinum–tin catalysts in reforming began in the late 1960s with the first patent claiming the use of this type of catalyst for dehydrocyclization reactions.[143] Compared with monometallic systems, tin increases the selectivity and stability of the catalyst. Moreover, resistance to agglomeration of the bimetallic catalysts during coke combustion has increased compared with the corresponding monometallic systems.[144]
From an industrial point of view, the platinum and tin salts used most frequently as precursors are likely to be the chloro derivatives such as H2PtCl6, SnCl2, and SnCl4. The tin and platinum contents of industrial catalytic systems are always less than 0.8 wt %.
After reduction at temperatures higher than 4008C, it is generally accepted that platinum is in a metallic state. The oxidation state of tin is still subject to discussion. Generally, tin is found as Sn(II) together with a more or less important fraction of metallic tin. The ratio of these two tin species depends on the catalyst preparation conditions, analysis techniques used, and treatments undergone by the sample before analysis. This parameter is therefore not treated in this chapter. Further information can be found in Chapter 6 on characterization.
In contrast to rhenium oxide, the high interaction between tin oxide and alumina does not favor mobility of tin on the surface at temperatures achieved during oxidation treatments. This is why the interaction between platinum and tin in platinum–tin bimetallic catalysts must take place during the impregnation step.
Preparation of Reforming Catalysts |
183 |
Alumina-Supported Tin Oxide Preparation
Sol-Gel Techniques. Techniques using the sol-gel transition have been used to prepare reforming catalyst supports containing tin. These techniques consist of introducing a tin salt directly in the alumina sol. In a general way this preparation is performed in an aqueous environment by introducing stannic chloride in the sol obtained by hydrocloric acid attack of aluminum.[145] After
calcination, tin is present only in its oxidized state (stannic oxide-like compound). No tin chloride species can be detected.[146] This technique has been
used with organometallic complexes (tetrabutyltin and tributoxide aluminum) in
an alcoholic medium.[147] With this technique, tin is uniformly distributed on the support, and tin oxide particles larger than 10 nm cannot be detected.[148] Such a
distribution of tin seems important to ensure good performance of the final catalyst.[145,148]
Impregnation of Tin Salts. Although impregnation of tin salts (most often SnCl2 or SnCl4) is often the first step in preparing a reforming catalyst,[149] the
interaction between tin salts and an alumina surface has not been well studied in
the literature. The surface complexes formed during the impregnation of stannic chloride on alumina have been studied by Li et al.[150] They showed that
whatever the impregnation medium of tin may be (water, alcohols, ketones), the surface species formed are the same. Spectroscopic data can be interpreted in terms of tin complexation by a surface hydroxyl.
However, for stannous chloride impregnation on nonchlorided alumina, the mechanism proposed by Kuznetsov et al.,[151] and confirmed by Homs et al. on
silica,[152] occurs via the substitution of a chloride ligand by the oxygen of an OH group, much like the ligand substitution observed with chloroplatinate. On chlorided alumina, stannous chloride is only weakly bonded on the support surface probably through interaction with surface chloride. The tin–support interaction thus obtained should be weaker than the one obtained on nonchlorided alumina in which a chloride ligand is lost by tin. During the drying that follows impregnation, oxidation of tin(II) to tin(IV) is only partial.[146]
In all the cases described, calcination at a high temperature (5008C) results in the formation of supported tin(IV) as SnO2-like compounds, and partially decomposed SnOxCl42x. Contrary to the systems obtained with a sol-gel preparation, tin can keep chloride ligands even after calcination.[146] Moreover, SnO2 crystallites cannot be detected after calcination.
Reduction at around 5008C produces supported tin(II). The nature of this tin species has not yet been clearly described in the literature (SnO-like compounds, surface tin aluminate, etc.). Except for high tin contents (.10 wt %), the reduction of alumina-supported tin oxide never gives metallic tin.
184 |
Regalbuto and Antos |
Impregnation of Platinum Derivatives on Alumina-Supported Tin Oxide
When tin on alumina is obtained by a first impregnation of tin chloride without subsequent oxidation, part of the tin, which is weakly linked on the support, can be dissolved during the subsequent impregnation in the chloroplatinic acid solution. In this case, the impregnation of H2PtCl6 can be described as an impregnation of a mixture of tin and platinum salts.
If the impregnation of platinum salts is performed on an oxidized tin on alumina, two kinds of reaction can occur. Chloroplatinic acid can react with
alumina as described in Sec. 3.3 or with supported tin oxide. The reaction of chloroplatinic acid with the tin oxide surface has been described.[153] As far as
Sn-Pt interaction is concerned, hydroxyl groups in the coordination sphere of the hydrated platinum salt would be displaced by an oxygen from a surface Sn-OH group:
! SnOH þ Pt(OH)nCl26 n ! ! SnOPt(OH)n 1Cl26 n þ H2O
The surface complexes can then be decomposed by hydroxylation and loss of chloride. It is obvious that in order to increase the interaction between tin and platinum during impregnation, the anchoring of the platinum complex must be promoted on tin oxide sites rather than on alumina.
Coimpregnation
The coimpregnation technique offers the advantage of a reduced number of steps in comparison with successive impregnation techniques.[157] During the dissolution of stannous chloride and chloroplatinic acid, the formation of
[55] ´ [159]
bimetallic complexes has been observed. Baronettı et al. have shown that the first step of the reaction is a reduction of platinum(IV) by tin(II):
PtCl26 þ SnCl3 þ Cl ! PtCl24 þ SnCl26
For tin/platinum ratios greater than 1, the first reaction is followed by the formation of bimetallic complexes:[159 – 162]
PtCl24 þ SnCl3 ! PtCl3(SnCl3)2 þ Cl
PtCl3(SnCl3)2 þ SnCl3 ! PtCl2(SnCl3)22 þ Cl
These complexes are generally stable in an acidic environment in an inert atmosphere. During impregnation of such complexes on nonchlorided alumina, precipitation of platinum can occur. This precipitation is due to adsorption of chloride on the support, leading to destruction of the bimetallic complex. Ensuring the stability of the bimetallic complex during all the impregnation steps
Preparation of Reforming Catalysts |
185 |
is important in preserving the platinum–tin interaction. For example, increasing the chloride concentration of the impregnation solution or using a prechlorided alumina can prevent platinum precipitation. After drying and oxidation, this preparation method leads to catalytic systems with a better platinum–tin
interaction compared with successive impregnations of tin and platinum
salts.[144,163 – 166]
Impregnation of Tin Derivatives on Alumina-Supported Platinum
Hydrolysis of tin(IV) organometallic complexes on supported metals has been studied.[154] This method leads to different kinds of bimetallic catalysts and especially alloy formation.[155] Impregnation of tetraethyltin, in argon, on a
reduced alumina-supported platinum precursor gives a selective deposit of tin on the support.[156] On the other hand, if impregnation of the tin complex is
performed in hydrogen, tetraethyltin reacts preferentially on platinum particles leading to a metal surface complex:[154,156]
Pt H þ Sn(C2H5)4 ! PtSn(C2H5)3 þ C2H6
At high temperature the surface complex is decomposed, resulting in a supported platinum–tin alloy.[154,156] These catalyst preparation techniques are not
practiced commercially.
4.3Platinum–Iridium
A bimetallic catalyst of some industrial importance in the past, although less frequently utilized now, is platinum–iridium on chlorided alumina, which appeared in the early 1970s.[167] It can be manufactured from chloroplatinic and chloroiridic acids, either by two successive impregnations,[167] where the platinum is the first metal introduced, or by coimpregnation. The respective behaviors of platinum and iridium in reducing and oxidizing atmospheres are so
different that there is doubt about easily maintaining intimate contact between both metals once it has been obtained. Foger and Jaeger[168] concluded that
obtaining a single-phase Pt-Ir alloy is possible only if the concentrations of Pt and Ir are nearly equal. After oxidation below 3008C, iridium alone is transformed to oxide, and above this temperature iridium oxide crystals segregate. Above 5508C, IrO2 is transported through the gas phase. Such results are completely in accordance with those obtained by Garten and Sinfelt.[169] Highly dispersed bimetallic clusters are obtained through coimpregnation of chloroiridic and chloroplatinic acids if the exposure to air is maintained below 3758C. Around 6008C, large crystallites of iridium oxide are formed, and after reduction the catalyst consists of highly dispersed platinum or platinum-rich clusters and of
186 |
Regalbuto and Antos |
large iridium or iridium-rich crystallites. Sequential impregnation of platinum and then iridium gives exactly the same results. These considerations emphasize the importance of the physical treatment subsequent to the catalyst impregnation.
Huang et al.[170] concluded that incorporation of platinum into iridium clusters retards the oxidative agglomeration of iridium. When bimetallic catalysts were oxidized at 3208C, the majority of the surface species were bimetallic Pt-Ir oxychlorides; no significant IrO2 agglomerates were observed. A few patents claim improved results with the addition to the Pt-Ir couple of a third element
capable of promoting a significant change in the metal–support interaction: chromium oxide[171,172] and silicon, calcium, magnesium, barium, or
strontium.[173] Other techniques and chemistries have been employed. Further details may be found in Chapter 4 of the first edition of this book.[6]
4.4Platinum–Germanium
In general, germanium compounds have chemistries very similar to those of tin. Similar methods of preparation as employed for platinum–tin bimetallic catalysts would be anticipated. The cost of germanium compounds is however substantially higher than that of tin. The preceding consideration on the preparation of bimetallic platinum–tin catalysts with organotin compounds are applicable to germanium. Among the organogermanium compounds that may be employed are tetrabutyl or tetramethylgermane. Some commercial catalysts are cited to contain platinum and germanium, but no precise information is obtainable from the suppliers on content or methods of preparation.
A patent issued to UOP cites coimpregnation of alumina with a mixed solution of chloroplatinic acid and germanium dioxide.[174] Obtaining a homogeneous solution of both compounds requires selection of the hexagonal germanium dioxide, the only soluble form. To improve the solubility, the solution is prepared with hot water immediately before impregnation.
Other multimetallic catalysts containing platinum and germanium have been claimed to have substantially higher selectivities than platinum and platinum–rhenium catalysts. For example, Antos[173] has shown a drastic increase in the hydrogen purity and the gasoline yield with a catalyst containing platinum, rhenium, and germanium. The source of rhenium and germanium is a mixed carbonyl species: [ClGeRe(CO)5]3. A drawback of this preparation is that it requires the use of anhydrous organic solvents, with problems as noted in the section on using carbonyls to prepare bimetallic Pt/Re catalysts.
4.5Other Bimetallic and Multimetallic Catalysts
Some of the patent literature on bimetallic reforming catalysts relates extensive examples of metallic formulations, but, to our knowledge, none have really been
Preparation of Reforming Catalysts |
187 |
utilized commercially. The same may be said for the multimetallic combinations of elements. Chapter 4 in the first edition of this book[6] describes some of the earlier experimental formulations. It is to be understood that very high precursor costs and unusual (i.e., nonaqueous) impregnation techniques pose high barriers in terms of capital investment in catalyst production equipment and high catalyst cost. Any increased value of products must be able to justify the higher catalyst prices that would result.
With this stated, two observations may be added. First, there are certain of the multimetallic combinations that would not be expected to be significantly higher in cost. There are those that employ the already-used components of the bimetallic catalysts—platinum, rhenium, tin, and germanium. In certain applications, or given certain conditions, an advantage will be present for triand even tetrametallic combinations. Since the catalyst costs are somewhat contained—known precursors, known chemistries—various refiners will be able to increase profitability through the use of these multimetallic combinations. The second observation is that multimetallics will be one of the advances for the future of naphtha reforming. Bimetallic combinations usually offer improved performance in only one aspect, such as gasoline yield, or activity. It is easy to conceive that with multiple components, new catalyst formulations will result that offer improvements in both selectivity and activity. Further discussions of new catalyst advances may be found in Chapter 8 of this book.
5METAL PROFILES IN CATALYST PELLETS
Another consideration into which the fundamental focus of this chapter penetrates is the genesis of metal profiles in formed catalyst particles such as spheres or extrudates. Again, while a comprehensive review of the subject cannot be accomplished, some intriguing results consistent with the recent electrostatic interpretation of adsorption will be presented.
The macroscopic distribution of Pt in formed catalysts has been in the
catalysis literature since at least the 1950s, with the work of Maatman and Prater.[175,176] A classic work is that of Lee and Aris,[177] who modeled many
cases of this diffusion–adsorption process. A comprehensive semitheoretical and
experimental survey of this arena was accomplished by the group of Schwarz.[95,178 – 181] The group of Varma has been particularly central in
controlling metal profiles within pellets to achieve optimal selectivity and activity; their work involves both experimental and theoretical components (see their review article[182] as well as references within and thereafter). A recent article by Khinast and coworkers pertains to the impact of drying on metal movement and also contains a good review of the literature.[183]

188 |
Regalbuto and Antos |
A central theme in the diffusion–adsorption literature, dating from the work of Maatman,[90,175] is the role of competitor species in obtaining Pt profiles that
are uniform throughout the pellet (as opposed to surface-deposited “eggshell”, annulus-deposited “egg white”, or center-deposited “egg yolk” distributions). It is widely recognized that uniform distributions require the addition of an excess acid such as hydrochloric or citric acid to the CPA. Maatman proposed that the role of the acid is to provide competitor ions such as Cl2, which forces the chloroplatinate ions to move deeper into the pellet in order to adsorb.[90] This explanation has received widespread support with several exceptions. Heise and Schwarz identified high ionic strength as a key cause of adsorption retardation.[178] Ruckenstein and Karpe[184] also demonstrated that electrostatic effects contribute significantly to the evolution of metal profiles in pellets.
Further indications have appeared that support the electrostatic interpretation and not physical competition. First, as mentioned several times earlier in this chapter, the uptake of Cl2 in the regime where Pt adsorption is retarded has been measured directly;[75] these results are shown in Figure 29. This pH range corresponds to the low end of Figure 9; virtually no uptake of Cl2 is seen as the Pt adsorption drops to 40% of monolayer coverage. The electrostatic
interpretation is that high ionic strength effectively diminishes the adsorption equilibrium constant;[74,79,178] rather than chloride-filled, as assumed by most
“chemical” adsorption models, the surface is empty.
The relevance of these considerations to industrial catalyst preparation was
suggested in Regalbuto’s comprehensive adsorption model, which is shown in Figure 30.[79] In this figure the uptake of CPA is plotted as function of CPA
Figure 29 Chloride uptake as a function of pH in the regime of Pt adsorption.[75]
Preparation of Reforming Catalysts |
189 |
concentration and either equilibrium (Fig. 30a) or final (Fig. 30c) pH. The final pH is plotted as a function of initial pH and metal concentration (Fig. 30b), and the uptake efficiency, or fraction of Pt that is adsorbed, is plotted in Figure 30d. At the high ratio of solid to solution typically employed by industry, and the low weight loadings of Pt employed, surface coverage of Pt is always quite low. The most telling features of this calculation is that when no additional acid is added to the impregnating solution, the amount of alumina surface is sufficiently in excess of protons in solution that the surface is never significantly charged. This is manifested by a final pH value (Fig. 30b) near the alumina PZC. The uptake efficiency for the CPA-only case is low (Fig. 30d). In order to achieve high uptake efficiency through high surface charge (and a corresponding pH appreciably below the PZC; Fig. 30b), an acid such as HCl must be added. It is the proton, however, and not the anion that is the important species in maximizing uptake.
To investigate the effects of diffusion during the impregnation of formed catalysts, a comparison of proton and Pt uptake has been recently made between alumina catalyst spheres and powder made from crushed spheres.[185] The uptake-pH results, in a format similar to Figure 9, are shown in Figure 31a for the spheres and Figure 31b for the crushed spheres. The crushed material behaves as the powdered materials seen in Figure 9. Uptake is essentially complete after 1 h in the mid-to-low pH range. For the spheres, however, practically no Pt uptake was observed in this time frame. The metal profiles at 1 and 48 h were obtained by analytical electron microscopy for the samples impregnated at initial pHs of 1.4 (excess HCl) and 2.5 (CPA only); these results are shown in Figure 32. The depth of 800 mm is the center of the sphere. At 1 h, it is the sample prepared in excess HCl that shows a more homogeneous distribution (diamond symbols, solid line), and this changes relatively little in time (diamonds, dashed line). On the other hand, the CPA-only solution begins with a sharp edge distribution at 1 h, but over time distributes more evenly and attains a much higher loading than does the pH 1.4 sample. The equilibrium metal loading is in fact in agreement with the powder uptake–pH plots seen in Figures 9 and 31. The difference in this behavior can once again be explained on the basis of different proton concentrations; at pH 1.4 the proton concentration was sufficiently high to quickly charge the interior of the particle, whereas at the higher initial pH the interior of the sphere took much longer to charge.
6CONCLUSION
The maturity of the catalytic reforming process and the catalysts utilized in the process is a factor in the information presented in this chapter. Platinum continues to be the workhorse of reforming catalysts. The primary promoters
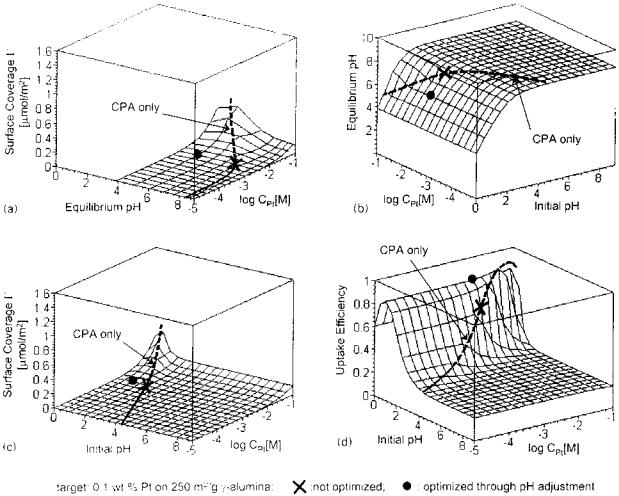
Figure 30 Comprehensive model of CPA uptake onto alumina at high surface loadings.[79]
190
Antos and Regalbuto

Preparation of Reforming Catalysts |
191 |
Figure 31 Platinum adsorption from 180 ppm CPA solutions over 500 m2/liter g- alumina as a function of the solution pH and time, for (a) alumina spheres and (b) crushed alumina spheres.[185]
continue to be tin, rhenium, and germanium. Therefore, the preparation chemistries remain similar to those exemplified in the first edition. Alumina remains the support of choice. Catalyst advances have been made in the intervening time. These have encompassed modifications in the physical and textural aspects of the catalyst support. There have been some changes in metal combinations that have been employed. These changes have probably not required changes in impregnation technology.

192 |
Regalbuto and Antos |
Figure 32 Platinum profiles in catalyst spheres as a function of initial pH and time.[185]
In the first edition[6] the need for fundamental studies was highlighted. This has been an area of advance, as indicated in the extensive improvement in our understanding of platinum impregnation chemistry. Further improvements in understanding will also be required as multimetallic catalyst formulations become more necessary. There is also a need for further understanding of the means for controlling textural properties, such as porosity. These will be important areas for improvements in the future. Chapter 7 of this book is an attempt to derive an optimum porosity for a reforming catalyst. The ability to convert these predictions to working catalysts is a challenge still to be fully met.
REFERENCES
1.Bernard, J.R. Proc. 5th Int. Zeolite Conf., Heyden, London, 1980; 686–695.
2.Bezuhanova. C.; Guidot, J.; Barthomeuf, D.; Breysse, M.; Bernard, J.R. J. Chem. Soc. Faraday Trans. 1 1980, 77, 1595–1604.
3.Hughes, T.R.; Buss, W.C.; Tamm, P.W.; Jacobson, R.L. Stud. Surf. Sci. Catal. In
New Developments in Zeolite Science and Technology; Murakami, Y., Lijima, A., Ward, J.W., Eds.; 1986; Vol. 28, 725–732.
4.Tamm, P.W.; Mohr, D.H.; Wilson, C.R. Stud. Surf. Sci. Catal. In Catalysis 38; Ward, J.W., Ed.; 1988; 335–353.
Preparation of Reforming Catalysts |
193 |
5.Kao, J.L.; McVicker, G.B.; Treacy, M.M.J.; Rice, S.B.; Robbins, J.L.; Gates, W.E.; Ziemiak, J.J.; Cross, V.R.; Vanderspurt, T.H. Proc. 10th Int. Congr. Catal., Budapest, 1993; 1019–1028.
6.Bortiaux, J.P. et al. In Catalytic Naphtha Reforming, Science & Technology; Antos,
G.J., Aitani, A.M., Parera, J.M., Eds.; Marcel Dekker: New York, 1995; 79–111.
7.Little, D.M. Catalytic Reforming; Pennwell Publishing Co.: Oklahoma, 1985.
8.Haensel, V. U.S. Patent, 2,611,736, UOP, 1952.
9.Haensel, V. U.S. Patent, 2,623,860, UOP. 1952.
10.Poisson, R.; Brunelle, J.P.; Nortier, P. Catalyst Supports and Supported Catalysts; Stiles, A.B., Ed.; Butterworth: Boston, 1987; 11–55.
11.Lippens, B.C. University of Delft: Netherlands, 1961; Ph.D. Thesis.
12.Lippens, B.C.; Steggerda, J.J. In Physical and Chemical Aspects of Adsorbents and Catalysis; Linsen, B.G., Ed.; Academic Press: New York, 1970; Chap. 4.
13.Lippens, B.C. Chem. Week B1 1966, 6, 336.
14.Cocke, D.C.; Johnson, E.D.; Merrill, R.P. Catal. Rev. Sci. Eng. 1984, 26, 163–231.
15.Lostaglio, V.J.; Carruthers, J.D. Chem. Eng. Prog. 1986, 82, 46–51.
16.Rhoˆne-Poulenc Documentations: Spheralite, Catalyst Carriers from Rhoˆne-Poulenc and Activated Alumina.
17.Montarnal, R. I.F.P. Internal Report 21074; 1973.
18.Brett, N.H.; Mackenzie, D.K.J.; Sharp, J.H. Q. Rev. 1970, 24, 185–207.
19.Rosinski, E.J.; Stein, T.R.; Fischer, R.H. U.S. Patent 3,876,523, Mobil, 1975.
20.Vishnyakova, G.P.; Dzis’ko, V.A.; Kefeli, L.M.; Kokotko, L.F.; Olen’kova, I.P.; Plyasova, L.M.; Ryzhak, I.A.; Tikhova, A.S. Kinet. Katal. 1970, 11, 1287–1292.
21.Nortier, P.; Fourre, P.; Mohammed Saad, A.B.; Saur, O.; Lavalley, J.C. Appl. Catal. 1990, 61, 141–160.
22.Leonard, A.J.; Van Cuwelaert, F ; Fripiat. J.J. J. Phys. Chem. 1967, 71, 695–708.
23.Gates, B.C.; Katzer, J.R.; Schuit, A.G.C. Chemistry of Catalytic Processes; McGraw-Hill: New York, 1979.
24.Papee, D.; Tertian, R. J. Chim. Phys. 1958, 341.
25.Kno¨zinger, H.; Ratnasamy, P. Catal. Rev. Sci. Eng. 1978, 17, 31–70.
26.Peri. J.B. J. Phys. Chem. 1965, 69, 211–219; J. Phys. Chem. 1965, 69, 220–230; J. Phys. 1965, 69, 231–239.
27.Kno¨zinger, H. Adv. Catal. 1976, 25, 184–271.
28.Vit, Z.; Vala, J.; Malek, J. J. Appl. Catal. 1983, 7, 159–168.
29.Webb, A.N. I.E.C. 1957, 49, 261–263.
30.Boehm, H.P. Adv. Catal. 1966, 16, 179–274.
31.Berteau, P.; Delmon, B. Catal. Today 1989, 5, 121–137.
32.Chapman, D.; Hair, M.L. J. Catal. 1963, 2, 145–148.
33.Antipina, T.V.; Bulgarov, O.V.; Uvarov, A.V. Proc. 4th Int. Congr. Catal., Moscow, 1968; 376–387.
34.Ballou, E.V.; Barth, R.T.; Flint, R.T. J. Phys. Chem. 1961, 65, 1639–1641.
35.Mirschler, A.E. J. Catal. 1963, 2, 428–439.
36.Chernov, V.A. and Antipina. T.V., Kinet. Katal. 7, 651–653 1966.
37.Holm, V.C.F.; Clark, A. Ind. Eng. Chem. 1963, 2, 38–39.
194 |
Regalbuto and Antos |
38.He, J.; Ai, J.; Wu, K.; Luo, X. 5th Natl Conf. Petrol. Petrochem., Shandong, China, 1989.
39.Tanaka, N.; Ogasawara, S. J. Catal. 1970, 16, 157–163; J. Catal. 1970, 16, 164–172.
40.Basset, J.M. University of Lyon, 1969; Ph.D. Thesis.
41.Garbowski, E.; Candy, J.P.; Primet, M. J. Chem. Soc. Faraday Trans. I 1983, 79, 835–844.
42.Melchor, A.; Garbowski, E.; Mathieu, M.; Primet, M. J. Chem. Soc. Faraday Trans I 1986, 82, 1893–1901.
43.Roumegous, A. University of Paris VI, 1978; Ph.D. Thesis.
44.McClung, R.G.; Sopko, J.S.; Kramer, R.; Casey, D.G. NPRA Annual Meeting, San Antonio, 1990.
45.Goble, A.; Lawrence, P.A. Proc. 3rd Int. Congr. Catal., Amsterdam, 1964; 320–324.
46.Brunelle, J.P.; Poisson, R. Mate´riaux de l’Avenir; Rhoˆne-Poulenc, 1991.
47.Hoekstra, J. U.S. Patent 2,620,314, UOP, 1952.
48.Hoekstra, J. U.S. Patent, 2,666,749, UOP, 1954.
49.Wankat, C. U.S. Patent 2,672,453, UOP, 1954.
50.Hoekstra, J. U.S. Patent, 2,774,743, UOP, 1956.
51.Schoonover, M.W. U.S. Patent 4,318,896, UOP, 1982.
52.Wankat, C. U.S. Patent 2,733,220, UOP, 1956.
53.Michalko, E. U.S. Patent 3,027,232, UOP, 1962.
54.Hayes, J.C. U.S. Patent 3,887,492, UOP, 1975.
55.Hayes, J.C. U.S. Patent 3,887,493, UOP, 1975.
56.LePage, J.F. Applied Heterogeneous Catalysis, Technip Ed.; IFP Publications: Paris, 1987.
57.Moehl, R.W., U.S. Patent 2,759,898, UOP, 1956.
58.Murray, M.J. U.S. Patent 2,736,713, UOP, 1956.
59.Vesely, K.D. U.S. Patent 3,496,115, UOP, 1970.
60.Michalko, E. U.S. Patent 4,216,122, UOP, 1980.
61.Trimm, D.L.; Stanislaus, A. Appl. Catal. 1986, 21, 215–238.
62.Brunelle, J.P.; Sugier, A. Compt. Rend. Acad. Sci. Serie C 1973, 276, 1545–1548.
63.Dorling, T.A.; Lynch, J.B.W.; Moss, R.L. J. Catal. 1971, 20, 190.
64.Marcilly, C.; Franck, J.P. Rev. Inst. Fr. Petr. 1984, 39, 337–364.
65.Maatman, R.W.; Prater, C.D. Ind. Eng. Chem. 1957, 49, 253–257.
66.Neimark, A.V., Kheifez, L.I.; Fenelonov, V.B. Ind. Eng. Chem. Process Des. Dev. 1981, 20, 439–450.
67.Weisz, P.B. Trans. Faraday Soc. 1967, 63, 1801–1806.
68.Weisz, P.B.; Hicks, J.S. Trans. Faraday Soc. 1967, 63, 1807–1814.
69.Weisz, P.B.; Zollinger, H. Trans. Faraday Soc. 1967, 63, 1815–1823.
70.Healy, T.W.; White, L.R. Adv. Coll. Interf. Sci. 1978, 9, 303.
71.James, R.O.; Parks, G.A. Surf. Coll. Sci. 1982, 12 119.
72.Jagiello, Contescu and Schwarz.
73.Parks, G.A. Chem. Rev. 1965, 65, 177.
74.Park, J.; Regalbuto, J.R. J. Colloid Interf. Sci. 1995, 175 239–252.
75.Regalbuto, J.R.; Navada, A.; Shadid, S.; Bricker, M.L.; Chen, Q. J. Catal. 1999, 184, 335.
Preparation of Reforming Catalysts |
195 |
76.Sverjensky, D.A.; Sahai, N. Geochimica et Cosmochimica Acta 1996, 60, 3773.
77.Boehm, H.P.; Knozinger, H. In Nature and Estimate of Functional Groups on Solid Surfaces; 1982; Chap. 2.
78.Noh, J.S.; Schwarz, J.A. J. Colloid. Interf. Sci. 1989, 130, 157.
79.Spieker, W.A.; Regalbuto, J.R. Chem. Eng. Sci. 2001, 56, 3491.
80.Brunelle, J.P. Pure Appl. Chem. 1978, 50, 1211.
81.Contescu, C.; Vass, M.I. Appl. Catal. 1987, 33, 259.
82.James, R.O.; Healy, T.W. J. Coll. Interf. Sci. 1972, 40, 65.
83.Benesi, H.A.; Curtis, R.M.; Studer, H.P. J. Catal. 1968, 10, 328.
84.Agashe, K.B.; Regalbuto, J.R. J. Coll. Interf. Sci. 1997, 185 174.
85.Hao, X.; Spieker, W.A.; Regalbuto, J.R. J. Colloid. Interf. Sci., 2003, 267, 259.
86.Regalbuto, J.R. et al. Stud. Surf. Sci. Catal. 1998, 118, 147.
87.Santhanam, N.; Conforti, T.A.; Spieker, W.A.; Regalbuto, J.R. Catal. Today 1994, 21, 141–156.
88.Schreier, M.; Regalbuto, J.R. Manuscript in preparation.
89.Mang, T.; Breitscheidel, B.; Polanek, P.; Kno¨zinger, H. Appl. Catal. A Gen. 1993, 106, 239–258.
90.Maatman, R.W. Ind. Eng. Chem. 1959, 51, 913.
91.Shyr, Y.; Ernst, W. J. Catal. 1980, 63, 425.
92.Papageorgiou, P. et al. J. Catal. 1996, 158, 439.
93.Jianguo, W.; Jiayu, Z.; Li, P. Catalysts III; Poncelet, K G., Grange, P., Jacobs, P.A., Eds.; Elsevier, Amsterdam, 1983; 57 pp.
94.Santacessaria, E.; Carra, S.; Adami, I. Ind. Eng. Chem. Prod. Res. Dev. 1977, 16, 41.
95.Heise, F.J.; Schwarz, J.A. J. Coll. Interf. Sci. 1990, 135, 51.
96.Xidong, W.; Yongnian, Y.; Jiayu, Z. Appl. Catal. 1988, 40, 291.
97.Paulhiac, J.L.; Clause, O. J. Am. Chem. Soc. 1993, 115, 11602.
98.Carrier, X.; Lambert, J.F.; Che, M. J. Am. Chem. Soc. 1997, 119, 10137.
99.Carrier, X.; Lambert, J.F.; Che, M. Stud. Surf. Sci. Catal. 2000, 130, 1049.
100.Davis, J.A.; James, R.O.; Lechkie, J.O. J. Coll. Surf. Sci. 1978, 63, 480.
101.Shelimov, B. et al. J. Am. Chem. Soc. 1999, 121, 545.
102.Shelimov, B. et al. J. Catal. 1999, 185, 462.
103.Shelimov, B. et al. J. Mol. Catal. 2000, 158, 91.
104.Sillen, L.G.; Martell, A.E. The Stability Constants of Metal Ion Complexes; Special Publication No. 25; The Chemical Society: Burlington House, London, 1971; Suppl. No. 1.
105.Cox, L.E.; Peters, D.E. Inorg. Chem. 1970, 9, 1927.
106.Davidson, C.M.; Jameson, R.F. Trans. Farad. Soc. 1965, 61, 2462.
107.Gmelin, L.; Meyer, R.J. Gmelins Handbuch der anorganishen Chemie, Platin, Teil C Lieferung 1, 8. Auflage, Verlag Chemie: Weinheim, 1939.
108.Miolati, A.; Pendini, U. Z. Anorg. Chem. 1903, 33, 251.
109.Spieker, W.A. et al. Appl. Catal. A: Gen 2002, 232, 219.
110.Spieker, W.A. et al. Appl. Catal. A: Gen 2003, 243, 253.
111.Breck, D.W. Zeolite Molecular Sieves. Structure, Chemistry and Use; Wiley, New York, 1974.
196 |
Regalbuto and Antos |
112.Ertl., G.; Koningsberger, D.; Weitkamp, J. Preparation of Solid Catalysts; WileyVCH: Weinheim, Germany, 1999.
113.Spieker, W.A. University of Illinois at Chicago, 2001; Ph.D. Dissertation.
114.Dyer, A. An Introduction to Zeolite Molecular Sievers; Wiley: Chichester, 1988.
115.McNicol, D. J. Catal. 1977, 46, 438.
116.Lieske, H.; Lietz, G.; Spindler, H.; Vo¨lter, J. J. Catal. 1983, 81, 8–16.
117.Berdala, J.; Freund, E.; Lynch, J. J. Phys. 1986, 47, 269–272.
118.Sivasanker, S.; Ramaswamy, A.V.; Ratnasamy, P. Stud. Surf. Sci Catal. Preparation of Catalysts II; Delmon, B., Grange, P., Jacobs, P.A., Poncelet, G., Eds.; 1979; Vol. 3, 185–196.
119.Lietz, G.; Lieske, H.; Spindler, H.; Hanke, W.; Vo¨lter, J. J. Catal. 1983, 81, 17–25.
120.Jacobson, R.L.; Kluksdahl, H.E.; McCoy, C.S.; Davis, R.W. Proc. Amer. Petrol. Inst. Div. Refining 1969, 49, 504.
121.Jacobson, R.L.; Kluksdahl, H.E.; Spurlock, B. U.S. Patent 3,434,960, Chevron, 1969.
122.Bertolacini, R.J.; Pellet. R.J. Stud. Surf. Sci. Catal. In Catalyst Deactivation; Delmon, B., Froment, G.F., Eds.; 1980; Vol. 6, 73–77.
123.Johnson, M.F.; Leroy, V.M. J. Catal. 1974, 35, 434–440.
124.McNicol, D. J. Catal. 1977, 46, 438.
125.Charcosset. French-Venezuelian Congress, Caracas, 1983.
126.Betizeau, C.; Bolivar, H.; Charcosset, R.; Frety, G.; Leclercq, R.; Maurel; Tournayan, L. Stud. Surf. Sci. Catal. In Preparation of Catalysts I; Delmon, B., Jacobs, P.A., Poncelet, G., Eds.; 1976; 525–536.
127.Ziemecki, S.B.; Jones, G.A.; Michel, J.B. J. Catal. 1986, 99, 207–217.
128.Wagstaff, N.; Prins, R. J. Catal. 1979, 59, 434–445.
129.Acres, K.B.J.; Bird, A.J.; Jenkins, J.W.; King, F. The design and preparation of supported catalysts. Spec. Period. Rep. Catal. 1981, 4, 1–30.
130.Pascal, P. Chimie Mine´rale; Masson: Paris, 1978; Vol. 10.
131.Ardiles, D.R.; De Miguel, S.R.; Castro, A.A.; Scelza, O.A. Appl. Catal. 1986, 24, 175–186.
132.Hegedus, L.L.; Chou, T.S.; Summers, J.C.; Poter, N.M. Stud. Surf. Sci. Catal. In Preparation of Catalysts II; Delmon, B., Grange, P., Jacobs, P.A., Poncelet, G., Eds.;1979; Vol. 3: 171–183.
133.De Miguel, S.R.; Scelza, O.A.; Castro, A.A.; Baronetti, G.T.; Ardiles, D.R.; Parera,
J.Appl. Catal. 1984, 9, 309–315.
134.Hayes, J.C. U.S. Patent 3,775,301, UOP, 1973.
135.Kluksdahl, E. U.S. Patent 3,558,477, Chevron, 1968.
136.Bolivar, C.; Charcosset, H.; Frety, R.; Primet, M.; Tournayan, L.; Betizeau, C.; Leclercq, G.; Maurel, R. J. Catal. 1975, 39, 249–259.
137.Reyes, J.; Pecchi, G.; Reyes, P. J. Chem. Res. 1983, 318–319.
138.Smith, A.K.; Theolier, A.; Basset, J.M.; Ugo, R.; Commereuc, D.; Chauvin, Y.
J.Am. Chem. Soc. 1978, 100, 2590–2591.
139.Danilyuk, A.F.; Kuznetsov, V.L.; Shepelin, A.P.; Zhdan, P.A.; Maksimov, N.G.; Magomedov, G.I.; Ermakov, Y.I. Kinet. Katal. 1983, 24, 919–925.
Preparation of Reforming Catalysts |
197 |
140.Antos, G.J. U.S. Patent 4,136,017 and 4,159,939, UOP, 1979.
141.Bernard, J.R.; Breysse, M. French Patent 2479707, Elf, 1980.
142.Brenner, A.; Hucul, D.A. J. Catal. 1980, 61, 216–222.
143.Compagnie Francaise de Raffinage, French Patent 2031984, 1969.
144. Yining, F.; Jingling, Z.; Liwu, L. J. Catal. (Cuihua. Xuebao) 1989, 10, 111–117.
145.Rausch, R.E. U.S. Patent 3,745,112, UOP, 1973.
146.Li, Y.X.; Klabunde, K.J.; Davis, B.H. J. Catal. 1991, 128, 1–12.
147.Gomez, R.; Bertin, V.; Ramirez, M.; Zamudio, T.; Bosch, P.; Schifter, I.; Lopez, T. J. Non. Cryst. Solids 1992, 147, 748.
148.Chee, T.; Targes, W.M.; Moser, M.D. U.S. Patent 4,964,975, UOP, 1990.
149.Engelhard, P.; Szabo, G.; Weisang, J.E. U.S. Patent 4,039,477, CFR, 1977.
150.Li, Y.X.; Zhang, Y.F.; Klabunde, K.J. Langmuir 1988, 4, 385–391.
151.Kuznetsov, V.I.; Belyi, A.S.; Yurchenko, E.N., Smolikov, M.D.; Protasova, M.T.; Zatolokina, E.V.; Duplyakin, V.K. J. Catal. 1986, 99, 159–170.
152.Homs, N.; Clos, N.; Muller, G.; Sales, J.; Ramirez de la Piscina, P. J. Mol. Catal. 1992, 74, 401–408.
153.Cox, D.F.; Hoflund, G.B.; Laitinen, H.A. Langmuir 1985, 1, 269–273.
154.Travers, C.; Bournonville, J.P.; Martino, G. Proc. 6th Int. Congr. Catal., Berlin, 1984; 891–902.
155.Ve´rtes, C.; Talas, E.; Czako-Nagy, I.; Ryczkowski, J.; Go¨bo¨lo¨s, S.; Vertes, A.; Margitfalvi, J. Appl. Catal. 1991, 68, 149–159.
156.Stytsenko, V.D.; Kovalenko, O.V.; Rozovski, A.Y. Kinet. Katal. 1989, 32, 163–169.
157.Kluksdahl, H.E.; Jacobson, R.L. French Patent 2076937, Chevron, 1971.
158.Young, J.F.; Gillard, R.D.; Wilkinson, G. J Chem. Soc. 1964, 5176–5189.
159.Baronetti, G.; De Miguel, S.; Scelza, O.; Fritzler, A.; Castro, A. Appl. Catal. 1985, 19, 77–85.
160.Berndt, V.H.; Mehner, H.; Vo¨lter, J.; Meisel, W. Z. Anorg. Allg. Chem. 1978, 429, 47–58.
161.Yurchenko, E.N.; Kuznetsov, V.I.; Melnikova, V.P.; Sartsev, A.N. React. Kinet. Catal. Lett. 1983, 23, 113–117.
162.Jin. Appl. Catal. 1991, 72, 33–38.
163.Baronetti, G.; De Miguel, S.; Castro, A.; Scelza, O.; Castro, A. Appl. Catal. 1988, 45, 61–69.
164.Davis, B.H. Proc. 10th Int. Congr. Catal., Budapest, 1992; 889–897.
165. Sachdev, A.; Schwank, J. Proc. 9th Int. Congr. Catal., Calgary, 1988; 1275–1283.
166.Baronetti, G.; De Miguel, S.; Scelza, O.; Castro, A. Appl. Catal. 1986, 24, 109–116.
167.Buss, W.C. U.S. Patent 3,554,902, Chevron, 1971.
168.Foger, K.; Jaeger, H. J. Catal. 1981, 70, 53–71.
169.Garten, R.L.; Sinfelt, J.H. J. Catal. 1980, 62, 127–239.
170.Huang, Y.J.; Fung, S.C.; Gates, W.E.; Vicker, G.B.M. J. Catal. 1989, 118, 192–202.
198 |
Regalbuto and Antos |
171.Anders, K.; Becker, K.; Birke, P.; Engels, S.; Feldhaus, R.; Hager, W.; Lausch, H.; Mahlow, P.; Neubauer, H.D.; Sager, D.; Wilder, M.; Vieweg, H.G. DDR Patent 212 192, Leuna Werke, 1982.
172.Kresge, C.T.; Chester, A.W.; Oleck, S.M. Appl. Catal. 1992, 81, 215–226.
173.Antos, G.J. U.S. Patent 4,312,788, UOP, 1992.
174.McCallister, K.R.; O’Neal, T.P. French Patent 2078056, UOP, 1971.
175.Maatman, R.W. and Prater, C.D. Ind. Eng. Chem. 1957, 49, 253.
176.Maatman, R.W., Ind. Eng. Chem. 1959, 51, 913.
177.Lee, S.-Y.; Aris, R. Catal. Rev. Sci. Eng. 1985, 27, 207.
178.Heise, F.J.; Schwarz, J.A. J. Coll. Interf. Sci. 1985, 107, 237.
179.Heise, F.J.; Schwarz, J.A. J. Coll. Interf. Sci. 1986, 113, 55.
180.Heise, F.J.; Schwarz, J.A. J. Coll. Interf. Sci. 1988, 123, 51.
181.Heise, F.J.; Schwarz, J.A. J. Coll. Interf. Sci. 1990, 135, 461.
182.Gavriilidis, A.; Varma, A.; Morbidelli, M. Catal. Rev. Sci. Eng. 1993, 399.
183.Azzeddine, L.; Glasser, B.J.; Khinast, J.G. Chem. Eng. Sci. 2001, 56, 4473.
184.Ruckenstein, E.; Karpe, P. Langmuir 1989, 5, 1393.
185.Regalbuto, J.R. Manuscript in preparation.
6
Characterization of NaphthaReforming Catalysts
Burtron H. Davis
University of Kentucky
Lexington, Kentucky, U.S.A.
George J. Antos
UOP, LLC
Des Plaines, Illinois, U.S.A.
1INTRODUCTION
Naphtha reforming involves heterogeneous catalysis so that the catalyst constitutes a separate phase.[1] Furthermore, naphtha reforming occurs by bifunctional catalysis.[2] This means that for a Pt-Al2O3-reforming catalyst, some of the processes occur at the surface of platinum or other metal(s) and others at the acidic sites on the alumina or other support. For optimal performance, these two or more types of sites are intermixed on the same primary particles. Characterization of naphtha-reforming catalysts therefore presents many obstacles. One must be aware of the assumptions that enable one to convert the experimental data to conclusions that define the catalyst structure. Unfortunately, all too often the assumptions are overlooked in developing models of reforming catalysts.
At the most elementary level, characterization of a reforming catalyst involves only two topics: (1) a measure of the amount together with the strength and distribution of the acid function and (2) a measure of the amount and activity of the metallic function. Needless to say, topic 2 becomes more difficult when the catalyst contains two or more metallic components.
Two levels of characterization data may be distinguished. One type of data is needed to address engineering applications. Here one is concerned with a characterization of those features that will (1) permit the catalyst manufacturer to prepare repetitively a catalyst with the same properties and (2) provide the
199
200 |
Davis and Antos |
process operator with the ability (a) to bring the catalyst on stream with the required activity and selectivity, (b) to monitor catalyst performance, and (c) to adjust the state of the working catalyst to maintain performance specifications for a long period of operation. The engineering approach requires only that the properties that are characterized be related to the performance of the catalyst; it does not have to provide an accurate measure of the absolute value of a particular feature of the catalyst. For example, if it is found that 20 ppm of chlorine in the exit gas provides the optimal activity and selectivity for naphtha reforming with a particular catalyst, the engineering method requires only a measure of the chlorine in the exit gas. It is not necessary to know the amount of chloride incorporated or its chemical state in the working catalyst. Characterizations for engineering purposes are essential for the successful application of catalysts in commercial naphtha operations.
However, the discovery of new catalyst formulations or the improvement of existing formulations normally results from application of scientific models of the catalyst. For this purpose, the engineering characterizations seldom have value. What is needed for new catalyst design may be considered to be standard characterization procedures that allow for an accurate measure of the absolute value and the chemical nature of a specific catalyst feature or catalytic site. Here one must define a specific feature of the catalyst and devise a method to make an accurate and exact measure of the feature. Of necessity, this involves definitions and terminology.[1] At first glance, this requirement appears to be easy to meet; however, in practice it proves frequently to be an extremely demanding task.
It would be desirable to describe in detail the experimental techniques that are appropriate for the characterization of naphtha-reforming catalysts, along with results from studies and their interpretation. However, a large volume would be required to do this. Thus, the present chapter will emphasize results obtained using many experimental techniques rather than an in-depth investigation of the techniques. Interpretations of these studies for a number of reforming catalysts are presented. The reader may see the diversity of experimental approaches and interpretations that are in the literature and may use this chapter as a guide for further investigations.
2ALUMINA SUPPORTS
2.1Surface Area and Porosity
The physical characteristics of naphtha-reforming catalysts are determined primarily by the material that serves as a support for the metal or bimetallic function. Alumina is the support for nearly all reforming catalysts. The strength of the macroscopic catalyst particle is an important property. However, measurement techniques are not straightforward. For most fixed-bed operations,
Characterization of Naphtha-Reforming Catalysts |
201 |
if a catalyst can survive the handling during manufacturing and loading, it has adequate strength. Moving-bed operations have their own strength requirements. The reader is best referred to catalyst suppliers or the American Society for Testing and Materials (ASTM) for further information. Some discussion of strength issues may also be found in Chapters 8 and 11 of this edition.
The surface area is one of the most important physical properties of the catalyst. One of the first techniques introduced for the characterization of catalysts was the measurement of the surface area by the use of gas adsorption and the application of the Brunauer–Emmett–Teller BET equation.[3] This method grew from a desire to learn whether it was the specific nature or the extent of the surface that controlled catalytic activity and selectivity.[4] The Brunauer– Emmett–Teller (BET) method was introduced more than 50 years ago and is still the most widely utilized catalyst characterization technique. Detailed descriptions of this method are plentiful.[5] Today the gas adsorption is accomplished by automated instruments that permit measurements to be simultaneously made on multiple samples. These instruments can convert the data to provide measurements of both the surface area and the porosity.
The validity of the BET technique as an absolute method is still debated. The BET equation is based on a simple model, and the validity of some of the assumptions made for its derivation is questionable.[6] It is a very adequate technique for measuring the total surface area and as an engineering method the technique is quite acceptable.[7] In spite of numerous attempts to place the BET equation on a firmer basis or even to supplant it, such as with the introduction of fractal theory,[8] a realistic assessment would lead one to conclude that these attempts have led to more complex, and not more accurate, equations. For the current naphtha-reforming catalysts, the BET equation therefore provides both the engineering and the absolute characterization technique for measuring the total surface area.
A complete assessment of porosity is usually obtained by a combination of gas adsorption and mercury penetration measurements. Gas adsorption is applicable for those pore sizes falling within the range of about 0.5–40 nm; however, some of the newer instruments are claimed to be capable of making measurements that permit the upper limit to be extended to 100 nm. For pores in the range of about 10–5000 nm diameter, mercury porosimetry is applicable. For most materials, a direct comparison of the results from the two measurements can
be made.[9] Early calculations of the porosity followed the approach of Barrett et al.[10] and then the one formulated by Wheeler[11] in his classic treatment of
the role of diffusion in catalysis. With the introduction of the automated instrumentation, the isotherm of Dollomire and Heal[12] was utilized frequently. Other more complex approaches have been utilized for the calculation.[13 – 23]
Nearly all physisorption isotherms may be grouped into the six types shown in Figure 1a.[24,25] From the type of isotherm, a general idea of the structure of the

202 |
Davis and Antos |
Figure 1 (a) Types of physisorption isotherms. (b) Types of hysteresis loops (from Ref.[24]).
material may be deduced. Four types of hysteresis are illustrated in Figure 1b. In most cases, the naphtha-reforming catalyst will produce either a type II or IV isotherm with H1, H2, or H3 type of hysteresis. In these cases an analysis of the pore size can be obtained from either the adsorption or desorption isotherm, with the desorption isotherm being utilized more frequently.[26 – 31] For comparative purposes, consistency of use of model and standard isotherm is probably more important than the actual choice of model.
A method with potential to characterize naphtha-reforming catalysts has recently been described.[32] The authors use an apparatus similar to the standard flow instruments but with a modification to permit in situ surface area measurements at various points in the catalyst characterization. For example, the surface area of the catalyst could be measured, without removal from the reactor, at various stages of chloriding or fluoriding. To compensate for the gas flow changes that occur as the sample is cycled from the temperature of the pretreatment procedure to that for the surface area measurement, a standard gas flow bypasses the catalyst chamber. Without correcting for the change in gas flow, errors as great as 50% can be introduced for the surface area measurement.
An approach utilizing the pore size distribution to provide an improved catalyst has been disclosed.[33] A Pt-alumina catalyst using a support of primarily h- alumina that possessed a narrow pore size and acidity exhibited an isomerization activity that was related to the pore–acidity index. The index is defined as
Characterization of Naphtha-Reforming Catalysts |
203 |
[(100)(pore diameter; d)(acidity; mmoles TMP (trimethylphosphine)/g)]/(surface area (m2/g)). It is believed that a pore–acidity index of at least 7.0 results in a balance of mass transfer and reaction kinetics to provide both high activity and superior isomerization selectivity.
The theory of mercury penetration used for measuring porosity was developed by Washburn in 1922, but the first measurements were not made for more than 20 years when Ritter and Drake[34] introduced an experimental approach that was eventually developed into a commercial instrument. Today commercial, computer-controlled instruments are available. For materials with pore sizes that permit a direct comparison between the results of the two techniques—gas desorption isotherm and mercury penetration—the two methods provide reasonable agreement. There are small differences in the distributions that are calculated using different models[26 – 31] with nitrogen adsorption or desorption isotherm data, and there is reasonable agreement with distributions calculated from mercury penetration data. The difference between the two methods becomes less than 20% when various correction procedures are used. The presence of metals on a support may cause a significant alteration of the contact angle needed to provide agreement of the two methods, and the angle needed may depend on the metal loading.[35]
In spite of its maturity, the adsorption technique remains of interest. One reason is that materials with well-defined porosity continue to become available. Zeolites were the first, but these have now been extended to 20 nm with the introduction of the MCM-41-type materials. These materials have allowed one to test theoretical equations against model catalysts to improve the confidence in the theoretical equations. The other reason for this is that more advanced theories of diffusion and kinetics require better definitions of the nature of the porosity of the materials. Thus, during the past 10 years, Chemical Abstracts has received more than 2000 entries for surface area and porosity measurements.
Leofanti et al.[36] have recently reviewed approaches to the measurement of surface area and pore texture of catalysts and provide their choices. An authoritative summary has been provided in a recent volume by Rouquerol et al.[37] In addition to a characterization technique, the porosity may be used as a guide to catalyst preparation. For example, Sharma et al.[38] have studied the role of mesopores of the alumina support on the Pt dispersion in a Pt-Sn-alumina catalyst. They indicate that mesopores in the 2- to 10-nm-diameter range are of paramount importance in Pt-Sn-alumina used in a continuous catalyst regeneration process and at least 30% pore volume should lie in this range to attain a Pt dispersion greater than 70%. A compromise has to be made between pore volume, pore size distribution, and metal dispersion. However, much more work is needed, based on open literature, before this compromise can be defined.
204 |
Davis and Antos |
Other techniques are available for porosity measurements but they are not ordinarily utilized with reforming catalysts. For example, Ritter utilized the data from small-angle X-ray scattering measurements to calculate a pore size distribution. While there have been significant advances in the theory needed to calculate a pore size distribution from small-angle X-ray scattering, currently it is not frequently used to characterize reforming catalysts. As noted below, this will probably change.
2.2Acidity
The other important feature of the support is a measure of its acidity. Measurements of acidity have assumed an increasingly important role in catalyst characterization. Benesi and Winquist[39] provided a concise and precise description of what is involved in terms of electron pair acceptors for Lewis and Brønsted acid sites on surfaces of metal oxides. A characterization of acidity should provide a measure of at least three quantities: (1) the acid type (Brønsted or Lewis); (2) the acid site density; and (3) the acid strength distribution. A characterization of acidity therefore involves a definition of all three quantities. A number of approaches have been utilized for the characterization of these, and they include:
1.Hammett indicators. These are compounds that combine with the acid to form a color that differs from the uncombined molecule.
2.Probe molecules. These molecules are strong enough bases that they appear to react irreversibly with the acid site.
3.Probe reactions. These involve a simple reaction whose rate or selectivity depends on the acidity of the catalyst. Since reactions are covered in other chapters, this topic will not be discussed here.
Hammett acidity measurements involve the adsorption of indicators from suitable nonaqueous solvents that do not interact with the catalyst acid sites. Walling[40] defined the acid strength of a solid as its proton-donating ability, H0. Benesi[41] utilized a number of indicators that could be related through their color change to the composition of a sulfuric acid solution that gave an equivalent color. Thus, the use of a series of indicators allows for a bracketing of the acidity of the catalyst between a high and low range.
Hammett indicators have several disadvantages when they are employed to measure the acidity of solids: (1) visually it is difficult to detect color changes; (2) many of the indicators are too large to penetrate any microporosity that is present; (3) the measurements are nearly always made far from the reaction conditions; and (4) they may not distinguish Lewis and Brønsted acid sites. Alternatively, arylmethanols react with strong protonic acids with the resulting conjugate acid being a colored carbenium ion. These arylmethanol–
Characterization of Naphtha-Reforming Catalysts |
205 |
carbenium ion equilibria have been used to define an alternate acidity function,[42 – 44] which has been previously designated as Co, Jo, and HR. The adsorption of these bases may provide a measure of the number and strength of the acid sites, but they reveal very little information about the structure of the catalyst site.[45 – 47]
Alumina is not the ideal material to characterize using Hammett indicators. Following activation at moderately high temperatures (400–7008C) in either vacuum, air, or oxygen, alumina loses many, but not all, of the hydroxyls. Those that remain do not exhibit strong acidity[48] and exist in a variety of coordination states.[49] One of the types of hydroxyls is considered to be basic because it will react with CO2 to form the bicarbonate ion.[50 – 52] The dominant portion of the activated alumina surface is composed of several types of oxide ions; many are a result of the elimination of water from two hydroxyl groups during the activation
process. The surface also contains coordinatively unsaturated sites (cus): aluminum ions that impart Lewis acidity to the activated alumina.[48,53] Hammett
indicators cannot begin to adequately characterize the complete surface of aluminas.
Infrared Spectroscopy
In general, infrared (IR) is not very well suited to the direct examination of the reforming catalyst. Thus, the characterization nearly always involves the adsorption of one or more molecules on the reforming catalyst using IR to distinguish the interaction of the probe molecule with a feature of the catalyst. Eischens and Pliskin showed the utility of IR spectroscopy for the measurement of acidity and metal–adsorbate interactions.[54] These authors showed that the adsorption of a base such as ammonia could provide a quantitative measure of Brønsted and Lewis acid sites. Brønsted sites were identified with bands characteristic of the formation of the ammonium ion and the Lewis sites by bands characteristic of covalent bonding. Since then there have been tremendous advances in the instrumentation with computer-controlled instruments providing subtraction of background absorption and allowing detection of adsorbed species at much lower levels than was previously possible.[55 – 58]
The spectra of hydroxyl groups of alumina are shown in Figure 2.[59] Three bands with maxima at about 3800 (I), 3745 (II), and 3700 (III) cm21 are reported in most papers.[60 – 63] Depending on the extent of dehydration, additional absorption bands at 3780, 3760, and 3733 cm21 may be obtained. The bands do not appear to depend on alumina crystal phase to a significant extent.[59] Based on extensive study, Peri[49] proposed a detailed model of an alumina surface (Fig. 3). In this model a surface hydroxyl group may have 0, 1, 2, 3, or 4 oxygen ions in their nearest environment, and this classification of the hydroxyl types made it
206 |
Davis and Antos |
Figure 2 Spectrum of hydroxyl groups of alumina: (1) after evacuation at 7008C; (2) the same, at 8008C; (3) the same, at 9008C; (4) emission background. The Roman numerals correspond to the interpretation of the bands given in Fig. 5 (from Ref.[59]).
possible to explain the position and relative intensities of the bands shown in the spectra in Figure 2 after different heat treatments. The concentration of a completely hydroxylated g-Al2O3 was determined by deuterium exchange to be
1.3 1015/cm2. The concentration of a similar g-Al2O3 after evacuation at 5008C was 3.6 1014 per cm2.[64]
The adsorption of ammonia was followed by combined gravimetric measurements and IR spectrometry.[65] It was found that ammonia bonded with all five types of hydroxyl groups, and in addition to molecular adsorption of ammonia, surface reactions may occur at higher temperatures. The spectra of pyridine following adsorption on alumina and subsequent evacuation at increasing temperatures (Fig. 4)[48] shows molecularly adsorbed pyridine, which is removed by evacuation at 1508C, and also bands at 1632 and 1459 cm21 which are not removed even at 5658C. These bands are similar to those that result

Characterization of Naphtha-Reforming Catalysts |
207 |
Figure 3 Five types of hydroxyl ions (designated by Roman numerals) on the surface of
partially dehydroxylated alumina. The sign ‘ þ ’ designates the Al3þ ion in a deeper layer (from Ref.[59]).
from the complex formed between pyridine and gas-phase Lewis acids; therefore, it was concluded that these bands are characteristic of bonding due to Lewis acids. The spectrum of adsorbed pyridine on alumina did not show the absorption band at 1540 cm21 characteristic of the pyridinium ion formed by interaction with a Brønsted site.
The acid strength of the Lewis sites is significant and shows a broad distribution. The acid strength of the Lewis site depends on the degree of unsaturation of the Al3þ ion and the tetragonal Al3þ ion exposed in a vacancy is a stronger site than an octahedral Al3þ site.[66] Heats of chemisorption for pyridine on g-alumina after heating at 770 K range from 90 to over 120 kJ/mole, and chemisorbed pyridine cannot be quantitatively desorbed at temperatures below 750 K where it begins to decompose.[66] Steric hindrance is critical with bulky probe molecules for IR studies. For this reason, work has been typically carried out with smaller molecules to probe acid sites.
Busca[67] indicates that ‘in spite of its toxicity, bad smell, low volatility and solubility in greases and rubber, giving rise to pollution of the vapormanipulation pumps, pyridine is the most largely used basic probe molecule for surface acidity characterization’ (Fig. 5). However, as it continues to be used, the specific assignment of the bands to specific sites on the catalyst becomes a more
demanding task, and theoretical approaches are being used to assist in this task.[68]

208 |
Davis and Antos |
Figure 4 Spectra of pyridine adsorbed on alumina: (1) spectrum of g-Al2O3 after evacuation at 4508C for 3 h; (2) after adsorption of pyridine at 258C; (3) after evacuation
for 3 h at 1508C; (4) the same, at 2308C; (5) the same, at 3258C; (6) the same, at 5658C. (From Ref.[48].)
Pyridine may also react with the surface to produce yet another complication in interpretation. Lavalley[69] reports data obtained by Bovet[70] for adsorption of pyridine on ZnO. Bovet postulated that dissociative adsorption of pyridine led to cleavage of the C22H bond at the ortho position to provide a
band at 1546 cm21. Using pyridine to characterize sulfated zirconia, it was found that a band at about 1640 cm21 was formed.[71] This band was attributed to
oxidation of pyridine in the ortho position with the formation of a ‘pyridone-like’ structure. The pyridone-like band was similar to one reported to be formed as pyridine adsorbed on alumina was heated.[72]

Characterization of Naphtha-Reforming Catalysts |
209 |
Figure 5 Scheme 2 (from Ref.[67]).
The variety of molecules used in IR studies to define acidity continues to expand and has been extended to a definition of the basic sites.[69,73] In addition,
the use of Raman and IR spectroscopies in combination provides additional information and increases the reliability of the conclusions.[74 – 76]
A potential complication is that the coadsorption of pyridine and hydrogen on a platinum surface leads to the formation of pyridinium ions.[77] However, as the measurement is usually conducted with reforming catalysts, this should not be
a significant factor.
Results obtained by Kazansky et al.[78] show that the low-temperature adsorption of dihydrogen is a promising approach for the characterization of Lewis acid sites. A frequency shift of 180 cm21 toward lower values relative to the H-H stretching frequency of the free molecule was observed for h-alumina pretreated at 870 K. This shift in frequency is taken to be a measure of the polarizing power of the Al3þ (cus).
Carbon monoxide has also been utilized to probe the acidity of alumina.[79] The spectra recorded for adsorption of CO on g-alumina with increasing partial pressure at 77 K resulted in bands ascribed to CO s-bonded to strong cationic Lewis acid sites (2238 cm21), CO s-bonded to bulk tetrahedral Al3þ ions on the surface (2210–2190 cm21), CO s-bonded to octahedral Al3þ ions on the surface (2165 cm21), and physically adsorbed CO (3135–2140 cm21). For adsorption of CO at room temperature, the peaks are not well resolved and depend on the alumina sample. Thus, for well-crystallized and pure-phase h-alumina two relatively well-resolved bands are found, whereas for microcrystalline specimens
ex-boehmite (g- and d-alumina) there are probably more than two bands that are not well resolved.[80] For the g-alumina dehydrated at a low temperature, the two
CO bands are centered at about 2230 and 2200 cm21; dehydration at 1023 K causes the whole 2250–2190 cm21 spectral range to be occupied by a broad, asymmetrical, and unresolved band. For aluminas calcined at a higher temperature to produce mixed d,u-alumina phases, the band becomes sharper
210 |
Davis and Antos |
with the elimination of a significant fraction of the stronger acid sites that produce the higher frequency band.
Calorimetry
The reaction of an acid with a base generates heat, so that another way to determine the acidity is by calorimetry; chemisorption on the metal function is also exothermic, so that calorimetry is applicable for this measurement as well. The equipment used for this measurement is illustrated in a recent publication using a commercially available instrument modified to make it applicable for catalyst studies.[81] The instrument was capable of operation down to 200 K. In addition, a number of changes were made in the gas-handling system and the calorimeter that enhanced the sensitivity and accuracy by minimizing baseline perturbations after switching from the purge gas to a stream containing the adsorbate.
The investigation of the acidity and basicity of 20 metal oxides was conducted by Gervasini and Auroux[82] with microcalorimetry. Alumina was
among the group of oxides showing amphoteric character by adsorbing both ammonia and carbon dioxide. Cardona-Martinez and Dumesic[83,84]
included alumina in their study of the differential heat of pyridine adsorption. They found three regions of nearly constant heats of adsorption with increasing amine coverage; this implies that there are three sets of acid sites of different strength. It is surprising that more use has not been made of calorimetry in the characterization of naphtha-reforming catalysts.
The application of microcalorimetric techniques for characterization of acid–base catalysts has been reviewed recently.[85] The usefulness of the
technique has been demonstrated for the Pt-L-zeolite catalyst.[86] The results indicated that the adsorption of CO on fresh Pt-SiO2 and Pt-L-zeolite catalysts evolved similar quantities of heat and Pt adsorption strength; however, as carbon was deposited the adsorption heat decreased on the Pt-silica catalyst but remained constant with the Pt-L-zeolite catalyst. In this example, the heat may be generated by adsorption on both the metal and acid site.
2.3Chlorided Catalysts
The regulation of the Cl concentration on the surface of the bifunctional catalyst is a key factor in the optimization of the reforming process. An optimal chloride concentration allows enhancement of the acidic function of the catalyst[87] and an
improvement in the self-regeneration capability of the ‘coked’ Pt/g-Al2O3 system, presumably because of more effective H2 spillover.[88,89] In addition,
oxidative treatment (400 T 5508C) in the presence of chlorine compounds (i.e., CCl4, CHCl3, HCl, etc.) is a procedure that is claimed to provide
Characterization of Naphtha-Reforming Catalysts |
211 |
redispersion of sintered Pt/g-Al2O3-reforming catalysts.[90] Several studies have been devoted therefore to rationalize the factors controlling the retention and the leaching of chloride either during activation treatments or under reaction conditions.[91 – 95] The effects of chloride adsorption on the physicochemical
properties and reactivity of g-Al2O3 surfaces have also received attention.[94 – 97] Arena et al.[97] followed the loss of chloride upon heating in dry or wet
conditions. They found that the initial rate of chloride loss is proportional to the initial chloride content of the sample and loss could be expressed by a first-order expression involving the actual surface Cl2 concentration. The activation energy
for loss was 6.2 kcal/mole, which is similar to the value of 6.0+0.1 kcal/mole reported by Bishara et al.[98] for chloride loss from a Pt-Cl-Al2O3 catalyst during
air calcination. It was found that steam increased the rate of chloride removal. The activation energy obtained for wet and dry conditions is the same; the increased rate results from a considerably higher pre-exponential factor for the wet conditions. Ayame et al.[99] characterized the form of dehydrated alumina halogenated with chlorine at 773–1273 K. They reported that the higher temperature chlorine treatments resulted in the formation of adjacent strong Lewis acid sites,
which were induced by the chloride ions bonding to aluminum cations. Treatment with HCl at 773 K produced materials with strong Brønsted acidity.[100] It was shown by Garbowski and Primet[101] that aluminas chlorided by CCl4 or HCl at
573 K strongly adsorbed benzene to form coke precursors and hexadienal cation, respectively. Arena et al.[97] compared the change in the zero point charge with chloride addition to the catalytic activity for the isomerization of cyclohexene to methylcyclohexene and found a linear relationship between the two.
Alumina is being extensively studied as a catalyst and/or catalyst support for the conversion of environmentally detrimental halogenated compounds. As such, much attention is devoted to the subject of halogen–alumina interaction. An ultrafine alumina (550 m2/g) was prepared and then reacted with CCl4 as outlined in Figure 6.[102] The probable mechanism was by dissociative adsorption and heterolytic decomposition of the C-Cl bonds. Overchloriding may result in the loss of alumina as AlCl3.
Since the conversion was accomplished in the absence of oxygen, the CO2 must be formed from oxygen from the alumina. The mechanism also allows
´ [103]
for the formation of the minor by-products. Vigue et al. compared the chlorination of two g-aluminas with chloroform (Degussa C alumina and Condea alumina). They found distinct differences with the Condea alumina reacting more slowly. Chlorination was described as occurring on the monocoordinated OH groups linked to tetrahedral or octahedral alumina atoms.
While not directly concerned with naphtha reforming, the results of Gracia et al.[104] are of interest. These authors used Fourier transform infrared (FTIR) and controlled-atmosphere extended X-ray absorption fine-structure analysis techniques to study the effect of chlorine on Pt-supported catalysts during

212 |
Davis and Antos |
Figure 6 Illustration of the main pathway for adsorption and decomposition of carbon tetrachloride by high surface-area alumina (from Ref.[102]).
oxidation reactions. The model they proposed indicates that transport of Cl from the metal surface to the support occurs under reducing conditions and this is reversed when oxygen is present in the gas phase.
2.4Fluorided Alumina
Several authors have claimed that strong Brønsted acid sites are formed by fluorination of alumina.[105 – 110] The extent of acidity, determined from ammonia
adsorption, was shown to increase and then decrease as the concentration of fluoride increased (Fig. 7);[111] IR was used to follow the reaction of sterically hindered nitrogen bases[112,113] with fluorided aluminas. A model of the surface
modifications has been proposed.[60]
Hirschler[114] obtained a measure of the acidity of an Alcoa F-10 alumina as well as a sample of the fluorided alumina (both calcined at 5008C). The acidity titrations showed that the treatment with HF greatly increased the acid strength

Characterization of Naphtha-Reforming Catalysts |
213 |
Figure 7 Effect of fluoride concentration on the adsorption of ammonia (from Ref.[111]).
using HR indicators. Webb,[105] on the basis of the effect of temperature of ammonia chemisorption, concluded that HF treatment of alumina did not increase the number of acid sites but did considerably increase their strength. Weber[115] showed that fluorided alumina impregnated with platinum salts has a
high hydrocracking activity, whereas on a chlorided alumina the hydrocracking activity is low. Holm and Clark[116,117] reported that fluoriding alumina
considerably increased its activity for n-octane cracking, o-xylene isomerization, and propylene polymerization. The heats of ammonia adsorption and the observations with arylmethanol indicators could be reconciled if it was assumed that the acid centers on fluorided alumina are of a different type (e.g., protonic) from those on alumina. The fact that fluorided alumina converted 1,1- diphenylethylene to the carbenium ion and that it showed no increase in acid strength with the Hammett indicators supported this assumption, from which it followed that protonic acids rather than Lewis acids convert arylmethanols to their corresponding cations.
Typical IR spectra of pyridine adsorbed on samples with increasing F show bands for Lewis sites (1455, 1496, 1580, and 1620 cm21).[105,112] Brønsted acid
sites (1545, 1562, and 1640 cm21) are not detected on alumina but are present in the fluorided alumina samples. The number of Brønsted sites were found to
214 |
Davis and Antos |
increase to about 0.6 site/nm2 as the F content increased; however, this site density was attained only after 10–20% F had been added to the alumina. Similar qualitative results were obtained for the Brønsted sites that react with 2,6-
dimethylpyridine; however, the maximal number of sites is obtained at a much lower F content. Corma et al.[105,112] also determined the acid strength
distribution by titration with butylamine and found that the maxima in total acidity (pK 6.8) and in the strong acid sites (pK 1.5) are found for fluorine content between 2% and 4%. Furthermore, only a small fraction of the Brønsted sites created by fluorination exhibit strong acidity.
In the past, to resolve some of the contradictory data, researchers have studied fluorided aluminas using a variety of instrumental techniques.[109,118 – 122]
Some of the inconsistencies can be attributed to variations in preparation methods; however, most of the inconsistencies involve data from X-ray diffraction (XRD). It is very possible that some preparations lead to welldispersed phases that cannot be detected using XRD. In particular, 27Al nuclear magnetic resonance (NMR) data reveal the presence of phases that are not detected by XRD.[123] DeCanio et al.[123] carried out a multitechnique investigation of a series of F/Al2O3 samples in which the fluorine loading was varied from 2.0 to 20.0 wt %. The results from these techniques showed that at low levels fluoride served to block Lewis acid sites but at higher levels its predominant role was to increase the Brønsted acidity of the alumina surface, and that fluoride strengthens the remaining Lewis acid sites.
Two-dimensional magic angle spinning (MAS) NMR is being applied to
elucidate the nature of the sites formed by fluoridation; three different Al-F sites have been identified.[124] At levels above that needed for full fluoridation of the surface, AlF3 was formed. Earlier Davis et al.[125] had reached similar
conclusions based on their studies using ultrasoft X-ray absorption spectroscopy.
In other studies, radiotracers of F exchange with Cl are being used to elucidate the nature of the catalytic site.[126]
3PLATINUM–ALUMINA CATALYSTS
For both platinum and the bimetallic systems there have been long-term conflicting views of the chemical state of the metal under typical reforming
conditions. The early view that platinum was present as the metal was shattered by the report by McHenry et al.[127] that a significant fraction of the platinum in a
reforming catalyst could be extracted with dilute HF or with acetylacetone. Acetylacetone extraction had been developed as a method to recover the metallic platinum from reforming catalysts so that XRD could be utilized to obtain an average crystal size in the absence of the interfering peaks of the alumina support.[128] Results[129 – 131] supporting the view of soluble platinum appeared
Characterization of Naphtha-Reforming Catalysts |
215 |
following this observation. Others questioned the presence of soluble platinum, indicating it was present only when the reduced catalyst had been exposed to air following extraction.[132 – 135] The latter view is probably most widely accepted
today. However, the absence of platinum ions in the reduced reforming catalyst is not universally accepted.[136,137]
The experimental observation that the best metallic function would be one of the expensive group VIII metals dictated that the metallic function of the naphtha-reforming catalyst be optimized. The cost of the noble metal required that the dispersion of the metal, platinum, be maximized. In the following we consider first the definition and a measurement of dispersion of a single function, and then of the function dispersed on a high surface area support.
3.1Dispersion
Dispersion is easy to define but almost impossible to precisely measure. The dispersion may be defined as the number of atoms in the exposed surface Ns divided by the total number of atoms present in the catalyst (Ntotal). While Ntotal can be determined precisely, Ns will depend on the definition of surface as well as the experimental approach used for the measurement and the model used in the calculations. For example, some of the crystal faces of a metal are more densely packed than others; the openness of the outermost layer of metal atoms will determine the extent that the second layer will be exposed to the gaseous phase.
Except for the chemisorption techniques described below, dispersion is obtained from calculations based on the particle size. Thus, to make comparisons of the results from various techniques one needs to consider the relationship between dispersion and the particle size. The most common shape of particle is a sphere, or a hemisphere, especially for platinum. However, as the dispersion approaches unity, two-dimensional plates (‘rafts’) may be encountered. Thus, the dispersion is related to the crystal size. The relationship is not simple. The supported particles seldom, if ever, have a uniform size (monodispersed) but will have a distribution of particle
sizes (polydispersed). The ‘average size’ may depend on the experimental technique used to make the measurement. Lemaitre et al.[138] consider these
problems in some detail, so that only a brief outline is given.
3.2X-ray Diffraction
The XRD and line broadening (XLBA) techniques are based on the fact that the breadths of the X-ray reflections, apart from an instrumental contribution, are related to the dimensions of the crystals giving rise to the reflections. The metal reflection must be intense enough to give a signal measurable above the background of the support. This requirement is easily met in the case of the PtSiO2 catalyst but not with the Pt-Al2O3 catalyst. The two most intense peaks for
216 |
Davis and Antos |
Pt metal fall at angles of 2u values where intense peaks from the crystalline alumina support mask the Pt peaks. Thus, XLBA has limited utility for the
characterization of Pt-Al2O3 reforming catalysts. This was the reason that Adams et al.[139] utilized a Pt-SiO2 catalyst for a comparison of the metal sizes obtained
by microscopy, XLBA, and chemisorption techniques.
The crystallite size is calculated from XLBA.[140] The more common approach is to measure the linewidth at half-maximum (LWHM). Instrumental line broadening is usually taken into account by measuring the LWHM for a sample with very large crystallites and using this to correct the experimental LWHM for the sample. The XLBA technique returns ‘crystallite’ size rather than ‘particle’ size. For small particles, such as Pt in the naphtha-reforming catalyst, the two are the same. However, as the particles become larger, they may be composed of two or more crystals; in this case the crystallite size can be considerably smaller than the particle size.[141] Ascarelli et al.[142] provide calculations to use XLBA to distinguish between two different Pt growth mechanisms: the coalescence and Ostwald ripening processes. They apply the method to Pt-carbon samples and conclude that the coalescence process applies to their data.
3.3Transmission Electron Microscopy
Adams et al.[139] measured the distribution of Pt particle sizes for a particular PtSiO2 catalyst and found the number average diameter for the size distribution to be 2.85 nm; the surface average diameter, 3.05 nm; and the volume average diameter, 3.15 nm. These authors considered the probable error in these average diameters to be about 10%; this was based on the variation of the values obtained
among eight observations.
Rhodes et al.[143] prepared a series of Pt-Al2O3 catalysts by sintering a 46% dispersion sample to produce lower dispersions of 26% and 15%. From the transmission electron microscopy (TEM) size distribution, the dispersions of the
samples were estimated. The results of the calculation are largely independent of the shape of the crystal used.[144] Evaluating the dispersions, they obtained 16%,
22%, and 61%, in reasonable agreement with those measured by chemisorption. They attributed the poor agreement for the sample with the highest dispersion to a breakdown of the model for small particles. Thus, the model would not be applicable for naphtha-reforming catalysts that are of the most interest, i.e., the highly dispersed materials. The measurement of the particle diameter will be subject to more error as the particles become smaller. This will result from the inability to measure particles below some size that depends on the resolution of the electron microscope used for the measurement.
Overlapping contrast from the support, especially one that is crystalline, may impact the ability to observe metal particles. White et al.[145] found this to be
Characterization of Naphtha-Reforming Catalysts |
217 |
the case for a high-resolution electron micrograph of a Pt-Al2O3-reforming catalyst. The contrast from the support tended to obscure the metal particles, making them harder to detect. The effects on resolution and contrast from the
support on the determination of the sizes and shapes of small metal particles have been considered in theoretical papers.[146] Based on image calculations, a 1.2-nm
cubo-octahedron could be undetected when viewed through an amorphous support of 1.9-nm thickness in a microscope having a 0.2-nm point resolution. Particles larger than about 1 nm in diameter can usually be readily detected by brightfield and darkfield microscopy.[147] For smaller particles, high-angle annular darkfield imaging is useful because the electrons scattered at high angles are more sensitive to atomic number; hence, the sensitivity for Pt with respect to the support increases at high angles. This technique, coupled with digital image
processing, produced images of particles containing as few as three Pt atoms on alumina support[147] and three atom clusters of Os on g-alumina.[148 – 150] Datye and Smith[147] contend that the difficulty in detecting the presence of highly
dispersed metallic species may be caused as much by the mobility of the species
as by the problem of obtaining sufficient contrast. Thus, it is not surprising that Huang et al.[151] found that Pt-Sn-g-Al2O3 catalysts contained a significant
number of TEM-invisible platinum particles less than 1 nm in diameter in addition to larger TEM-visible particles.
3.4Chemisorption Techniques
The chemisorption of hydrogen by metals had been related to the number of exposed metal atoms of platinum and other metals.[152,153] However, it was the
work of Emmett and Brunauer that showed the utility of the technique for the characterization of more complex catalytic materials that are composed of two or more components.[154 – 156] Chemisorption measurements are easily applied to Ptalumina reforming catalysts. Several gases, including CO, H2, O2, and NO, have been used for this purpose. Hydrogen adsorption isotherms on silica-supported platinum catalysts are typical; adsorption corresponding to chemisorption is completed at pressures of 0.1 mm Hg or less, and adsorption at saturation is greater at lower temperatures. The amount of adsorption at saturation will depend on the evacuation temperature following reduction and cooling in hydrogen. Adams et al.[139] found that chemisorption volume increased with increasing temperature of evacuation up to 2508C, remained constant up to 8008C, and then decreased at 9008C, presumably due to sintering of the platinum and/or support.
Although there was much background information available, Adams et al.[139] appear to be among the first to have made a detailed comparison of the
dispersion calculated from the results of several techniques using hydrogen adsorption at 2788C or 08C. To calculate the dispersion, it is first necessary to define an approach to obtain the volume of hydrogen or other chemisorbed gas

218 |
Davis and Antos |
Figure 8 Typical measurement of chemisorption: (a) intrapolation of Langmuir-type isotherm to zero pressure; (b) total adsorption at 90 K and physical adsorption at 90 K after evacuation at 195 K. The difference between the two gives the chemisorbed amount.
that corresponds to complete coverage of the metal. One can utilize two approaches to obtain the volume of gas corresponding to a monolayer of coverage. First, one can extrapolate the adsorption isotherm to zero pressure (Fig. 8) and take this as the appropriate volume of gas. The second approach is to make a first measurement of the isotherm so as to obtain 4–10 data points up to pressures of about 40 cm Hg, then to evacuate the sample at the adsorption temperature at a vacuum of 1023 mm Hg or better, and then to measure a second adsorption isotherm. At any pressure the difference between the first and second isotherms should correspond to the amount of gas that is chemisorbed. For most Pt-Al2O3 catalysts, the two methods of obtaining the amount of hydrogen chemisorbed provide similar volumes.
To calculate the available platinum surface, one must know the area occupied by a chemisorbed hydrogen. The surface area for a platinum black sample calculated from the chemisorption data should be equal to that of the BET surface area calculated from the volume of nitrogen adsorbed. The area occupied by a hydrogen atom on platinum black is 1.12 nm2. The particle size can then be calculated from the chemisorption data assuming the same density as bulk
platinum.
Via et al.[157] have measured hydrogen adsorption at room temperature on a Pt-Al2O3 catalyst and on the support (Fig. 9). The difference between the curves A (adsorption on Pt-Al2O3) and B (adsorption on the alumina support) remains constant over the hydrogen pressures used for the measurement (5–15 cm Hg). However, extrapolation of the hydrogen adsorption on the support alone to zero

Characterization of Naphtha-Reforming Catalysts |
219 |
Figure 9 Typical chemisorption isotherms at room temperature. The isotherms are for hydrogen chemisorption on the platinum on alumina catalyst. Isotherm A is the original isotherm, while isotherm B is a second isotherm determined after evacuation of the
adsorption cell for 10 min subsequent to the completion of isotherm A. The difference isotherm A-B is obtained by subtracting isotherm B from isotherm A (from Ref.[157]).
pressure does not give the expected value of zero adsorption. For this particular catalyst, the difference between the two curves (A 2 B) returns a value of H/Pt ¼ 0.9. In contrast, if the adsorption isotherm for the Pt-Al2O3 catalyst is extrapolated to zero hydrogen pressure (curve A), a H/Pt ¼ 1.2 value is obtained. The ‘correct’ procedure for obtaining a measure of H/M has been widely debated at ASTM Committee D32 meetings and the ASTM Committee E42 on surface analysis. The E42 committee has approved surface analysis techniques that are now published in volume 3.06 of the Annual Book of ASTM Standards; several subcommittees are active in this area.[158]
It is still not certain which H/Pt stoichiometry is correct. For most widely
used platinum metal catalysts an H/M stoichiometry of unity has been used and this assumption has been tested using XRD and TEM data.[159 – 161] Surface
science measurements also show that a maximum of one hydrogen atom per metal atom could be chemisorbed on the (111) faces of FCC metal single crystals.[162] It
is generally assumed that metal particles larger than 1–2 nm consist for the most part of (111) faces, and the use of H/Pt ¼ 1 seems reasonable. However, reports of stoichiometries greater than one date back over 30 years. For Pt/Al2O3
220 |
Davis and Antos |
catalysts values of H/Pt ¼ 1.2–2.5 have been obtained.[163 – 169] Even higher
values of near 3.0 have been obtained for supported Ir catalysts. McVicker et al.[170] found an upper limit of two adsorbed hydrogen atoms per Ir atom for
Ir/Al2O3 if they based the calculation only on strongly adsorbed hydrogen; when the total adsorbed hydrogen was used for the calculation they obtained H/Ir values exceeding 2. Similarly, Krishnamurthy et al.[171] found that a 0.48% Ir/Al2O3 catalyst adsorbed up to 2.72 hydrogen atoms per iridium atom, and about H/Ir ¼ 0.28 was weakly adsorbed. A series of catalyst studies of Pt, Rh, and
Ir metals supported on Al2O3, SiO2, and TiO2 have been made, and these show H/M values exceeding unity for both Rh and Pt catalysts;[172 – 174] values exceeding 2.0 were obtained for supported Ir catalysts.[175,176]
A number of explanations have been given for obtaining values of H/M greater than 1. In most catalysts, reversibly adsorbed hydrogen makes up a part of the
total adsorbed hydrogen; many contend that only the irreversibly adsorbed hydrogen should be used for determination of the metal surface area.[170,171,177 – 180] Others have explained that the high H/M ratio is due to hydrogen spillover.[169,181 – 183]
Some contend that the atoms located at the corners and/or edges of small metal
particles may be responsible for adsorbing more than one hydrogen atom per surface metal.[170,171,184] Another possible source of the high H/M ratio is that part of the
hydrogen can be bonded to atoms under the outermost surface layer.[185 – 187] Kip et al.[176] offered the explanation of adsorption beneath the metal surface or multiple adsorption on parts of the metal surface. In some instances, such as Pt/TiO2, the high value of H/M may be due to a partial reduction of the support itself.
3.5Titration Methods
A hydrogen–oxygen titration method was introduced by Benson and Boudart in 1965.[188] This technique was expected to reduce or eliminate errors introduced by hydrogen spillover and to provide an increase in the sensitivity over that of the adsorption of hydrogen. The titration should be the result of simple stoichiometries as shown by the following reactions:
Pt þ 1=2H2 ¼ Pt-H (H chemisorption, HC) Pt þ 1=2O2 ¼ Pt-O (O chemisorption, OC)
Pt-O þ 3=2H2 ¼ Pt-H þ H2O (H titration, HT) 2Pt-H þ 3=2O2 ¼ Pt-O þ H2O (O titration, OT)
Menon[189] summarized the conflicting stoichiometries for HC:OC:HT as found in the literature. Prasad et al.[190] reported that much of this controversy was
perhaps due to the fact that every research group used the very first hydrogen chemisorption on a fresh catalyst as the basis for all calculations, and if the
Characterization of Naphtha-Reforming Catalysts |
221 |
surface was given an ‘annealing’ treatment by a few H2-O2 cycles at ambient temperature, it can behave normally in subsequent titrations. Furthermore, if the H2 titer value was used as the basis for calculations after the H2-O2 cycles, the stoichiometry was always found to be 1:1:3, independent of Pt-crystallite size and independent of the pretreatment of the catalyst. Whether the freshly reduced catalyst or one that has been subjected to repeated H2-O2 cycles is representative
of the working reforming catalyst is not defined at this time. Isaacs and Petersen[191] also found that the dispersion from hydrogen chemisorption was
greater than obtained for either oxygen chemisorption or by the titration technique. The authors point out that the ratio (dispersion from hydrogen
titration/dispersion from hydrogen chemisorption) of 0.82 is in very good agreement with the value of 0.81 obtained by Kobayishi et al.[192] and by Freel.[193]
O’Rear et al.[194] recently addressed the stoichiometry of the titration technique using a clean surface platinum powder. They point out that several other authors have studied the chemisorption of oxygen on various types of
platinum surfaces using ultrahigh vacuum techniques; these are reviewed by Gland.[195] O’Rear et al. imply that the observed low values are due to inefficient
clean-off of the gas used for the reduction or that the oxygen pressure was not sufficiently high to cause reconstruction of some Pt single-crystal faces to a ‘complex’ phase where high values of oxygen chemisorption are obtained. The authors[194] also compiled literature data to make comparisons of the platinum area average particle size calculated from hydrogen chemisorption and the number average particle size measured by TEM or the volume average crystallite size measured by XLBA. There was good agreement between the particle
size measured by hydrogen chemisorption and the independent techniques
(Fig. 10).[141,163,196 – 198]
Measurements for a commercial reforming catalyst (CK-306; the same formulation but not the same sample) obtained in three labs are summarized in
Table 1, and they show similar values even when different experimental procedures are utilized.[191,199,200]
3.6Small-Angle X-ray Scattering
X-rays experience scattering at the interface of materials with sufficient differences in density. An alumina support provides a two-phase system—the alumina particles and the porosity represented by the void space. When the alumina contains platinum there are now three interfaces. Small-angle X-ray scattering (SAXS) can be used to obtain interphase surface areas of a system such as alumina-supported platinum catalysts. Recent developments in the experimental techniques and the theory for interpreting the data promise to make this a useful technique for catalyst characterization. Summaries of the general scattering

222 |
Davis and Antos |
Figure 10 Supported platinum particle size as measured by hydrogen chemisorption (dc) assuming a stoichiometric coefficient y ¼ 1 and measured by transmission electron
microscopy, X-ray line broadening, and X-ray small-angle scattering (dp). Symbols denote the sources of the data (from Ref.[194]).
Table 1 Comparison of Pt Dispersion Values from Different
Methods
|
Gas adsorbed |
|
Methoda |
(ml STP/g) |
Dispersion (%) |
|
|
|
A |
0.282 |
82 |
B |
— |
73 |
C |
0.278 |
81 |
D |
0.271 |
79 |
aA, Volumetric chemisorption; B, hydrogen titration of Pt-O surface volumetrically; C, hydrogen titration of Pt-O surface gas chromatographi-
cally; D, oxygen titration of Pt-H surface gas chromatographically.
Source: Ref.[200].
Characterization of Naphtha-Reforming Catalysts |
223 |
principles for such systems[201 – 206] and the experimental techniques[207] have been published.
One approach to obtain information about the platinum particles is to reduce the three-phase system to a two-phase system by filling the pore structure with a liquid of the same electron density as the alumina support. Compounds such as CH2I2 are suitable for this purpose. It is difficult, however, to completely
fill the pores because of wetting problems and the inaccessibility of some pores. Whyte et al.[208] utilized the masking technique to investigate the Pt-Al2O3
system. Most results were in reasonable agreement with their chemisorption data. Cocco et al.[209] made a detailed study of supported Pd and Pt materials. They
excluded scattering from inaccessible voids by subtracting the scattering of the masked, metal-free support and used experimental techniques to make intensity
measurements on an absolute basis. Calculated size distribution functions were found to be bimodal. Somorjai et al.[210] used extremely high pressure
to reduce the pores present in the alumina to such a small size that they would not contribute significantly to the scattering. It is necessary to assume that the compaction at these very high pressures does not modify the platinum particles.
Brumberger and coworkers have made several experimental studies of catalysts using the SAXS technique.[202,211 – 215] These workers used the
‘support-subtraction’ method, assuming that addition of metal does not change the support morphology to an appreciable extent. This technique requires that both support and metal–support receive the same preparative and pretreatment procedures and that both respond exactly the same to these treatments. They
generally obtained good agreement between BET and SAXS surface areas.[213] Brumberger et al.[215] utilized SAXS to follow the sintering of Pt-Al2O3
catalysts with high Pt loadings (up to about 11 wt %) in air. The data indicate that there is an initial redispersion at 400–5008C and that the surface then decreases as the temperature is raised further, in agreement with chemisorption data. The SAXS data show that the sintering response of the catalyst to temperature changes is rapid. The authors emphasize that the SAXS method is capable of following changes in surface areas accurately, nondestructively, and continuously in situ, for a wide variety of temperature, pressure, and ambient atmosphere conditions.
Small-angle neutron scattering (SANS) can also be utilized. Hall and Williams[206] have recently made a comparison of the surface area and porosity
of a range of silicas, aluminas, and carbons obtained from SANS and BET surface areas. They reported that the SANS areas of the nonporous and mesoporous aluminas and silicas were of the correct order of magnitude compared with the BET areas. In summary, SAXS and SANS measurements still have a long way to go before they become a reliable approach for naphtha-reforming catalyst characterization. However, rapid advances are now being made in both the
224 |
Davis and Antos |
experimental and theoretical approaches so that the methods must be considered
to show promise.
Lemaitre et al.[138] contrasted the results obtained using the above methods and showed schematically how the dispersion is approached through the various experimental methods. They concluded that usually the dispersion values are most easily compared by expressing them all in terms of an average particle size.
3.7X-ray Absorption Fine-Structure Analysis
X-ray absorption fine-structure analysis (XAFS) is an experimental technique which is atom specific and can give structural information about supported metal catalysts. XAFS gives information on the atomic level, but very limited and indirect information on the morphology of the catalyst particles (e.g., size, shape, crystalline imperfections, etc.). XAFS is, however, unique in providing a method to determine coordination numbers, interatomic distances and from this the
‘average’ nearest-neighbor atoms, and the vibrational motions of the metal atoms. While the phenomenon was first observed more than 60 years ago,[216] it is only
recently that XAFS has become a useful analytical tool. One reason for this is that
the use of synchrotron radiation increased the available flux by 105 –106, allowing faster, more accurate XAFS experiments (for experimental details, see[217,218]).
Extended XAFS
Extended XAFS (EXAFS) spectra generally refer to the region 40–1000 eV above the absorption edge. Excellent reviews on EXAFS in general[219,220] and
its application in catalysis[221 – 228] are available. The pre-edge region contains valuable bonding information such as the energetics of virtual orbitals, the electronic configuration, and the site symmetry. The edge position also contains information about the charge on the absorber. In between the pre-edge and the EXAFS regions is the X-ray absorption near-edge structure (XANES).
Transmission is just one of several modes of EXAFS measurements. The fluorescence technique involves the measurement of the fluorescence radiation (over some solid angle) at right angle to the incident beam. Other more specialized methods include (1) surface EXAFS (SEXAFS) studies, which involve measurements of either the Auger electrons or the inelastically scattered electrons (partial or total electron yield) produced during the relaxation of an atom following photoionization; and (2) electron energy loss (inelastic electron scattering) spectroscopy (EELS). These latter methods, which require high vacuum, are useful for light-atom EXAFS with edge energies up to a few kilo electron volts. The accuracy of the structural parameters depends on many factors. Typical accuracies for the determination of parameters obtained in an
Characterization of Naphtha-Reforming Catalysts |
|
|
225 |
|||||
Table 2 Comparison of Chemisorption and XAFS Data |
|
|
|
|||||
|
|
|
|
|
|
|
|
|
Catalyst |
a |
H/M |
b |
CO/M |
b |
N |
c |
˚ d |
|
|
|
|
R (A) |
||||
|
|
|
|
|
|
|
||
Os-SiO2 |
1.2 |
|
1.0 |
|
8.3 |
2.702 (2.705) |
||
Ir-SiO2 |
|
1.5 |
|
0.8 |
|
9.9 |
2.712 (2.714) |
|
Ir-Al2O3 |
1.3 |
|
0.9 |
|
9.9 |
2.704 (2.714) |
||
Pt-SiO2 |
|
0.7 |
|
|
|
8.0 |
2.774 (2.775) |
|
Pt-Al2O3 |
0.9 |
|
0.9 |
|
7.2 |
2.758 (2.775) |
||
|
|
|
|
|
|
|
|
|
aCatalysts contained 1 wt % metal.
bThe number of H or CO chemisorbed per metal atom. cAverage coordination number (nearest metal atom neighbors).
dInteratomic distance (nearest metal atom neighbor); data in parentheses are for bulk metal.
Source: Ref.[157].
unknown system have been quoted as 1% for interatomic distances, 15% for the coordination numbers, and 20% for the thermal mean-square displacements.[229]
In the pioneering work in the application of EXAFS, Sinfelt, Lytle, and their coworkers[157] compared EXAFS and hydrogen chemisorption data for Os,
Ir, and Pt catalysts. The hydrogen chemisorption data indicated a high dispersion with H/M near 1 (Table 2). The data for the interatomic distances are the same as for the bulk metal, within experimental error, except possibly for Pt-Al2O3. This suggests that Pt interacts more strongly with alumina as the coordination number (7.2) for Pt-Al2O3 was the lowest of the three catalysts.
The metal dispersion, as represented by the coordination number, is one of the more important EXAFS parameters for catalyst characterization. While the
experimental value of 7.2 is lower than for the bulk metal (12), it still appears high when compared to the H/M value of 0.9. Zhao and Montano[230] point out
the small coordination numbers obtained by Sinfelt and coworkers are consistent
with very small clusters (dimers, trimers, etc.) but that the interatomic distances correspond to those of the bulk metal. Based on detailed analysis, Zhao[231]
contended that the metal particles in the 1% Pt catalyst contain more than 50
atoms and that the real first-shell coordination number could be as large as 10. Lytle et al.[232,233] reported additional data for in situ studies of a 1% Pt on
Cab-O-Sil in the presence of He, H2, or benzene. In this instance the hydrogen-
˚
reduced sample has Pt present as a mixture of 10to 15-A disks and polyhedra.
The authors included the phase shift in the transformation of the Pt EXAFS data that was shown by Marques et al.[234] to be very useful in sharpening and
simplifying the peaks of the Fourier transform of elements such as Pt which have very nonlinear phase shifts. These latter results showed a clear demonstration of Pt-O bonds to the support at low temperatures. At temperatures above 600 K the Pt-O bonds break and the raft-like clusters curl up to be more sphere-like.
226 |
Davis and Antos |
Concurrently with the bond breaking, electrons flow to the Pt d-band to provide a
d-electron surplus in the Pt clusters relative to bulk Pt.
Although in situ high-temperature[235] and high-pressure[236] cells for EXAFS were known, Guyot-Sionnest et al.[208] claim the first in situ cell used to
examine the activation of a Pt-alumina-reforming catalyst. Dexpert[237] reported that on heating a catalyst prepared using chloroplatinic acid from room temperature to 2008C in air, there was a destabilization of the Pt-Cl bond with formation of a Pt-O bond. With heating at 2008C in hydrogen the complex rapidly decomposed with a decrease in the Cl/Pt nearest-neighbor and an increase in Pt-Pt nearest-neighbor bonding. The value of the coordination number of Pt-Pt
bonds was consistent with a raft structure for Pt.
Guyot-Sionnest et al.[238] found that a sample yielded a well-formed oxide specie after oxidation, with three coordination shells of the oxide visible (Fig. 11). Following reduction at 4608C Pt-Pt bonds having an average interactive distance
˚
of 2.67–2.68 A became evident. This is a much shorter bond than in bulk Pt
˚
(2.75 A); it was believed that the low Pt-Pt coordination numbers (4–5) could cause each Pt atom to share more electrons with neighbors, thereby making a shorter bond. Since the coordination of Pt was lower in the chlorided catalyst, it was concluded that Cl aids in maintaining Pt particle dispersion. Following reduction at 4608C, the pressure was increased to 5 atm and n-heptane passed over the catalyst for 4 h. A peak at the appropriate Pt-C bond distance was
Figure 11 Evolution of the Fourier transform modules for chlorinated 1.0 wt % Pt/ Al2O3 before reduction under flowing H2 (T ¼ 258C) and after reduction (T ¼ 2608C),
p(H2 total) ¼ 1 atm. Disappearance of Pt-O coordination and formation of Pt-Pt coordination is shown as temperature is raised (from Ref.[238]).

Characterization of Naphtha-Reforming Catalysts |
227 |
observed. The authors conclude that, since the number of Pt-C bonds detected by EXAFS remained unchanged while dehydrocyclization activity decreased, deactivation of the catalyst was not due to changes in the number of Pt-C bonds.
X-ray Absorption Near-Edge Structure
At an absorption edge, the X-ray absorption coefficient increases abruptly with increasing energy. In an absorption spectrum for a given element, absorption edges are observed at certain energies characteristic of the element. The abrupt rise in absorption occurs when the energy of the X-ray photons are equal to that required to excite electrons from an inner level of the absorbing atom to the first empty electronic states. Edges are identified by the letters K, L, M, etc., to indicate the particular electronic shell from which the electrons are excited by the X-ray photons. By comparing with measurements on well-characterized systems, one can use LII,III edge studies to determine d-band occupancy in transition metal compounds and alloys.[239]
Lytle[240] reported results for the LIII absorption edges for supported catalysts. Meitzner et al.[226,241] more recently presented similar data for metals
more frequently associated with naphtha-reforming catalysts. The LIII absorption edges of platinum, present in a Pt/Al2O3 catalyst with a dispersion approaching unity and with a metal dispersion of 0.2 corresponding to large crystallites, are shown in Figure 12. A careful inspection of the curves shows that the resonance may be slightly more intense for the small metal clusters but the differences
Figure 12 Comparison of LIII absorption edge for the platinum clusters in a Pt/Al2O3
catalyst (metal dispersion ¼ 1.0) with that for large platinum crystallites (dispersion ¼ 0.2) (from Ref.[241]).
228 |
Davis and Antos |
are near to that of the experimental uncertainty. Similar results were obtained for supported Ir and Os catalysts. The earlier reports[242,243] showing larger effects
attributed to metal dispersion were apparently confounded by sample thickness
˚
effects. Thus, it appears that the metal atom in a 10-A crystal (a size where the ratio of surface to total atoms approaches unity) of Pt, Os, or Ir, supported on either alumina or silica, exhibits electronic properties that are not very different from an atom present in a metal crystal representative of the bulk metal. Similar
˚
electronic effects apparently are experienced in metal crystals that are 10 A and larger; likewise, the extent of electronic interaction of the metal clusters with
alumina or silica support is minimal. This conclusion appears to conflict with the EXAFS data described above.[238]
The chemisorption of a monolayer of oxygen on highly dispersed clusters of Pt, Ir, or Os results in a substantial increase of the intensity of the LIII edge. Data for an Ir/Al2O3 catalyst containing 1 wt % Ir, with clusters of Ir on the order
˚
of 10 A, indicate that the number of unoccupied d states of the metal increases as a result of interaction with the chemisorbed oxygen. While the metal becomes more electron deficient, chemisorption of oxygen at room temperature does not lead to a bulk oxide.
Whereas most of the above studies focused on one feature of XAS, today this is not the case. For reforming catalysts, as well as for catalysis in general, the use of XAS characterization expands at a rapid rate. The increased availability of instrumentation and the availability of improved theoretical approaches have contributed to this development. Even so, it is easy to be misled and investigators new to the area should benefit from the overview of common artifacts and problems with data interpretation that are offered by Meitzner.[244] Some
recent papers offer insight to new opportunities for the technique.[245 – 251] Lagarde[252] provides a short overview of the principles and some examples of
the use of surface EXAFS. A major review of XANES analysis of catalytic
systems under reaction conditions has recently appeared.[253] The application of the technique ranges from studies of catalyst preparation[254,255] to study of
chemisorbed species.[256]
3.8Nuclear Magnetic Resonance
Two types of NMR measurements are possible: a study of the nuclei of the catalyst itself and a study of nuclei of molecules adsorbed on the surface of the catalyst. The 195Pt nuclei have sufficient natural isotopic abundance, a reasonably strong gyromagnetic ratio, and a spin of I ¼ 1/2, which eliminates the complexity due to electric quadrupole effects. Furthermore, 195Pt has one of the largest Knight shifts of any metal (23.37%) and therefore offers the possibility of resolving the NMR peak of surface layers of atoms from that of the bulk.

Characterization of Naphtha-Reforming Catalysts |
229 |
Figure 13 NMR absorption line shapes for six samples at 77 K and vo ¼ 74 MHz (from Ref.[143]).
Yu et al.[257] obtained 195Pt NMR spectra for small unsupported Pt particles that corresponded to the bulk metal. Rhodes et al.[143] obtained spectra for a Pt
supported on alumina. The dispersion of these catalysts were measured by chemisorption and by TEM. The line shapes for six samples scaled to the same area are shown in Figure 13. They are broad and extend the full range of Knight
Table 3 Dispersion (in %) of Pt Catalyst Samples Measured by
Three Methods
Sample |
Chemisorption |
Microscopy |
NMR |
|
|
|
|
Pt-4-R |
4 |
— |
5 |
Pt-11-R |
11 |
— |
8 |
Pt-15-R |
15 |
16 |
10 |
Pt-26-R |
26 |
22 |
19 |
Pt-46-R |
46 |
61 |
40 |
Pt-58-R |
58 |
— |
79 |
Source: Ref.[143].
230 Davis and Antos
shifts from that of nonmetallic compounds to that of bulk Pt metal. In going from samples of larger particles to those of progressively smaller particles, the intensity of the line shifts from the metallic end of the lineshape to the nonmetallic end. The bulk peak at 1.13 kG/MHz is very prominent in the lineshapes of samples with the larger particles (Pt-4-R, Pt-11-R, and Pt-15-R). The peak at 1.089 kG/MHz was taken to correspond to resonance of atoms present in the surface. The authors calculated a dispersion based on the relative area of the total lineshape and the one due to surface atoms. These dispersions are presented together with those obtained from TEM and hydrogen chemisorption measurements in Table 3. The agreement among the data shown in Table 3 was taken as confirmation of the hypothesis that the low-field NMR peak measures surface atoms.
´ [258]
de Menorval and Fraissard showed that the NMR chemical shift of
hydrogen adsorbed on Pt-Al2O3 varied with surface coverage and Pt particle size. The spectrum of hydrogen adsorbed on Pt-Al2O3 consisted of only one line whatever the coverage. The chemical shift d was constant when the diameter was
˚
greater than 70 A and then decreased when the hydrogen coverage increased beyond 0.5. Rouabah et al.[259] showed that for the Pt-SiO2 EUROPT-1 catalyst,
the chemical shift depended on coverage, size of the metal particles, and temperature. From the variation of the chemical shift with the number of adsorbed hydrogen atoms, it was possible to determine the metal dispersion. It is claimed that the NMR technique does not require the stoichiometry of the chemisorption on the metal to be known. The average particle size determined by 1H NMR was
smaller than the dispersion based on chemisorption or electron microscopy. 129Xe NMR has been used to estimate the average number of Pt atoms per
cluster for samples of Pt contained in a NaY zeolite (Pt/NaY).[260] Thus, an average of four to eight Pt atoms per cluster was estimated when the progressive chemisorption of H2 at room temperature in a bed of Pt/NaY powder was followed by Xe NMR. These results agreed with an average value of six Pt atoms per cluster which had been inferred earlier from the rapid exchange with D2 of OH groups in a Pt/CaY zeolite as followed by IR spectroscopy.[261]
The determination of the number of Pt atoms per cluster attracted attention
as it was the first time that the number of atoms in a supported metallic cluster smaller than about 1 nm had been reported.[262] However, the study of similar or identical samples of Pt/Y zeolites by TEM,[263] SAXS,[198] wide-angle X-ray scattering (WAXS),[264] and EXAFS[265] indicates Pt clusters of about 1 nm in
size in the supercages of the Y-zeolite (1.3 nm in diameter), with about 16–40 Pt atoms per cluster.[143] In particular, a combined investigation of Pt/Y samples by TEM, SAXS, WAXS, and EXAFS suggested that the Pt clusters were substantially larger than those probed by IR and Xe NMR. Detailed analysis of
the experiments has reconciled both types of observations to the higher
value.[259,260,266 – 270]
Characterization of Naphtha-Reforming Catalysts |
231 |
Boudart et al.[271] utilized Pt supported on SiO2, g-Al2O3, or Y-zeolite for their NMR studies. The percent metal exposed for each sample was measured by titration of prechemisorbed O by H2,[163] by irreversible H chemisorption, and by irreversible O chemisorption at room temperature in a standard volumetric system. The average size for the Pt clusters was obtained from the percent metal
exposed, assuming a spherical shape and an average Pt surface number density of 1.10 1019 m22.[271]
The Xe NMR spectra were then taken at various values of nominal
surface coverage, H/Pts. All spectra show two peaks: one with d ¼ 0.5 ppm, assigned to Xe in the gas phase,[269] and another single peak with d ¼
85–285 ppm, corresponding to the average interaction of adsorbed Xe with the Pt surface and the support.[267] Boudart et al.[271] reported a puzzling
observation in the discrepancy between the value of the chemical shift d
measured on prereduced Pt samples without any chemisorbed hydrogen. With all details of the reduction and evacuation procedures being the same,[267,271]
straight lines for d vs. H coverage extrapolate to the value measured for zero H coverage for all samples except Pt/gAl2O3. For this sample, the measured value of d on the sample without H is considerably lower than that extrapolated from the d vs. H coverage line. For as little as 10% coverage by H, the measured value of d is exactly on the d vs. H coverage line.
Boudart et al.[271] rationalized the anomaly by the following speculation. In vacuo, the shape of Pt clusters on SiO2 or in Y-zeolite is approximately spherical, and the interface between metal and support is minimal. But with a g-Al2O3 support, clusters of platinum about 1 or 2 nm in size probably have the shape of a
pillbox or raft in vacuo as a result of the high interfacial energy. Indeed, highresolution TEM reveals epitaxial growth of 2 nm clusters of Pd on g Al2O3[270]
and with comparable lattice parameters, both metals should behave similarly on g-Al2O3. In the raft-like shape, xenon interacts with the free Pt surface but senses the surface of the cluster in contact with the Al2O3 platelets. At this contact, there are weak bonds between Pt and oxygen ions of the Al2O3. Hence, the chemical
shift of Xe is smaller than that corresponding to bare Pt, just as d of Xe decreases as oxygen is added to bare Pt clusters.[267] When hydrogen is introduced to the
sample, the weak bonding between the metal and the support disappears as a result of chemisorption of hydrogen.
NMR studies of CO adsorbed on L-zeolite and silica-supported small Pt
particles show evidence of changes in the metallic nature of these particles with size.[272] Large Pt crystals on silica or on the exterior of the zeolite have
conduction-band electrons that cause a Knight shift for adsorbed CO. On the other hand, small particles in zeolite cavities are diamagnetic and yield spectra that are similar to those of transition-metal cluster compounds. Thus, the NMR technique was advanced as a means of defining the metal dispersion due to particles in the zeolite cavities and on the exterior of the framework.
232 |
Davis and Antos |
Han et al.[273] obtained dramatically different results for the platinum particles even though the static NMR and dispersion by chemisorption were similar. Unlike Sharma et al., Han et al. did not find the Pt particles to be diamagnetic; they emphasized the need to use multiple techniques to characterize catalysts.
13C and 2H NMR resonance data were obtained for carbon species (ethene or propene) adsorbed on Pt-alumina catalysts.[274,275] While not directly
applicable to high-temperature naphtha reforming, the results indicate that progress toward that goal is underway.
3.9Temperature-Programmed Desorption or Reduction
Temperature-programmed reduction (TPR) is one of the chemical methods for catalyst characterization; however, it does not provide a direct measure of chemical structure or chemical state. It provides a quantitative measure of the extent of reduction but does not provide direct information about what is being reduced. An analogous technique is temperature-programmed desorption (TPD). TPR suffers from a lack of information regarding the species undergoing reduction and whether the weight loss is due to reduction or desorption. It is possible to eliminate some of the uncertainty about the nature of the weight loss
by monitoring the exit gas stream with a mass spectrometer. The TPR provides a ‘fingerprint’ of the reducibility of the platinum group metal catalysts.[276] For example, the reduction of Pt-, Ir-, and Pt-Ir-Al2O3 catalysts has been studied.[277]
The reduction of platinum in the Pt-Al2O3 catalyst occurs over a broad temperature range that peaks at about 4008C while iridium oxide is reduced over a narrow but higher temperature range that is centered at about 5508C. In contrast to the two single metals, the reduction of Pt-Ir-Al2O3 is not a composite of the two curves representing the reduction of each metal on the support; rather, the reduction is effected at a lower temperature. This data are consistent with the formation of a Pt-Ir alloy on the support; however, the data do not provide direct evidence for the formation of an alloy.
Temperature-programmed techniques are being applied frequently to characterize coke on used catalysts. Querini and Fung[278] have utilized the
technique to show (1) the morphology of the coke and (2) the gasification of coke on the alumina support. Jess et al.[279] showed that the coke burnoff is dominated
by the coke deposited on the acid sites on the support.
3.10X-ray or Ultraviolet Photoelectron Spectroscopy; Electron Spectroscopy for Chemical Analysis (ESCA)
Photoelectron spectroscopy is based on the photoelectron effect where ionization occurs and an electron is expelled from the sample with a kinetic energy that

Characterization of Naphtha-Reforming Catalysts |
233 |
Figure 14 Contribution of successive layers of thickness 8 to the total XPS intensity for 2 ¼ 908 (from Ref.[280]).
depends on the energy of the incident photon, the element that is ionized, and the valence of that element in the sample. Depending on the energy of the incident photon, emission of the photoelectrons will be from the valence band only (ultraviolet photoelectron spectroscopy, UPS) or from both the valence and core levels (X-ray photon spectroscopy, XPS). XPS provides a measure of the concentration and chemical valence of only those elements in the surface of the sample. However, a knowledge of the mean free paths of electrons in solids is not completely defined even today. A schematic of the escape probabilities for an electron through surface layers to the vacuum of the instrument is illustrated in Figure 14.
For the characterization of naphtha-reforming catalysts, it is usually necessary to pretreat the sample prior to analysis by UPS or XPS. This is commonly accomplished in a sample cell, attached to the chamber used for the measurement. Following the pretreatment the sample is transferred without exposure to the atmosphere to the high-vacuum chamber where the actual measurements are made. In nearly all of the instruments it is necessary to form the sample into a pellet so that a reasonably smooth surface is provided to the photon beam and to maintain sample integrity during the pretreatment operations.
Semiconductor or insulator samples will undergo charging since, in general, ions are formed more rapidly than the charge can be dissipated through conduction to the instrument. Thus, the measured binding energy must be corrected to account for the charging effect if the data are to have value for
234 |
Davis and Antos |
defining the valence of an atom. The common way to correct for the charging effect is to reference it to the C 1s line from the contamination overlayer. The C 1s
line is normally taken to be 284.6 eV, and all elements are corrected by the same amount that is required to correct that of the C 1s line to 284.6.[280] While there is
some question of the validity of the implied assumption that the adventitious carbon layer is in good contact with the sample, several authors[281 – 283] showed that it is sufficiently reliable (+0.1 to 0.2 eV) in most cases. Another option is to use one of the elements of the sample, usually the support, as the reference. For example, Ogilvie and Wolberg[284] showed that the standard deviation for the Al 2p binding energy in a series of alumina catalysts was reduced from 0.49 to 0.14 eV when O 1s from the support is chosen as the reference rather than C 1s. Round-robin studies have emphasized the difficulties in arriving at accurate binding energy values for catalysts.[285]
3.11Auger Electron Spectroscopy
Auger electrons are ejected when an atom containing core level vacancy, created as, for example, in the XPS measurements where an X-ray photon interacted so as to eject an electron, de-excites by emitting an electron from an upper orbital. The energy needed for ejecting this electron comes from the nearly simultaneous decay of a third electron from another upper level into the inner core vacancy.
Because XPS and Auger electron spectroscopy (AES) are similar, spectrometers are frequently built that allow one to obtain either type of spectrum. AES and XPS have approximately the same intensity toward the surface. AES is usually more sensitive with the ability to detect surface species at lower concentrations than XPS. Consequently, AES is utilized more frequently in depth profiling than is XPS. To effect depth profiling, successive layers of the material are sputtered from the sample using a beam of ions and recording the surface concentration of the elements of interest between the periods of sputtering. One application of depth profiling would be to determine whether there was an enrichment of an element on the surface, e.g., tin in a Pt-Sn-Al2O3 catalyst.
Recent advances suggest that AES may find wider applications in catalyst characterization. Angle-resolved AES (ARAES) provides a method whereby the primary beam incidence angle and the collection angle can be varied independently from 0 to 808 off sample normal.[286] A surprisingly large increase in surface sensitivity is obtained by using grazing incidence and collection angles. Techniques have been developed for collecting high-energy- resolution AES (HRAES) spectra rapidly, making it useful for obtaining chemical state information from AES. It is possible to combine ARAES and
HRAES to obtain depth-sensitive, chemical-state information as illustrated in the study by Asbury and Hoflund.[287]
Characterization of Naphtha-Reforming Catalysts |
235 |
3.12Ion Scattering Spectroscopy
Ion scattering spectroscopy (ISS) is extremely sensitive to the outermost layers of a surface and this makes it a particularly effective tool for studying the adsorption of a species onto a surface. Sensitivity factors have been used for quantitations of the surface of binary alloys, but little has been done on real catalyst surfaces. A linear relationship exists between the ISS signal and the coverage at the beginning of the adsorption. The scattered ion yield is directly related to the number of surface atoms. Attenuation of the ion yield may result from a number of factors, including matrix effects, preferential sputtering, surface roughness, and a changing background. A determination of neutralization probabilities is difficult and for this reason most catalyst ISS data are given in terms of ratios instead of absolute intensities. A number of factors prevent a calculation of
neutralization probabilities from first principles.
Dwyer et al.[288,289] used ISS and TPD to show that the amount of chemisorption of hydrogen and CO was directly dependent on the number of exposed platinum atoms (Fig. 15). The authors interpreted the data to show that the deposited TiO2 suppressed CO or H2 chemisorption by blocking the adsorption sites of the platinum. The chemisorptive capacity of the system decreased upon reduction but was recovered upon reoxidation.
It is also possible to study the dispersion of a supported oxide or metal using this technique. Ewertowski et al.[290,291] impregnated g-alumina with
chloroplatinic acid to various extents and then calcined and reduced the materials. They observed that with increasing coverage by Pt metal a decrease in intensity of the narrow component of the momentum distribution curve was obtained. It was verified that the change was due to Pt and not the Cl added during catalyst preparation.
3.13Infrared Spectroscopy for Metallic Function
The adsorption of hydrogen onto platinum supported on g-alumina produces bands at 2105 and 2055 cm21.[292] The high-frequency band is due to more
weakly absorbed H. These IR bands gave the shift expected for the isotope effect. The structure associated with the more weakly bonded hydrogen was believed to be due to two hydrogen atoms adsorbed per platinum and the more strongly
bound hydrogen to a single adsorbed hydrogen atom per metal atom. Adsorption of CO on the metallic function likewise produces two bands.[293] This has been
interpreted as CO bonded to one Pt and to multiple Pt atoms through direct and bridging bonding, respectively. Bridging-type bonding becomes more pronounced at higher surface coverage. In some instances, especially at higher coverage, there may be multiple CO bonding to a single metal atom. This finding
236 |
Davis and Antos |
Figure 15 Fractional coverage of (a) H2 and (b) CO that can be chemisorbed at 120 K vs. the fraction of exposed Pt as measured by ISS (from Ref.[288]).

Characterization of Naphtha-Reforming Catalysts |
237 |
made investigators aware of the uncertainty associated with chemisorption measurements that utilize CO/Pt ¼ 1 to calculate dispersion.
3.14Calorimetry
Lantz and Gonzalez[294] constructed a calorimeter and measured the heats of adsorption of hydrogen on platinum as a function of Pt crystal size. They found that the initial heat of adsorption decreased only slightly with increasing dispersion. A maximum in the heat of adsorption was obtained for all samples at a surface coverage, u, of 0.4. The heat of adsorption should not increase with
coverage and several possibilities to account for this, including diffusion into the powder, were discussed. Sen and Vannice[295] later reported results that were
similar.
4CHARACTERIZATION OF PLATINUM–RHENIUM CATALYST
TPR data have been used more extensively for the Pt-Re system than for many of the other reforming catalyst formulations. Johnson and LeRoy[296] obtained
evidence that the reduction stopped with rhenium in the oxidized state of Re4þ. Webb[297] obtained data using this technique that showed both platinum and rhenium were reduced to the metallic state. Johnson[298] pointed out that there
was not necessarily any contradiction between these data since Webb used very dry conditions whereas Johnson and LeRoy employed a water partial pressure
Table 4 Isothermal and Dynamic TPR of Pt-Re-Alumina Catalystsa
Isothermala
Extent of reduction (%)b
Dynamic TPAc
Extent of reduction (%)
Temp. |
|
|
|
Temp. |
|
|
(8C) |
15 min |
30 min |
60 min |
range (8C) |
Pt |
Re |
|
|
|
|
|
|
|
200 |
11 |
20 |
34 |
25–300 |
100 |
0 |
300 |
57 |
65 |
72 |
25–500 |
100 |
76 |
500 |
70 |
75 |
81 |
25–700 |
100 |
100 |
550 |
84 |
89 |
95 |
|
|
|
aCatalyst containing 0.375 wt % Pt/0.2 wt % Re/alumina calcined at 5258C.
bAssuming that Pt and Re are in the þ4 and þ7 valency states, respectively, in the oxidized material.
cHeating rate of 18C/min.
Source: Ref.[299].
238 |
Davis and Antos |
typical of reforming conditions. Water presumably would serve to maintain rhenium in an oxidized state.
Subsequent TPR studies indicate that rhenium is reduced to the metal even under rather mild conditions. McNicol[299] carried out the reduction in TPD experiments as well as in fixed-bed reactors (Table 4). McNicol did not observe an influence of Pt on the reduction as had been reported in an earlier study by Bolivar et al.[300] and concluded that the difference between the observations was because the studies started with calcined and uncalcined samples, respectively.
Yao and Shelef[301] utilized chemisorption, TPR, and electron paramagnetic resonance spectroscopy (EPR) techniques to investigate the reduction of Re/alumina catalysts. They reported that Re interacts strongly with g-alumina and can be reduced to the metal in hydrogen only at temperatures greater than 5008C. Even when reduced to the metal, Re did not chemisorb hydrogen at room temperature. Reoxidation, even at 5008C, produces Re4þ, and the limiting coverage of alumina surface by this species is about 10%. This limitation in oxidation explains why Re is not volatilized as Re2O7 during catalyst regeneration. At high loadings, the three-dimensional phase can be reduced by hydrogen to Re0 at 3508C. The interaction of oxygen with the reduced dispersed phase at 258C produces species identified by EPR as surface nondissociated oxygen molecule-ions (O22 ) and Re2þ ions.
Further studies[302 – 304] confirmed the reducibility of rhenium to Re0 when present as Re/alumina or Pt-Re/alumina. Moreover, these studies showed that the ease and extent of reduction is dependent on the sample history. Studies indicated that the reduction temperature decreases with increasing loading of Re
and with increasing oxidation temperature;[304] that for a freshly oxidized sample about 90% reduction of Re7þ to Re0 took place up to 6008C;[302] that after
reoxidation the associated TPR spectra exhibited a shift to higher temperatures with increasing oxidation temperature; and that rhenium could easily reoxidize to
the Re7þ state. The Re(II) state was considered to reflect oxygen chemisorption. Wagstaff and Prins[302] found that adsorption of oxygen at temperatures up to
1008C leaves the bimetallic clusters largely intact, but subsequent hightemperature treatment in the absence of extra oxygen leads to segregation of Pt and Re species. These authors therefore take the view that ‘bimetallic clusters’ are formed and that these, in the presence of oxygen, are thermodynamically unstable, but that under mild conditions the rate of segregation is slow.
The results shown in Figure 16 are typical of those obtained by most investigators for Pt-Re/alumina catalysts since they show that at least a portion of the Re is reduced at a lower temperature in the bimetallic catalyst than in a Re/ alumina catalyst. Increasing oxidation temperature of the freshly prepared Pt-Re/ alumina catalyst causes an increase in the fraction of Re that is not reduced at the lower temperature (Fig. 17); however, for these bimetallic catalysts never does the TPR of the Pt-Re/alumina catalyst become equal to one that is the sum of a

Characterization of Naphtha-Reforming Catalysts |
239 |
Figure 16 TPR of Pt-Re vs. superimposed Pt þ Re. (a) 0.35 wt % Pt-0.35 wt % Re/ Al2O3. (b) 0.4 wt % Al2O3 and 0.35 wt % Re/Al2O3. Preoxidized at 5008C (from Ref.[305]).
Figure 17 TPR of Pt/Re/Al2O3 (from Ref.[76]).
240 |
Davis and Antos |
mixture of the monometallics. Isaacs and Petersen[303] conclude that for drying temperatures of 5008C or less, a substantial fraction of the Re2O7 is at least partially hydrated and able to migrate to Pt reduction centers. Isaacs and Petersen conclude that hydrogen spillover is too slow (by at least two orders of magnitude) to allow for the reduction rate observed up to 4008C. For this reason the authors conclude that some rhenium oxide specie migrates to the platinum site where it is reduced; the presence of water, as proposed by Bolivar et al.[300] and by Wagstaff
and Prins,[302] influences the mobility of Re2O7. However, Isaacs and Petersen[303] contend that the TPR curves indicate (Fig. 17) that the degree of
hydration is set by the drying temperature: the higher the drying temperature, the lower the degree of hydration and thus the lower the mobility of the Re species. As the drying temperature is raised, the TPR temperature necessary for the Re species to migrate to the Pt reduction center, which results in a TPR peak due to Re reduction, increases.
There are many points of agreement between the data and conclusions of Mieville[304] and Isaacs and Petersen;[303] however, there are some major
differences. Mieville found that the superimposed Pt þ Re TPD curve was essentially the same as that of a Pt-Re-alumina catalyst that had been preoxidized at the same temperature (5008C). Mieville prefers the view that the catalyzed Re reduction may be due to a spillover mechanism and that only a small fraction of the total Re reduction needs to be by hydrogen that spills over. This is because only a small fraction is needed to generate sufficient Re metal, which could then catalyze the further reduction of the rhenium oxide. In other words, the small amount of hydrogen that spills over could initiate what would be in effect an autocatalytic reduction of the rhenium oxide. Mieville points out that a catalyst containing 0.35 wt % Re and 0.01 wt % Pt will have a maximal reduction temperature of Re of 4108C in comparison to a temperature of 3708C for a catalyst containing 0.35 wt % Pt. For a value of 28.5 kcal/mole, the activation energy for the rate of diffusion of hydrogen spillover on an alumina surface,[181]
the rates should differ by about the factor of 4 that is observed for catalysts with the above Pt loadings. Ambs and Mitchell[305] observed a similar rate factor of 3
for catalysts containing 0.5 and 0.02 wt % Pt. One of the most important implications of the results obtained by Mieville[304] is that the temperature of maximal TPR rate increases as the Re loading decreases; the maximum for an Re/alumina catalyst containing 0.35 wt % Re is about 1508 higher than one
containing 1.1 wt % Re.
Menon et al.[306] took advantage of the fact that oxygen adsorbed on Re cannot be titrated by hydrogen at room temperature to effect a separate determination of the Pt and Re dispersion in Pt-Re-alumina catalysts. Using a pulse technique, they carried out the following room temperature measurements: (1) oxygen pulsing to measure chemisorption by Pt þ Re; (2) reduction in hydrogen to convert Pt-O to Pt-H; (3) renewed oxygen pulsing to yield
Characterization of Naphtha-Reforming Catalysts |
241 |
chemisorption by Pt only; (4) the difference between (1) and (3) for the chemisorption by Re only. These authors found that the dispersion of Pt is little altered in a composite Pt-Re catalyst compared to that in a Pt catalyst of the same metal content; however, the dispersion of Re seemed to be considerably enhanced in the composite catalyst. Eskinazi[307] compared hydrogen and oxygen chemisorption and hydrogen titration data for a series of catalysts with different Pt/(Pt þ Re) ratios. The maximal metal surface areas were obtained with 55 mol% rhenium, alumina supports with surface areas greater than 150 m2/g, and a catalyst pretreatment involving oxidation at
5008C prior to reduction.
Kirlin et al.[308] used XPS to follow the reduction of two Pt-Re-alumina catalysts as well as an Re-alumina catalyst. They reported that reduction of the bimetallic catalysts with hydrogen at 5008C and 1 atm gave predominantly Re4þ. However, the addition of small amounts of water to the hydrogen feed effected
the reduction to Re0 and the complete removal of chloride from the catalyst. In this case water assists in reduction whereas Johnson[298] agreed that water
maintained a higher oxidation state. Reduction of the catalyst in butane þ hydrogen at 5008C resulted in the reduction to Re0 with retention of the chloride. Under identical conditions, the Re in an Re-alumina catalyst was reduced only to Re4þ, indicating that Pt is necessary to effect the reduction to Re0. The XPS data are therefore consistent with the metals being present in the zero valent state in
the bimetallic-reforming catalyst under reaction conditions. Adkins and Davis[309] confirmed the results of Kirlin in their XPS study.
EPR data indicated that the majority of Re was present as Re0 in a Pt-Re- alumina catalyst.[310] The surface of the reduced bimetallic Pt-Re-alumina catalyst contains both Re0 and Re4þ, although the Re4þ could account for only about 10% or less of total Re at the loadings investigated (0.2–0.3 wt %). The results showed that the Re4þ surface sites do not chemisorb CO, whereas Re0, either separately dispersed or in contact with Pt, strongly chemisorbs CO. The authors also concluded that Re0 was the valence state of Re that is decisive for the
catalytic function of the Pt-Re-alumina-reforming catalyst.
Onuferko et al.[311] utilized XPS, EXAFS, and XANES in their study of Pt- Re-alumina catalysts. Following in situ reduction, all of their results show that Pt0 and Re4þ are the dominant species. The Pt in the reduced catalyst was different
from the bulk metal or the monometallic catalyst. The data also suggested that Re was not significantly associated with Pt.[311,312] Kelley[313] utilized ISS and
energy dispersive X-ray analysis (EDX) in TEM for analysis of the Pt-Re- alumina catalyst and found that Re was not significantly associated with Pt but was widely dispersed on the support surface. Sulfiding essentially covered the Re but left most of the Pt exposed.
Meitzner et al.[314] obtained a different structure for reduced 1:1 atomic ratio Pd-Re- and Pt-Re-alumina catalysts using EXAFS. In agreement with most
242 Davis and Antos
of the TPR data, essentially all of the rhenium had an oxidation state of zero after reduction in hydrogen at 775 K. The EXAFS data also provided evidence for significant coordination of rhenium to platinum in bimetallic clusters. These bimetallic clusters were not characterized by a single interatomic distance. This finding could be an indication of intercluster or intracluster variation of composition. This latter possibility is commonly associated with one of the components concentrating at the boundary or surface of a cluster as a consequence of differences in the surface energies of the components. If this were so, the average number of the nearest-neighbor metal atoms about one component will be larger than the number about the other. This was not observed, suggesting intercluster variation. For both catalysts, the interatomic distance for the unlike pair of atoms was significantly shorter than that for either pair of like atoms in the clusters or the pure metal. This indicates that the Pt-Re bonds in the cluster are
stronger than would be anticipated.
Meitzner et al.[314] also examined a reduced Pt-Re-alumina catalyst after exposure to H2S. The rhenium EXAFS results indicated that the sulfur had little disruptive influence on the clusters. There was no evidence for the formation of ReS2. The Pt-Re and Re-Re bond distances do not change significantly when sulfur is adsorbed, and the extent of coordination of rhenium to platinum was essentially unchanged. It was, therefore, concluded that the catalyst contained
Pt-Re bimetallic clusters with sulfur strongly chemisorbed on the rhenium. Sinfelt and Meitzner[226] report XANES studies of a Pt-Re-alumina (1% Pt,
1% Re). The data for the LIII edges of rhenium show that the Re in the catalyst does not differ significantly from that in bulk rhenium and is much less intense than the edge for rhenium in the þ7 oxidation state in ReO4 . Similar measurements were made for the reduced catalyst following sulfiding. These data show that the edge of rhenium after exposure to hydrogen sulfide does not differ significantly from that before exposure to sulfur but is much less intense than for ReS2. These edge absorption data are consistent with the EXAFS data in showing that the Pt-Re clusters are not disrupted by sulfur. The sulfur appeared to be in the
form of sulfur atoms chemisorbed on exposed rhenium atoms in the Pt-Re cluster. Bazin et al.[315] obtained somewhat different results in their study of Pt-Re-
alumina (240 m2/g alumina). Both the white line and the EXAFS data for platinum indicated that it was present in the zero valent state. However, whereas an average environment of one Pt atom in a monometallic catalyst was composed
˚ ˚
of 6 metal atoms at 2.75 A and 0.7 oxygen atom at 2.04 A, in the bimetallic Pt-Re catalyst the analysis leads to 3 (reduction at 3008C) and 5 (reduction at 5008C) metal atoms around one Pt with hardly a detectable amount of oxygen. This shows that Pt is present in a more highly dispersed state in the bimetallic catalyst than in the monometallic one. The white line of the rhenium LIII edge does not resemble the metallic state and the EXAFS indicates that one rhenium atom is surrounded by 6 to 8 metal atoms and 2 oxygens, and hence in an oxidized state. In their

Characterization of Naphtha-Reforming Catalysts |
243 |
model, a rhenium oxide interface is between the platinum and the alumina, which they contend is in line with other experimental and theoretical results.[314]
Hilbrig et al.[316] utilized coupled XANES and TPR techniques to study the reduction of Pt-Re-alumina catalysts. They measured the chemical shift of the XANES for the two metals in the catalyst relative to metallic Pt and Re. The authors then compare the derivative of the change in the chemical shift with that for hydrogen uptake (both as a function of temperature of reduction) on the reference monometallic catalysts, and find that the two methods of following the reduction are quite similar in the case of each metal. Pt is completely reduced
Figure 18 TPR of 0.3 wt % Pt-0.3 wt % Re/Al2O3 pretreated at 2508C. (a) The chemical shift (relative to metallic Re) as a function of temperature of reduction. (b) The
derivative of the chemical shift (_) and H2 consumption (– –) as a function of temperature of reduction (from Ref.[316]).
244 |
Davis and Antos |
when the temperature has reached 3808C as indicated by a chemical shift of 0.0 eV. A sharp peak at 4608C for Re corresponds to reduction to Re4þ; further reduction occurs so that the average Re oxidation state is þ1.5 at 6508C. There is a considerable difference in the reduction profile for the Pt-Re-alumina catalyst compared to the monometallic catalysts. For bimetallic catalyst with higher Re loading, the Re7þ to Re4þ reduction occurs around 2758C, and for lower Re loading at 3108C. Pt in both catalysts shows a reduction profile that is similar to the Pt monometallic catalyst. In both samples, however, the chemical shift is not zero even at 4508C; this is interpreted to be due to Pt-Re interaction rather than incomplete reduction of Pt (Fig. 18). Pretreatment at higher temperatures decreases the reducibility of the Re. Even for catalysts that have been calcined at either 4008C or 5808C, there is a significant fraction of Re that is reduced at the lower temperature as well as at the higher temperature. This indicates that some of the Re is reduced to form bimetallic clusters whereas some of the Re, reduced
at the higher temperatures, is most likely present as the Re metal.
Vuurman et al.[317] utilized in situ Raman and IR spectroscopy and TPR data in developing a model of the state of Re on alumina as well as silica, zirconia, and titania. Their model should be applicable to the bimetallic catalyst for catalyst preparation and oxidation. Summarizing earlier data[318 – 320] and their data, the authors conclude that of the five different hydroxyl groups present on alumina, rhenium oxide reacts with specific hydroxyl groups as a function of coverage. At low loadings the so-called basic hydroxyl groups are titrated, whereas at higher loadings the more ‘neutral and acidic’ groups are consumed. At the low loadings normally encountered in reforming catalysts only the first type of bonding would be expected. After dehydration two surface rhenium oxide species are present. The concentration ratio of the two species is a function of the coverage, and their structures are similar, possessing three terminal Re55O bonds and one bridging Re O-support bond. The bridging Re O-support bond strength decreases with increasing coverage. Hardcastle et al.[321] concluded, based on XANES and laser Raman spectroscopy (LRS) data, that the following reversible changes in the rhenium species on alumina take place as dehydration proceeds: perrhenate ion in solution ! solvated surface species ! unsolvated surface species ! gaseous dimeric Re2O7.
Jothimurugesan et al.[322] utilized proton-induced X-ray emission (PIXE) and Rutherford backscattering spectrometry (RBS) together with scanning electron microscopy (SEM) and chemisorption data to characterize Pt-, Re-, and Pt-Re-alumina catalysts. PIXE utilizes a beam of energetic protons to excite the inner shell electrons, and the resulting X-rays are used for the identification and quantification of the elements of interest. PIXE can give in-depth concentration profiles of a metal. RBS is based on the elastic backscattering of ions from the catalyst sample. This technique has the possibility of high sensitivity, and surface concentrations on the order of a monolayer of heavy atoms present on a lighter

Characterization of Naphtha-Reforming Catalysts |
245 |
atom support can easily be detected. RBS data present surprising results. For the monometallic Pt catalyst, the depth profile indicated that Pt was uniformly distributed from the surface to the interior of the pellet for samples representing the oxidized, reduced, or used catalyst. For the monometallic Re catalyst, the concentration increased slightly from the surface to the interior for the oxidized, reduced, and used catalyst. For the bimetallic catalyst, the Pt-Re depth profile for the oxidized catalyst resembles that of the Re monometallic Re catalyst; however, there is about a five-fold increase in the metal concentration near the
surface of the support pellet for the reduced and used catalyst samples.
Kelly et al.[313,323] used ISS to study Pt-Re-Al2O3. They found that Re was highly dispersed on the surface. Upon sulfiding of the catalyst, they found that rhenium was covered and platinum was exposed. The increase of the Pt þ Re peak was strongly associated with a decrease in either the sulfur or chlorine peak.
The bimetallic nature of the catalyst continues to be debated. A study using scanning transmission electron microscopy (STEM) and energy-dispersive X-ray spectrometry (EDX) produced data to show Pt-Re bimetallic particle formation in the reduced catalyst.[324] The highest degree of interaction was obtained if the catalyst was not dehydrated prior to reduction. Later studies by this group utilized
EXAFS to extend the results, showing the importance of the pretreatment temperature and atmosphere, and support the STEM/EDX data.[325]
The role of sulfidation continues to be an area of interest. EXAFS data[326] provided support for the general model proposed by Biloen et al.[327] and amplified by Sachtler[328] where the mixed metal cluster contains ‘chains’ of
Pt-Pt and Re-Re, which are connected by Pt-Re bonds (Fig. 19). Bensaddik et al. found that after sulfidation both Re and Pt atoms are coordinated to about two sulfur atoms. Following a second reduction, the Re environment is essentially unchanged but the Pt atoms are coordinated by about one sulfur. Chlorine was shown to have no effect on the stability of the metal particle during sulfidation and reduction.
5CHARACTERIZATION OF PLATINUM–TIN–ALUMINA CATALYSTS
TPR studies of Pt-Sn-Al2O3 catalysts suggest that Sn is not reduced to the zero
[329,330] ¨ [331]
valent state. Lieske and Volter reported, based on TPR studies, that a
Figure 19 Biloen’s model (from Ref.[327]).
246 Davis and Antos
minor part of the tin is reduced to the metal, which combined with Pt to form ‘alloy clusters,’ and the major portion of the tin is reduced to the Sn(II) state. The
amount of alloyed tin increased with increasing tin content. This disagrees with TPR data reported by Burch and Garla[332,333] who conclude that the tin is
reduced only to Sn(II) and not to elemental tin. They believe that the altered Pt properties are due to an interaction with Sn(II) species, which is considered by Burch and Mitchell[334] to be the primary influence on the reforming properties.
¨ [335]
This agrees with the work of Muller et al. who used hydrogen and oxygen
adsorption measurements to show that neither metallic tin nor a Pt/Sn alloy was present in their catalysts.
In the following, data are reported from methods that make a more direct measure of the chemical or physical state of the elements present in Pt-Sn- alumina catalysts. XPS studies permit one to determine the chemical state of an element but the data do not permit one to define, for example, whether Sn(0), if present, is in the form of a Pt-Sn alloy. Furthermore, the major Pt XPS peak is masked by a large peak of the alumina support. Thus, XPS can only provide data to show that an alloy is possible; it cannot be used to prove the presence of a Pt-Sn alloy.
The early XPS studies revealed that tin is present only in an oxidized state.[330,336,337] Although some observations were due to the use of oxygencontaining pump oils to maintain the high vacuum. Li et al.[338,339] later reported
that a portion of the tin in Pt-Sn-alumina catalysts was present in the zero valent state; furthermore, the apparent composition of the Pt-Sn alloy contains increasing PtSn ratios as the Pt/Sn ratio present on the catalyst is increased.
However, it must be kept in mind that XPS provides a measure of the surface, and not the bulk, composition; Bouwman and Biloen[340] showed that tin is
concentrated in the surface of reduced unsupported Pt/Sn alloys, in general agreement with others.[341 – 347]
119 ¨ [348 – 363]
Sn Mossbauer data have been utilized in a number of studies.
Direct evidence for PtSn alloy formation was obtained from Mo¨ssbauer studies;[348,358 – 361] however, many of these studies were at high metal loadings
and even then such a complex spectrum was obtained that there was some uncertainty in assigning Sn(0) to the exclusion of tin oxide phases. Mo¨ssbauer results clearly show changes upon reduction in hydrogen, but the width of the
peaks for the reduced sample prevents a specific assignment for some states of tin. This was exemplified by the results of Kuznetsov et al.[363]
There are many complicated relations between the electronic state of the tin ion and the associated Mo¨ssbauer spectrum. The usual rules do not always apply. However, this is normally not a problem since each tin-bearing phase usually has a distinct characteristic set of parameters. Multiphase sample spectra can be resolved using standard curve fitting and statistical techniques so that the contributions of each phase may be separated. The relative amount

Characterization of Naphtha-Reforming Catalysts |
247 |
Figure 20 119Sn Mo¨ssbauer spectra for reduced Pt-Sn catalysts: (a) Pt-Sn/Al2O3
(250 m2/g), (b) Pt-Sn/Al2O3 (110 m2/g), and (c) Pt-Sn/SiO2 (700 m2/g). (Pt:Sn mole ratios are indicated by the numbers shown in the figure) (from Ref.[362]).
of tin in each phase can be determined from the peak area associated with that
phase.
Li et al.[362] utilized a series of 1% Pt/variable-% Sn catalysts for Mo¨ssbauer studies. Tin was observed to be present in forms whose isomer shifts were similar or the same as SnO2, SnO, SnCl4, SnCl2, Sn(0), and PtSn alloy when alumina was the support. Representative Mo¨ssbauer spectra are shown in Figure 20. If it is assumed that the Pt/Sn alloy corresponds only to a 1:1 alloy, one finds that for lower SnPt ratios (5 or less), little difference is observed in the extent of alloy formation and the distribution of the oxidized species for a low and high surface area alumina support. The fraction of Pt present in an alloy phase increases with increasing tin composition and only approaches complete alloy formation at SnPt . about 5.
For Pt supported on a particular coprecipitated tin oxide–alumina catalyst,
a smaller extent of alloy formation was found than a material prepared by impregnation with the chloride complex.[360,362] In another study, a catalyst was
prepared by impregnating a nonporous alumina with a surface area of 110 m2/g with an acetone solution of Pt3(SnCl3)202 .[364] A 5 wt % Pt catalyst was reduced
in situ in the chamber of an XRD instrument;[365] the diffraction pattern matches very well the pattern reported for PtSn alloy. In the pattern it can be seen that with the 5 wt % Pt catalyst, a small fraction of the Pt is present as crystalline Pt. Similar results for the PtSn alloy are obtained for a catalyst that contains only
248 |
Davis and Antos |
0.6 wt % Pt, with the same Sn/Pt ratio. These in situ XRD studies support alloy formation with a stoichiometry of PtSn ¼ 1:1. The Sn in excess of that needed to form this alloy is present in an X-ray ‘amorphous’ form and is postulated to be present in a shell layer with a structure similar to that of tin aluminate.
XRD studies of other variations indicated that, irrespective of the Sn/Pt ratio, the only crystalline phase detected by XRD was SnPt (1:1). The XRD intensity of lines for the SnPt alloy phase increase with increasing SnPt ratios,
indicating the presence of unalloyed Pt in the samples containing low tin loadings. The integrated intensity measured for the most intense PtSn peak[123]
clearly shows that the amount of Pt present as crystalline alloy increases with increasing Sn/Pt ratios. Likewise, the crystallite size calculated from the XRD data show that the radius of the crystallite increases from about 10 to 16 nm with increasing tin content.
XANES and EXAFS were obtained for a series of dried, oxidized, and
reduced (773 K, 1 bar hydrogen) preparations of Pt/Sn-loaded silica and alumina supports.[366,367] The Pt was maintained at 1 wt % and the Sn content was varied
from 0.39% to 3.4%. In general, it was found that increasing the Sn loading on either support decreased the d-band vacancy for Sn. In contrast, alloying Pt with
Sn leads to an increase in the d-band vacancies, in general agreement with Meitzner et al.[368] The Sn K-edge spectra indicate that the arrangement of atoms
about the tin species was essentially the same for the high-area alumina and higharea silica supports. Sn-O atom pairs dominate even after reduction, but their contribution decreases somewhat with increasing Sn loading. The two supports led to profoundly different configurations of atoms about the platinum.
An electron microdiffraction technique was employed to identify crystal structures developed in two Pt-Sn-alumina catalysts. One catalyst was prepared by coprecipitating Sn and Al oxides and then impregnating the calcined material with H2PtCl6 to give a PtSn ¼ 1:3 atomic ratio. The second catalyst was prepared by coimpregnating Degussa alumina with an acetone solution of chloroplatinic acid and stannic chloride to provide PtSn ¼ 1:3. PtSn alloy was not detected by X-ray diffraction for the coprecipitated catalyst although evidence for PtSn alloy was found for the coimpregnated catalyst.[369] Electron microdiffraction studies clearly showed evidence for PtSn ¼ 1:1 alloy phase in both catalysts. Evidence for minor amounts of the PtSn ¼ 1:2 phase was also found for the coprecipitated catalyst.
The state of Pt and Sn remains an area of great interest and one that is unresolved. The connection of the state of the metals to catalyst performance is of even greater interest. The importance of characterization data can be inferred from the title of a recent patent application: ‘Bimetallic supported platinum–tin naphtha reforming catalysts with strong Mo¨ssbauer interaction of tin with platinum’.[370] Pt-Sn was included in a group of multimetallic-reforming catalysts that were characterized by TEM and EDX to define the influence of alloy
Characterization of Naphtha-Reforming Catalysts |
249 |
formation on catalyst activity.[371] Sn and Ge were claimed to modify the properties of the catalyst mainly by a geometrical effect. More importantly, it was claimed that the formation of bulk Pt-Sn and Pt-Ge alloys contributed to the overall rate of deactivation of these catalysts. The activity was based on n-octane conversion at low pressures and presumably with an acid-supported catalyst. It has been shown that for Pt-Sn-alumina catalysts the activity and product selectivity has a pressure dependence; furthermore, the bifunctional conversion pathway was shown to be more rapid that the metal monofunctional pathway.[372 – 374]
6CHARACTERIZATION OF OTHER BIMETALLIC CATALYSTS
Following the successful introduction of the Pt-Re-Al2O3 bimetallic catalyst, a rash of metal combinations appeared in the open and patent literature. These catalyst combinations can be conveniently grouped into three general classifications of alumina-supported catalysts: (1) a group VIII metal, almost always Pt, together with a nonreducible metal; (2) a group VIII metal, usually Pt, together with a metal at least partially reducible to the metal; and (3) a combination of group VIII metals or a combination of a group VIII and group IB metal. In view of the large number of catalysts reported (e.g., more than 500 papers concerning Pt and Ir catalysts appeared during the past 10 years), space permits only a brief outline of the results for these catalysts.
6.1Group VIII or Group VIII/Group IB Bimetallics
Of these catalyst types, the Pt-Ir combination appears to have been the most
widely studied for naphtha reforming and is reported to have been used in commercial operations.[375] Much of the early characterization work on Pt-Ir- Al2O3 catalysts has been reviewed by Sinfelt.[375] Chan et al.[376] followed the
steps in the preparation of Pt-Ir-alumina catalysts using LRS: impregnation with the appropriate chloroplatinic acid and chloroiridic acid solutions, and heating in air at varying temperatures. The spectra indicated significant differences in the nature of the surface species remaining when Pt/Al2O3 and Ir/Al2O3 preparations were subjected to such thermal treatments. After drying at 1108C, the Pt/Al2O3 preparation exhibits Raman bands assigned for the PtCl6 2 ion, whereas Ir/Al2O3 yields a spectrum significantly different from that reported for the IrCl262 ion. With increasing temperature, both the platinum and the iridium species decompose with loss of chloride ligands. After being heated in air at 5008C, the Ir/Al2O3 sample exhibits a Raman spectrum characteristic of crystalline IrO2. The presence of platinum in the bimetallic Pt-Ir/Al2O3 sample inhibits the formation of crystalline IrO2 to some degree.

250 |
Davis and Antos |
Figure 21 Temperature-programmed reduction profile for Pt-Ir/Al2O3, Pt/Al2O3, and Ir/Al2O3 precursors (from Ref.[377]).
Subramanian and Schwarz[377] utilized TPR and thermogravimetry to show that PtCl4, IrCl3, and PtCl4-IrCl3 exist as supported entities when the catalyst, prepared from H2PtCl6 and H2IrCl6, are dried in air at 1508C. These authors reported that bimetal formation does not occur when the dried precursors are directly reduced. The TPR results indicate that there is no interaction between platinum and iridium (prior to reduction) when the precursors are dried at 423 K in air. Although they could not rule out bimetallic formation during the reduction process, the spectrum for the bimetallic precursor (Fig. 21) resembled the profile
generated by adding those observed for the corresponding monometallic precursors (dotted line). However, Huang et al.[378] have reported that for
samples dried at 383 K, the TPR spectrum of the bimetallic catalyst is not the superposition of the spectra of the individual components. Subramanian and Schwarz explained this apparent discrepancy on the basis of the methods used to prepare the catalysts. A wet impregnation procedure (50 cm3 of impregnation solution/20 g of alumina) was used by Huang et al., rather than the incipient
wetness technique using an amount of impregnant corresponding to the pore filling volume of the support (0.5 cm3/g). Recent studies[379] have shown that, at
constant metal weight loading, a change in the amount of solution used to prepare the precursors results in a significant change in their reducibility when supported on porous alumina.
Characterization of Naphtha-Reforming Catalysts |
251 |
Huang et al.[378] found evidence for platinum and iridium in the hydrogen-
reduced catalyst to be in their metallic state forming highly dispersed bimetallic Pt-Ir clusters. Huang and Fung[380] reported that the formation of IrO2 during
oxidation, and subsequent reduction to Ir metal, was inhibited by the presence of chloride. Furthermore, the presence of water vapor during the reduction removed chloride with increased formation of IrO2. The degree of IrO2 agglomeration of the 693 K oxidized Ir/Al2O3 catalyst was much larger than that of Pt-Ir/Al2O3 catalysts, and indicated that the Pt-Ir interaction reduced the degree of IrO2 agglomeration. Chloride promotes the interaction between Pt and Ir to form mixed oxychlorides and oxides in an oxidizing environment. The effect of Cl on
IrO2 agglomeration is, therefore, more significant for the Pt-Ir/Al2O3 catalyst than the Ir/Al2O3 catalyst. McVicker and Ziemiak[381] employed XRD and H2
and CO chemisorption in their studies of the agglomeration behavior of a commercial Pt-Ir catalyst (0.3% Pt–0.3% Ir and 0.67% Cl) and showed that 4-h air oxidation at 773 K resulted in 58% IrO2 agglomeration. The Cl/M ratio in this case is 1.1. A substantial increase in the Cl/M ratio is required to suppress IrO2 agglomeration when the oxidation temperature is greater than 733 K. Thus, a subtle difference in water concentration during air oxidation could result in a large change in catalytic properties.
193 ¨
Ir Mossbauer studies have been conducted for Pt-Ir catalysts. von
Brandis et al.[382] reported that silica-supported materials prepared by impregnation with H3IrCl6 and H2PtCl6 contained Ir in a trivalent state, presumably (IrCl6)32, following drying. Oxidation at 4008C converted the Ir to IrO2. Following reduction at 2008C of the oxidized material, there was a strong tendency toward segregation of Ir and Pt. Similar results were obtained for coimpregnation using a solution containing Ir(NH3)5Cl3 and Pt(NH3)4Cl2.
Sinfelt et al.[383] utilized EXAFS to investigate their alumina or silica supported Pt, Pt-Ir, and Ir catalysts. These studies extended their earlier investigations of the 5–20 wt % Pt þ Ir catalysts with XRD, which indicated the presence of 2.5- to 5.0-nm bimetallic clusters. The EXAFS data for the lower loading of these metals showed that these catalysts with highly dispersed metals consisted of bimetallic clusters even as the ratio of surface to total atoms approached unity. The data obtained to date are typical of much of the work reported on catalysts that are utilized commercially. Exxon workers appear to be able to prepare catalysts that consist of bimetallic clusters even at high dispersion. These workers point out the sensitivity of the Pt-Ir catalyst formulations to the drying, oxidizing, and activating procedures. Most of the other workers obtain data that suggest little interaction of the supported Pt and Ir following reduction. It therefore appears that small differences leading to and/or during reduction determine whether bimetallic clusters are obtained. Presumably most of the investigators have not been conducting their experiments under conditions that reproduce the Exxon catalyst preparation and activation conditions.
252 |
Davis and Antos |
6.2Platinum and Partially Reduced Metal
The Pt-Sn catalyst system has been the most widely studied member of this class of catalysts. However, considerable data exist for two other combinations of Pt– group IVA metals: Pt-Ge and Pt-Pb. These systems will be covered briefly in this
section.
Romero et al.[384,385] studied the hydrogenolysis of n-butane and the hydrogenation of benzene over fluorided platinum–germanium catalysts and characterized them using IR spectroscopy, electron microscopy, and H2-O2 adsorption. They concluded that germanium enhanced the selectivity for the isomerization of n-butane while hydrogenation of benzene went through a maximum at about 0.3% Ge. Electronic effects were used to account for these results. A marked decrease in the dispersion of the platinum was found, as was an increase in the CO stretching frequency when germanium was added to the catalyst. Electron microscopy showed a bimodal distribution of particle size for the bimetallic catalyst. The authors suggested that the decrease in the dispersion of the metal as the amount of germanium increased was related to competitive exchange during preparation.
Goldwasser et al.[386] prepared two series of Pt-Ge-alumina catalysts. In one series the Ge-containing alumina was calcined at 873 K prior to the addition of Pt (series B); both series of catalysts were oxidized at 673 K after both metals had been added. For the series A catalysts (Ge added, then dried at 383, and then Pt added) there was a slight decline in platinum dispersion, calculated from the amount of hydrogen adsorbed, as the germanium content increased. For series B, the dispersion did not depend on Ge content. For higher contents of Ge in series A, it appeared that Ge as well as Pt was reduced, in contrast to the lower loading. Thus, the catalysts containing 0.3% Ge and no Ge gave similar TPR curves, whereas the one containing 1.0% Ge showed a second reduction peak when the temperature was increased above about 1000 K. Since a reforming catalyst would normally not be reduced or operated at 1000 K or higher, the data suggest that Ge
would not be reduced in a reforming catalyst.
Bouwman and Biloen[387] showed by XPS that a Pt-Ge catalyst contained Ge2þ and Ge4þ after reduction at 823 K whereas after reduction at 923 K it
contained Ge2þ and Ge0 species; the latter was found to be alloyed with platinum. de Miguel[388] reported that Ge reduction to Ge(0) at 4508C ranged from 15% to
26%; however, these Pt-Ge catalysts were prepared using GeO2. It is therefore quite likely that discrete GeO2 particles remained intact during preparation and
oxidation and may be responsible for the extent of reduction. However, a later report[389] utilized GeCl4 in the preparation procedure, and again Ge was
reduced. From the hydrogen consumption, the authors calculated that 42% of the germanium was Ge2þ and 58% was Ge0, and for samples reduced to 1123 K, 80–100% of the Ge was present as Ge0.
Characterization of Naphtha-Reforming Catalysts |
253 |
The major difference between the series B catalysts utilized by Goldwasser et al.[386] and de Miguel et al.[388,389] was that the former utilized an oxidation
temperature of 673 K whereas the latter utilized a temperature of 773 K. It is likely, just as was the case with Pt-Ir catalysts, that the formation of GeO2 particles during oxidation leads to a different extent of reduction of Ge.
Lead-containing Pt-Al2O3 catalysts have been characterized by a variety of
¨ [390]
techniques. Volter et al. found that with increasing amounts of Sn or Pb in a
Pt-Al2O3 catalyst, the weak adsorption of hydrogen decreased and the adsorption of oxygen increased. There was a correlation between the amount of weakly adsorbed hydrogen and the activity of the catalyst for dehydrocyclization. It was
found that the addition of Pb to Pt-Al2O3 catalysts decreased the adsorbed CO stretching frequency,[391] consistent with the transfer of s-electrons from Pb to Pt.
Their IR and catalytic results indicated that both ligand and ensemble effects
¨ [392]
were important for this catalyst system. Lieske and Volter concluded, on the basis of TPR results, that the major part of Pb is not reduced but exists as carrier-stabilized Pb2þ species; a minor amount of the lead exists as Pb0 in an alloy with Pt. The literature on multimetal and multielement support is increasing very rapidly, and space does not permit an extensive coverage of this area.
7CHARACTERIZATION OF ALKALINE L-ZEOLITES—Pt
The availability of high-resolution TEM permitted the extension of this technique
to the characterization of small metal clusters in zeolites. Gallezot and coworkers[264] were among the early workers to utilize this technique for this
purpose. For example, they reported on the states of Pt dispersed in a Y-zeolite:
˚
isolated atoms in sodalite cages, 10-A-diameter agglomerates fitting into the
˚
supercages, and 15to 20-A crystallites occluded in the zeolite crystals. In at least some cases it appeared that the metal crystallites had ruptured the zeolite structure. This mode of characterization was of interest for naphtha-reforming catalysis particularly following the observation by Bernard[393] that Pt-L exchanged with alkaline cations had exceptional activity and selectivity for n-hexane dehydrocyclization to benzene.
Besoukhanova et al.[394] utilized a combination of XRD, electron micrography, and IR studies of CO adsorption to characterize Pt-L zeolite catalysts containing alkali cations. They concluded that there were four types of Pt
˚ ˚
particles: large 100to 600-A particles outside the channels, crystals 10to 25 A in diameter and small metallic cylinders inside and outside the channels, and very small particles in the cavities of the zeolite structure. They related the catalytic
˚
activity of their catalysts to the 10to 25-A crystals and the small cylinders of Pt.

254 Davis and Antos
From the IR band at 2060–2065 cm21 they concluded that the Pt particles have an excess of electrons and/or atypical faces, corners, or edges.
Hughes et al.[395] determined the Brønsted acid site density of alkaline earth–exchanged L-zeolite from the IR spectrum of adsorbed pyridine. Increasing the oxidation temperature decreased the acidity, and a BaK-L sample oxidized at 866 K had insufficient acidity accessible to pyridine for it to be determined. Shifts in frequency during oxidation permitted them to show that oxidation at 866 K caused the alkaline earth ions to migrate to the locked position
in the small cage (inaccessible to pyridine) and the potassium ions to occupy predominantly the open sites in the large channels of zeolite L.[396] Newell and
Rees[397] reported a similar movement of ions in zeolite L during oxidation. It was contended that any Brønsted acidity present in the BaK-L zeolite was located in the locked sites and could not participate in acidic reactions.
Hughes et al. also reported the apparent dispersion of Pt (0.8 wt %)/BaKL,
assuming that the average metal particle diameter is related to the ratio of surface to total metal atoms by the equation suggested by Anderson[398] (Fig. 22). The
particles detected by TEM were about 0.8–1 nm in diameter. The dispersion data presented in Figure 22 are not in agreement with the TEM data for higher temperatures of reduction. The authors explain this by assuming that the particles are located in the large intercrystalline zeolite channels and, as the particles grow either with increasing reduction time or temperature, the majority of the surface becomes inaccessible to the CO used to measure the dispersion. Thus, the decrease in dispersion shown in Figure 22 is considered to be due to this restricted
Figure 22 Effects of reduction temperature and time on Pt dispersion in 0.8 Pt/BaKL866 (from Ref.[397]).

Characterization of Naphtha-Reforming Catalysts |
255 |
accessibility caused by the Pt particle packing within the large channels, and not due to Pt particle growth beyond about 1 nm diameter.
Rice et al.[399] considered the merits of high-resolution brightfield imaging in the TEM and high-angle annular darkfield imaging in the STEM for the detection and measurement of small noble-metal clusters in zeolites, using Pt-K- L zeolite. They confirmed that high-resolution brightfield imaging is better suited for resolving the zeolite framework. However, even with contrast enhancement, brightfield images are ineffective for detecting clusters containing fewer than about 20 Pt atoms in supports thicker than about 10 nm. This was attributed mainly to phase contrast patterns associated with beam-damaged regions of the zeolite framework. STEM measurements were shown to be capable of detecting single Pt atoms against about 20-nm-thick zeolite support, but the ability to establish the position of the atom relative to the unit cell is limited by beam
damage–induced distortion of the zeolite framework.
Miller et al.[400] utilized TEM as one means of characterizing their PtBaKL zeolite catalyst. EDX spectroscopy was used to analyze several areas of the catalyst to provide evidence that the platinum is present in the interior of the imaged crystallites. Since the platinum particles were not imaged by the electron microscope, the authors inferred that the platinum particles were very small and most likely well dispersed in the zeolite crystallites. Hydrogen chemisorption data indicated that extrapolation to zero pressure showed no adsorption for the KL zeolite and that the hydrogen adsorption on the Pt/BaKL zeolite sample
Figure 23 Correlation of hydrogen chemisorption and first-shell Pt-Pt EXAFS coordination number data. Data represented by triangles from Kip et al. (from Ref.[176]).
256 |
Davis and Antos |
paralleled the higher pressure isotherm for the zeolite. The data gave an H/Pt value of 1.3. EXAFS data provide a Pt-Pt coordination number of 3.7 that, for a bulk-like FCC packing of the Pt atoms in a cluster, corresponds to a cluster of five or six atoms. The absence of higher order Pt-Pt coordination shells are consistent with this nearly unique cluster size. These data showed that extremely small
metal particles covered with chemisorbed hydrogen had metal–metal distances equal to the bulk metal; this was consistent with earlier data.[174,401] These
authors compared their data for H/Pt and coordination number determined by EXAFS (Fig. 23) with earlier data reported by Kip et al.[176] for a series of Pt
supported on g-Al2O3. Another feature of the EXAFS data was evidence for a Pt-Ba interaction; this is surprising in light of the observation by Hughes et al.[395]
that K preferentially locates in the channel. However, the sample used by Miller et al.[400] was oxidized only at 400 K and then reduced at 773 K, both lower temperatures than used by Hughes et al.[395] (886 K).
Larsen and Haller[402] reported a ratio of CO/H of about 0.7 for the adsorption of these two gases on Pt in KL catalysts and attribute the difference to some degree of reversibility of the hydrogen uptakes at 298 K. These authors preferred the CO/Pt ratio as a measure of the dispersion of platinum for these catalysts. These authors also obtained a linear relationship between the EXAFS coordination number and the H/Pt ratio; however, for a particular value of H/Pt Larsen and Haller obtain a larger coordination number than Miller et al.[400] Larsen
and Haller obtained a dispersion, defined as H/Pt, vs. oxidation temperature that was very similar to the one obtained by Hughes et al.,[395] suggesting that restricted
access must also apply to hydrogen.
Figure 24 Proposed model for pore mouth blockage of Pt/KL catalysts (from Ref.[403]).

Characterization of Naphtha-Reforming Catalysts |
257 |
McVicker[403] reported on the characterization of both fresh and sulfur poisoned 0.6% Pt-KL zeolite catalysts. A catalyst oxidized at 623 K and then reduced at 773 K yielded H(irreversible)/Pt ratios in the range 0.9:1.1. Brightfield TEM images showed few Pt clusters greater than 1.0 nm in diameter within the channels of the fresh catalyst, and this was confirmed by in-depth Z-contrast STEM studies. IR spectra of adsorbed CO were consistent with deactivation by sulfur occurring by the systematic loss of accessible Pt sites by a plugging of channels with Pt agglomerates sufficiently large to ‘double plug’ a channel since only the intensity differed for the two catalyst samples. Furthermore, the benzene selectivity from the conversion of n-hexane was the same for the sulfur-free and sulfur-poisoned catalysts. These authors therefore consider pore mouth blockage as the reason for the extreme sensitivity of this catalyst to sulfur poisoning and depict this as illustrated in Figure 24. They offered a histogram, obtained using STEM, of Pt particle size for catalyst samples aged in a sulfur-containing feed that showed particle growth. They obtained brightfield TEM micrographs that showed Pt agglomerates clustered predomi-
Figure 25 Bright-field TEM micrograph of an unbound 0.6% Pt/KL catalyst showing the presence of Pt clusters elongated along the KL channel. The catalyst was recovered from an aromatization experiment after 100 hr on a feed containing 50 wppm sulfur. KL-
˚
zeolite channel spacings of 15.9 A are visible and provide an internal standard for Pt cluster size measurement (from Ref.[403]).
258 |
Davis and Antos |
nantly at the channel entrance (Fig. 25). Iglesia and Baumgartner[404] report that
˚
Pt crystallites located outside the zeolite channels are large (about 100 A) and are coated with graphitic carbon during n-hexane conversion at 783 K; those
particles located in the channel retain their activity for n-hexane conversion. Vaarkamp et al.[405] found that H/Pt was 1.4 for a fresh catalyst with a Pt-Pt
coordination number of 3.7 as determined from EXAFS data, suggesting an average cluster size of five to six atoms. Following sulfur poisoning, the firstshell Pt-Pt coordination number increased to 5.5, indicating a growth of the average platinum cluster size to 13 atoms and a decrease in H/Pt to 1.0. They conclude that growth of the platinum particle was sufficient to block the pore.
IR spectra of adsorbed CO showed that the low-frequency C-O stretching band was closely related to catalytic performance of a series of Pt/KL catalysts.[406] These authors also reported that halogen anions profoundly affect the electronic state of Pt metal as well as its dispersion. KF and KCl were effective in establishing high electron donating ability of Pt, and this results in an excellent catalyst for hexane aromatization.
FTIR data combined with H2-O2 titration and TPR data showed that lanthanides increase the overall dispersion of Pt and that the lanthanide ion increases the fraction of Pt on the external surface of the zeolite. Jacobs et al.[407] also found that a rare earth (Tm) improved the dispersion but only for certain catalyst preparation procedures. Furthermore, the added Tm improved catalyst lifetime by acting as a getter for sulfur. The same group reported that, in the presence of sulfur, the addition of Ce and, to a lesser extent, Yb significantly
inhibits the deactivation of the catalyst. This occurs by the anchoring of the Pt clusters and by the added ions capturing sulfur.[408] This latter paper also
provides a concise summary of results for recent characterization studies of Pt-L zeolite catalysts.
CO adsorption on Pt clusters on L-zeolite has been studied using theoretical and experimental methods.[409] The distribution of heats of adsorption with CO coverage on Pt measured by microcalorimetry were found to agree with calculated values for a 10 Pt cluster with a combination of linear and bridge-
bonded CO.
13C NMR has been used to characterize Pt-K-L zeolite catalysts.[410]
9SUMMARY
The physical properties of a naphtha-reforming catalyst are determined primarily by the alumina support. Thus, the surface area and pore structure result from the support. Likewise, the crystal structure and the physical shape of the alumina particles determine the physical features of the catalyst. Platelet-like alumina may therefore provide steps that can provide a sink for trapping Pt or other metal
Characterization of Naphtha-Reforming Catalysts |
259 |
atoms formed during catalyst reduction and use. General features of the morphology of the catalyst can be obtained from the shape of the nitrogen adsorption/desorption isotherm and the hysteresis between the two. The surface area is best obtained from the nitrogen adsorption isotherm using the BET equation. The pore size distribution is a very demanding assignment that produces at best an engineering, and not absolute, data. Factors that introduce the major uncertainties in the pore size distribution are the technique used to correct for the thickness of the adsorbed layer, whether the adsorption or desorption isotherm is used, and the assumed shape of the pore. From the engineering point of view, one is usually safe to use any model provided data are obtained for
comparative purposes. For most samples, the method of calculation by Broekoff and de Boer[30,31] is most likely to produce a pore size distribution that produces a
surface area that closely agrees with the one using the BET equation.
An absolute measure of the acidity of a reforming catalyst is probably not possible. Adsorption data indicate that alumina adsorbs nitrogen bases from either the gas or liquid phase at room temperature to such an extent that it cannot be reliably used to estimate catalytic activity. One potential approach to measure the acidity responsible for the bifunctional character of the reforming catalyst is to utilize the chemisorption of a sterically hindered base, e.g., 2,6-dimethylpyridine, at high temperatures (300–4008C). With chloride introducing additional or enhanced acidity, the use of chemisorption to measure acidity becomes much more difficult. For the engineering approach, chemisorption of a base is most likely the technique that will provide data to aid in evaluating the potential of a catalyst formulation or for following changes in catalyst performance. It must be emphasized that the technique is not absolute and will therefore provide reliable performance prediction or postmortem examination only after reliable correlations of the plant performance with chemisorption data has been developed. Furthermore, the ability to extrapolate correlations from one catalyst formulation to one that is significantly different, e.g., Pt-alumina and fluorided Pt-alumina, is risky.
Two instrumental techniques that should provide additional understanding of the data from the chemisorption of base are IR spectroscopy and calorimetry. Calorimetry offers the potential to measure the distribution of the acidity, at least on a relative basis. Calorimetry may be utilized to determine acidity distributions at elevated temperatures, closer to those used in commercial reformers. The IR measurement of chemisorbed molecules provides a measure of the distribution of the acid sites between those of a Lewis or Brønsted type. It therefore would appear that a preferred method of acidity measurement is to conduct a high-temperature adsorption of a sterically hindered base for quantitation and to augment the primary adsorption data by characterization of the acid site strength distribution with calorimetric measurements as well as acid site–type measurements with in situ measurements using IR techniques.
260 |
Davis and Antos |
In a commercial operation, the pretreatment and operation procedures appear to provide a catalyst that has a high dispersion of platinum. The combination of high dispersion and low metal loading causes most of the experimental techniques to have little or limited value. For the engineering analysis it appears that chemisorption measurements are the most appropriate. As in the case of the determination of acidity by adsorption, the ability to convert the experimental data to an exact measure of dispersion is limited. This is primarily the result of the lack of knowledge of the ‘correct’ ratio of adsorbate to metal to use in making the calculations as well as the geometry of the ‘cluster’ of platinum atoms. For the engineering approach, a comparison of samples of a given catalyst formulation can be made from a comparison of the value of the ratio of adsorbate to metal, e.g., the H/Pt ratio for the chemisorption of hydrogen. For a catalyst suitable for commercial operation, the ratio should closely approach or exceed 1.
High-resolution electron microscopy is applicable, under suitable conditions, for dispersions that approach the atomic level. Even under conditions where the contrast between the crystalline support and dispersed metal is not ideal, it should be possible to provide an upper limit for the size of the metal particles. TEM is most suited for the examination of materials where the supported material is of a somewhat uniform size distribution. Great care must be exerted by spectroscopists to prevent a focus on structures that are of unusual shape or large size as representative the state of the metal because it is not, in general, possible to define quantitatively the fraction of metal represented by the large particles. The tendency will be to consider the larger particles as being representative of the metal function when in fact they may represent only a minor fraction of the whole sample.
The definition of the state of two or more metals in the polyfunctional reforming catalyst becomes a more demanding task. Consider the case of the Pt-Sn-alumina catalyst. The data show that the Pt is reduced to the metal but that only a fraction of the Sn is reduced from the Sn4þ state. This means that one can only obtain an ‘average’ valence of the Sn. For catalyst formulations prepared by impregnation of both tin and platinum compounds, it has been demonstrated that some of the tin is reduced to the metallic state. Furthermore, the extent of tin reduction depends on the Sn/Pt ratio; the higher the ratio, the greater the reduction of tin to the zero valence state. For most catalyst compositions, the major Pt-Sn alloy is PtSn. For very small Sn/Pt ratios, one can observe some Pt-rich alloys; likewise for high Sn/Pt ratios, higher tin alloys may be present. Considering the data from the characterization studies using a variety of techniques (Mo¨ssbauer, XRD, TEM, microdiffraction, XPS) for a series of these catalysts, a consistent model can be constructed for this catalyst system. A fraction of the tin is present in an oxidized state (Sn2þ, Sn4þ); some of the tin is found to be present as a material approximating a tin aluminate. Depending on the Sn/Pt ratio, some or all of the Pt will be present as an alloy with the dominant species being PtSn. As the surface
Characterization of Naphtha-Reforming Catalysts |
261 |
area of the support increases, the fraction of tin present in an oxidized form increases. Thus, for the same Sn/Pt ratio, less alloy will be present when the support has a high surface area than when it has a low one. The extent of tin reduction also depends on the support; it is much easier to reduce tin to the zero valence state when the support is silica than when it is alumina. A variety of species was proposed by Srinivasan and Davis.[364] A fraction of the surface is covered with a ‘monolayer’ structure that resembles tin aluminate; presumably this tin species retards agglomeration of the Pt species present in the catalyst. Pt is distributed between metallic Pt and PtSn alloy forms; the fraction of each form of Pt depends on the Sn/Pt ratio and the surface area of the support.
In some commercial catalyst formulations, platinum may be supported on a tin/aluminum oxide prepared by coprecipitation. Catalysts prepared this way may have a very different structure than those prepared by coimpregnation. In the case of one type of coprecipitated catalyst, essentially all of the Pt is present in an unalloyed form even for an Sn/Pt ratio of 3. It appears that for coprecipitated supports, one key role of tin is to provide surface traps to retard Pt diffusion and agglomeration. Alloy formation may be less of a factor.
In other cases, Pt-Re or Pt-Ir, the model described above is not appropriate. In these catalysts, both Pt and the second metal appear to be mostly or completely reduced to the zero valence state but alloy formation does not occur to a significant extent. It does appear, however, that there is significant interaction of the two metals in the case of the Pt-Re catalyst. Some authors view the Re to form monolayer rafts on the alumina support, and these rafts serve as an interface between the alumina support and the Pt metal cluster, thereby altering the properties of the supported Pt and preventing agglomeration. While many authors indicate that some portion of the additional metals utilized together with platinum are not completely reduced, the role of the ions of the second component is not clear. One of the roles most frequently encountered in the literature is that of inhibiting the agglomeration of platinum.
In summary, it appears that many of the instrumental techniques for catalyst metal function characterization can be applied to the commercial naphtha-reforming catalyst only with great difficulty and with limited success. Those techniques that depend on the presence of metallic crystals, e.g., XRD, are applicable only for postmortems to identify the reason for catalyst failure or aging. For the very active commercial catalyst, the characterization technique must be applicable to those situations where the dispersion is at or near the atomic level. For these characterizations, it appears that chemisorption offers the ‘best’ characterization capabilities. Some of the newer instrumental techniques, e.g., EXAFS, offer the potential to provide a characterization at these high dispersions, but further advances in the ability to derive structures from the experimental data must be attained.
The current and future trends in naphtha catalyst characterization are driven by the demand placed on the techniques due to the low concentrations of
262 |
Davis and Antos |
the metallic and acidic functions of the commercial catalysts. The future characterizations will be driven by in situ techniques.[411 – 413] Furthermore, the
in situ studies will be increasingly directed to operating under conditions that attain, or at least approach, commercial conditions.[414,415] In spite of this there
will continue to be studies that involve model reactants and/or conditions that are far removed from commercial conditions.[416,417]
REFERENCES
1.Burwell, R.L., Jr. Manual of symbols and terminology of physicochemical quantities and units, Appendix II. Part II: Heterogeneous catalysis. Adv. Catal. 1977, 26, 351.
2.Haensel, V. In Chemistry of Petroleum Hydrocarbons; Brooks, B.T., Boord, C.E., Kurtz, S.S., Jr., Schmerling, L., Eds.; Reinhold: New York, 1955; Vol. 2, p. 189.
3.Brunauer, S.; Emmett, P.H.; Teller, E. J. Am. Chem. Soc. 1938, 60, 309.
4.Emmett, P.H. Citation classic. Commentary on J. Am. Chem. Soc. 1938, 60, 309. Current Contents 1977, 35 (9), August 29.
5.Adamson, A.W. Physical Chemistry of Surfaces, 5th Ed.; Wiley Interscience: New York, 1990.
6.Davis, B.H. Chemtech 1991, 21, 18.
7.Halsey, G. J. Phys. Chem. 1948, 16, 931.
8.Avnir, D. J. Am. Chem. Soc. 1987, 109, 2931.
9.Davis, B.H. Appl. Catal. 1984, 10, 185.
10.Barrett, E.; Joyner, L.; Halenda, P. J. Am. Chem. Soc. 1951, 73, 373.
11.Wheeler, A. Adv. Catal. 1951, 3, 249; 1955, 2, 105.
12.Dollomire, D.; Heal, G. J. Appl. Chem. 1964, 14, 109.
13.Broekhoff, J.C.P. Adsorption and Capillarity; Ph.D. Thesis, University of Delft, 1969.
14.Broekhoff, J.C.P.; Linsen, B.C. In Physical and Chemical Aspects of Adsorbents and Catalysts; Linsen, B.G., Ed.; Academic Press: New York, 1970.
15.Adkins, B.A.; Davis, B.H. Langmuir 1987, 3, 722.
16.Innes, W.B. In Experimental Methods in Catalytic Research; Anderson, R.B., Ed.; Academic Press: New York, 1968; Vol. 1, 45–99.
17.Innes, W.B. Anal. Chem. 1957, 29, 1069.
18.Anderson, R.B. J. Catal. 1964, 3, 50 and 301.
19.Wayne, L.G. J. Am. Chem. Soc. 1951, 73, 5498.
20.Lippens, B.C.; Linsen, B.G.; de Boer, J.H. J. Catal. 1964, 3, 32.
21.Schull, C.; Elkin, P.; Roess, L. J. Am. Chem. Soc. 1948, 70, 1410.
22.Pierce, C. J. Phys. Chem. 1953, 57, 149.
23.Cranston, R.W.; Inkley, F.A. Adv. Catal. 1957, 9, 143.
24.Pure Appl. Chem. 1985, 57, 603–619.
25.Brunauer, S.; Deming, L.S.; Deming, W.S.; Teller, E. J. Am. Chem. Soc. 1990, 62, 1723.
26.Adkins, B.D.; Davis, B.H. Ads. Sci. Technol. 1988, 5, 168.
Characterization of Naphtha-Reforming Catalysts |
263 |
27.Adkins, B.D.; Davis, B.H. Ads. Sci. Technol. 1988, 5, 76.
28.Foster, A.G. Trans. Faraday Soc. 1932, L8, 645.
29.Cohan, L.H. J. Am. Chem. Soc. 1938, 60, 433.
30.Broekhoff, J.C.P.; de Boer, J.H. J. Catal. 1967, 9, 15.
31.Broekhoff, J.C.P.; de Boer, J.H. J. Catal. 1968, 10, 368.
32.Frennet, A.; Chitry, V.; Kruse, N. Appl. Catal. A: Gen. 2002, 229, 273.
33.Gillespie, R.D. U.S. 6,214,764 B1, April 10, 2001.
34.Ritter, H.L.; Erich, L.C. Ind. Eng. Chem. Anal. Ed. 1948, 20, 665.
35.Quantachrome Corp. Effect of Coating of Catalyst Supports in Mercury Porosimetry. Powder Technology Note 16.
36.Leofanti, G.; Padovan, M.; Tozzola, G.; Venturelli, B. Catal. Today 1998, 41, 207–219.
37.Rouquerol, F.; Rouquerol, J.; Sing, K. Adsorption by Powders and Porous Solids: Principles, Methodology and Applications; Academic Press: New York, 1999.
38.Sharma, I.D.; Kumar, M.; Saxena, A.K.; Chand, M.; Gupta, J.K. J. Mol. Catal. A: Chem. 2002, 185, 135.
39.Benesi; Wenquist. Adv. Catal. 1978, 27, 97.
40.Walling, C. J. Am. Chem. Soc. 1950, 72, 1164.
41.Benesi, H.A. J. Catal. 1973, 28, 176.
42.Gold, V.; Hawes, B.W. J. Chem. Soc. 1951, 2102.
43.Deno, N.C.; Jaruzelski, J.J.; Schriesheim, A. J. Am. Chem. Soc. 1955, 77, 3044.
44.Deno, N.C.; Berkheimer, H.E.; Evans, W.L.; Peterson, H.J. J. Am. Chem. Soc. 1959, 81, 2344.
45.Tanabe, K. Solid Acids and Bases; Academic Press: New York, 1970.
46.Tanabe, K. In Catalysis by Acids and Bases; Imelik, B., Naccache, C., Coudurien, G., Ben Taaret, Y., Vedrin, J.C., Eds.; Elsevier: Amsterdam, 1985; Vol. 20, p. 1.
47.Tanabe, K.; Misono, M.; Ono, Y.; Hattori, H. New Solid Acids and Bases; Elsevier: Amsterdam, 1989; Vol. 51.
48.Parry, E.P. J. Catal. 1963, 2, 371.
49.Peri, J.B. J. Phys. Chem. 1965, 69, 220.
50.Parkyns, N.D. J. Phys. Chem. 1971, 75, 526.
51.Fink, P. Z. Chem. 1967, 7, 324.
52.Hightower, J.W.; Hall, W.K. Trans. Faraday Soc. 1970, 66, 477.
53.Peri, J.B., 2nd Int. Congr. Catal. (Paris 1960), 1961, 1333.
54.Eischens, R.P.; Pliskin, W.A. Adv. Catal. 1958, 10, 2–95.
55.Kno¨zinger, H. NATO ASE Ser., B 1991, 265, 167.
56.Bell, A.T. Springer Ser. Chem. Phys. 1984, 35 (Chem. Phys. Solid Surf. 5), 23–38.
57.Paukstis, E.; Yurchenko, E.N. Usp. Khim. 1983, 52, 426.
58.Van Woerkom, P.C.M.; De Grott, R.L. Appl. Opt. 1982, 21, 3114.
59.Kiselev, A.V.; Lygin, V.I. Infrared Spectra of Surface Compounds; John Wiley and Sons: New York, 1975.
60.Peri, J.B. J. Phys. Chem. 1965, 69, 211.
61.Peri, J.B.; Hannan, R.B. J. Phys. Chem. 1960, 64, 1526.
264 |
Davis and Antos |
62.Carter, J.L.; Lucchesi, P.J.; Cornell, P.; Yates, D.J.C.; Sinfelt, J.H. J. Phys. Chem. 1965, 69, 3070.
63.Dunken, H.; Fink, P. Z. Chem. 1966, 6, 194.
64.Hall, W.K.; Leftin, H.P.; Cheselsee, P.J.; O’Reilly, D.E. J. Catal. 1963, 2, 506.
65.Peri, J.B. J. Phys. Chem. 1965, 69, 231.
66.Kno¨zinger, K. In Catalysis by Acids and Bases; Imelik, B., et al., Eds.; Elsevier: Amsterdam, 1985; 111–125.
67.Busca, G. Catal. Today 1998, 41, 191–206.
68.Ferwerda, R.; van der Maas, J.H.; van Duijneveldt, F.B. J. Mol. Catal. A: Chem. 1996, 104, 319.
69.Lavalley, J.C. Catal. Today 1996, 27, 377.
70.Bovet, C. Thesis, University of Caen, 1981.
71.Davis, B.H.; Koegh, R.A.; Alerasool, S.; Zalewski, D.J.; Day, D.E.; Doolin, P.K.
J.Catal. 1999, 183, 45–52.
72.Kno¨zinger, H. Adv. Catal. Rel. Subj. 1976, 25, 184.
73.Larrubia, M.A.; Gutie`rrez-Alejandre, A.; Ramı`rez, J.; Busca, G. Appl. Catal. A: Gen. 2002, 224, 167.
74.Wachs, I.E. Catal. Today 1996, 437–455.
75.Wachs, I.E. Top. Catal. 1999, 8, 57–63.
76.Wachs, I.E. (I.R. Lewis and H.G.M. Edwards, eds.) Handbook of Raman Spectroscopy; 2001; Vol. 28, 799–833.
77.Lee, I.C.; Masel, R.I. J. Phys. Chem. B 2002, 106, 368–373.
78.Kazansky, V.B.; Borovkov, V.Yu.; Kustov, L.M. Proc. 8th Int. Congr. Catal., Berlin, 1984; Vol. III, 3–14.
79.Escalona Platero, E.; Otero Aren, C. J. Catal. 1987, 107, 244–247.
80.Morterra, C.; Magnacca, G.; Filippi, F.; Giachello, A. J. Catal. 1992, 137, 346–356.
81.Vannice, M.A.; Hasselbring, L.C.; Sen, B. J. Catal. 1985, 95, 57.
82.Gervasini, A.; Auroux, A. J. Thermal Anal. 1991, 37, 1737.
83.Cardona-Martinez, N.; Dumesic, J.A. J. Catal. 1991, 128, 23.
84.Cardona-Martinez, N.; Dumesic, J.A. J. Catal. 1991, 127, 706.
85.Solinas, V.; Ferino, I. Catal. Today, 1998, 41, 179–189.
86.Sharma, S.B.; Ouraipryvan, P.; Nair, H.A.; Balaraman, P.; Root, T.W.; Dumesic, J.A.;
J.Catal. 1994, 150, 234.
87.Gates, B.C.; Katzer, J.R.; Schuit, G.C.A. In Chemistry of the Catalytic Processes; McGraw-Hill: New York, 1979; p. 289.
88.Musso, J.C.; Parera, J.M. Appl. Catal. 1987, 30, 81.
89.Parmaliana, A.; Frusteri, F.; Mezzapica, A.; Giordano, N. J. Catal. 1988, 111, 235.
90.Lieske, H.; Lietz, G.; Spindler, H.; Vo¨lter, J. J. Catal. 1983, 81, 8.
91.Sivasanker, S.; Ramaswamy, A.V.; Ratnasamy, P. Preparation of Catalysts II; Delmon, B., Grange, P., Jacobs, P.A., Poncelet, G., Eds.; Elsevier: Amsterdam, 1979; p. 185.
92.Castro, A.A.; Scelza, O.A.; Benvenuto, E.R.; Baronetti, G.T.; Parera, J.M. J. Catal. 1981, 69, 222.
Characterization of Naphtha-Reforming Catalysts |
265 |
93.Castro, A.A.; Scelza, O.A.; Baronetti, G.T.; Fritzler, M.A.; Parera, J.M. Appl. Catal. 1983, 6, 347.
94.Bishara, A.; Murad, K.M.; Stanislaus, A.; Ismail, M.; Hussain, S.S. Appl. Catal. 1983, 7, 337.
95.Grau, J.M.; Jablonski, E.L.; Pieck, C.L.; Verderone, R.J.; Perera, J.M. Appl. Catal. 1988, 36, 109.
96.Mardilovich, P.P.; Lysenko, G.N.; Kupchenko, G.G.; Kurman, P.V.; Titova, L.I.; Trokhimets, A.I. React. Kinet. Catal. Lett. 1988, 36, 357.
97.Arena, F.; Frusteri, F.; Mondello, N.; Giordano, N.; Parmaliana, A. J. Chem. Soc. Faraday Trans. 1992, 88 (22), 3353.
98.Bishara, A.; Murad, K.M.; Stanislaus, A.; Ismail, M.; Hussain, S.S. Appl. Catal. 1983, 6, 347.
99.Ayame, A.; Sawada, G.; Sato, H.; Zhang, G.; Ohta, T.; Izumizawa, T. Appl. Catal. 1989, 48, 25.
100.Tanaka, M.; Ogasawara, S. J. Catal. 1970, 16, 157.
101.Garbowski, E.G.; Primet, M. J. Chem. Soc. Faraday Trans. 1 1987, 83, 1469.
102.Khaleel, A.; Dellinger, B. Environ. Sci. Technol. 2002, 36, 1620.
103.Vigue´, H.; Quintard, P.; Merle-Me´jean, T.; Lorenzelli, V. J. Eur. Ceram. Soc. 1998, 18, 305.
104.Gracia, E.J.; Miller, J.T.; Kropf, A.J.; Wolf, E.E. J. Catal. 2002, 209, 341.
105.Webb, A.N. Ind. Eng. Chem. 1957, 49, 261.
106.Strand, P.; Kraus, M. Collect. Czech. Chem. Commun. 1965, 30, 1136.
107.Matsuura, K.; Watanabe, T.; Suzuki, A.; Itoh, M. J. Catal. 1972, 26, 127.
108.Yusheckenki, V.V.; Antipina, T.V. Kinet. Katal. 1970, 11, 134.
109.Scokart, P.O.; Selim, S.A.; Damon, J.P.; Rouxhet, P.G. J. Colloid. Interf. Sci. 1979, 70, 209.
110.Kerkhof, F.P.J.M.; Oudejans, J.C.; Moulijn, J.A.; Matulewicz, E.R.A. J. Colloid. Interf. Sci. 1980, 77, 120.
111.Holm, V.C.F.; Clark, A. J. Catal. 1967, 8, 286.
112.Corma, A.; Forne´s, V.; Ortega, E. J. Catal. 1985, 92, 284.
113.Matulewicz, E.R.A.; Kerkhof, F.P.J.M.; Moulijn, J.A.; Reitsma, H.A. J. Colloid. Interf. Sci. 1980, 77, 110.
114.Hirschler, A.E. J. Catal. 1963, 2, 428.
115.Weber, A.B.R. Thesis; Univ. of Delft, Netherlands, 1957.
116.Holm, V.C.F.; Clark, A. Ind. Eng. Chem., Prod. Res. Dev. 1963, 2.
117.Clark, A.; Holm, V.C.F.; Blackburn, D.M. J. Catal. 1962, 1, 244.
118.Hedge, R.I.; Barteau, M.A. J. Catal. 1989, 120, 387.
119.Scokart, P.O.; Rouxhet, P.G. J. Colloid. Interf. Sci. 1982, 86, 96.
120.Kowalak, S. Acta. Chim. Acad. Sci. Hung. 1981, 107, 27.
121.Kowalak, S. Acta. Chim. Acad. Sci. Hung. 1981, 107, 19.
122.O’Reilly, D.E. Adv. Catal. 1960, 12, 66.
123.DeCanio, E.C.; Edwards, J.C.; Scalzo, T.R.; Storm, D.A.; Bruno, J.W. J. Catal. 1991, 132, 498.
124.Fischer, L.; Harle´, V.; Kasztelan, S.; D’Espinsoede la Caillerie, J.-B. Solid State NMR 2000, 16, 85–91.
266 |
Davis and Antos |
125.Davis, S.M.; Meitzner, G.B.; Fischer, D.A.; Gland, J. J. Catal. 1993, 142, 368.
126.Baird, T.; Bendada, A.; Selougha, M.; Webb, G.; Winfield, J.M. J. Fluorine Chem. 1994, 69, 109.
127.McHenry, K.W.; Bertolacini, R.J.; Brennan, H.M.; Wilson, J.L.; Seeling, H.S. Proc. 2nd Int. Congr. Catal. (Paris, 1990); 1962; Vol. 2, p. 2293.
128.Drake, L.C. personal communication.
129.Bursian, N.R.; Kogan, S.B.; Davydova, Z.A. Kinet. Katal. 1967, 8, 1085.
130.Johnson, M.F.L.; Keith, C.D. J. Phys. Chem. 1963, 67, 200.
131.Putanov, P.; Ivanovic, M.; Selakovic, O. React. Kinet. Catal. Lett. 1978, 8, 223.
132.Kluksdahl, H.E.; Houston, R.J. J. Phys. Chem. 1961, 65, 1469.
133.Ermakova, S.I.; Zaidman, N.M. Kinet. Katal. 1969, 10, 1158.
134.Shekhobalova, V.I.; Luk’yanova, Z.V. Russian J. Phys. Chem. 1979, 53, 1551.
135. Lietz, G.; Lieske, H.; Spindler, N.; Hanke, W.; Vo¨lter, J. J. Catal. 1983, 81, 17.
136.Botman, M.J.P.; She, L.Q.; Zhang, J.Y.; Driessen, W.L.; Ponec, V. J. Catal. 1987, 103, 280.
137.Botman, M.J.P. Ph.D. thesis; University of Lieden, 1987.
138.Lemaitre, J.L.; Menon, F.G.; Delannay, F. In Characterization of Heterogeneous Catalysts; Delannay, F., Ed.; Marcel Dekker: New York, 1984; 299–366.
139.Adams, C.R.; Benesi, H.A.; Curtis, R.M.; Meisenheimer, R.G. J. Catal. 1962, 1, 336.
140.Klug, H.P.; Alexander, L.E. X-ray Diffraction Procedures; John Wiley and Sons: New York, 1954; Chap. 9.
141.Srinivasan, R.; Rice, L.; Davis, B.H. J. Am. Ceram. Soc. 1990, 73, 3528.
142.Ascarelli, P.; Contini, V.; Giorgi, R. J. Appl. Phys. 2002, 91, 4556.
143.Rhodes, H.E.; Wang, P.-K.; Stokes, H.T.; Slichter, C.P.; Sinfelt, J.H. Phys. Rev. B 1982, 26, 3599.
144.Van Hardevelt, R.; Hartog, F. Surf. Sci. 1969, 15, 189.
145.White, D.; Baird, T.; Fryer, J.R.; Freeman, L.A.; Smith, D.J.; Day, M. J. Catal. 1983, 81, 119.
146.Gai, P.L.; Goringe, M.J.; Barry, J.C. J. Microsc. 1986, 142, 9.
147.Datye, A.K.; Smith, D.J. Catal. Rev.-Sci. Eng. 1992, 34, 129.
148.Treacy, M.M.J.; Rice, S.B. J. Microsc. 1989, 156, 211.
149.Schwank, J.; Allard, L.F.; Deeba, M.; Gates, B.C. J. Catal. 1983, 84, 27.
150.Tesche, B.; Zeilter, E.; Delgado, E.A.; Kno¨zinger, H. Proc. 40th Ann. Mtg. Electron Microscopy Society of America; Bailey, G.W., Ed.; San Francisco Press: San Francisco, 1982; p. 682.
151.Huang, Z.; Fryer, J.R.; Park, C.; Stirling, D.; Webb, G. J. Catal. 1996, 159, 340.
152.Langmuir, I. J. Am. Chem. Soc. 1916, 38, 2221.
153.Benton, A.F.; White, T. J. Am. Chem. Soc. 1932, 54, 1820.
154.Podgurski, H.H.; Emmett, P.H. J. Am. Chem. Soc. 1953, 57, 159.
155.Brunauer, S.; Emmett, P.H. J. Am. Chem. Soc. 1935, 57, 1754.
156.Brunauer, S.; Emmett, P.H. J. Am. Chem. Soc. 1937, 59, 310.
157.Via, G.H.; Meitzner, G.; Lytle, F.W.; Sinfelt, J.H. J. Chem. Phys. 1982, 79, 1527.
158.Hollaway, P.H. Surf Interf. Anal. 1985, 7, 204–205.
Characterization of Naphtha-Reforming Catalysts |
267 |
159.Benesi, H.A.; Curtis, R.M.; Studer, H.P. J. Catal. 1968, 10, 328.
160.Dorling, T.A.; Eastlake, M.J.; Moss, R.L. J. Catal. 1969, 14, 23.
161.Dorling, T.A.; Lynch, B.W.J.; Moss, R.L. J. Catal. 1971, 20, 190.
162.Christmann, K.; Ertl, G.; Pignet, T. Surf. Sci. 1976, 54, 365.
163.Adler, S.F.; Keavney, J.J. J. Phys. Chem. 1960, 64, 208.
164.Herrmann, R.H.; Adler, S.F.; Goldstein, M.S.; DeBaun, R.M. J. Phys. Chem. 1961, 65, 2189.
165.Boronin, V.S.; Nikulina, V.S.; Poltorak, O.M. Russian J. Phys. Chem. 1963, 37, 1174.
166.Boronin, V.S.; Poltorak, O.M.; Turakulova, A.O. Russian J. Phys. Chem. 1974, 48, 156.
167.Frennet, A.; Wells, P.B. Appl. Catal. 1985, 18, 243.
168.Rabo, J.A.; Schomaker, V.; Pickert, P.E. In Proceedings 3rd Int. Congr. Catal.; W.M.H. Sachtler, G.C. Schuit, Zwietering, P. Eds.; North-Holland Pub. Co., Amsterdam, 1964; p. II-1264.
169.Sato, S. J. Catal. 1985, 92, 11.
170.McVicker, G.B.; Baker, R.T.K.; Garten, R.L.; Kugler, E.L. J. Catal. 1980, 65, 207.
171.Krishnamurthy, S.; Landolt, G.R.; Schoennagel, H.J. J. Catal. 1982, 78, 319.
172.Vis, J.C.; Van’t Blik, H.F.J.; Huizinga, T.; Van Grondelle, J.; Prins, R. J. Catal. 1985, 59, 333.
173.Vis, J.C.; Van’t Blik, H.F.J.; Huizinga, T.; Van Grondelle, J.; Prins, R. J. Mol. Catal. 1984, 25, 367.
174.Koningsberger, D.C.; Sayers, D.E. Solid State Ionics 1985, 16, 23.
175.Kip, B.J.; Van Grondelle, J.; Martens, J.H.A.; Prins, R. Appl. Catal. 1986, 26, 353.
176.Kip, B.J.; Duivenvoorden, F.B.M.; Koningsberger, K.C.; Prins, R. J. Catal. 1987, 105, 26–38.
177.Sinfelt, J.H.; Lam, Y.L.; Cusumano, J.A.; Barnett, A.E. J. Catal. 1976, 42, 227.
178.Sinfelt, J.H.; Via, G.H. J. Catal. 1979, 56, 1.
179.Sayari, A.; Wang, H.T.; Goodwin, J.G., Jr. J. Catal. 1985, 93, 368.
180.Yang, C.; Goodwin, J.R., Jr. J. Catal. 1982, 78, 182.
181.Kramer, R.; Andre, M. J. Catal. 1979, 58, 287.
182.Cavanagh, R.R.; Yates, J.T., Jr. J. Catal. 1981, 68, 22.
183.Bianchi, D.; Lacroix, M.; Pajonk, G.; Teichner, S.J. J. Catal. 1979, 59, 467.
184.Wanke, S.E.; Dougharty, N.A. J. Catal. 1972, 24, 367.
185.Konvalinka, J.A.; Scholten, J.J.F. J. Catal. 1977, 48, 374.
186.Eberhardt, W.; Greuter, F.; Plummer, E.W. Phys. Rev. Lett. 1981, 46, 1085.
187.Yates, J.T., Jr.; Peden, C.H.F.; Houston, J.E.; Goodman, D.W. Surf. Sci. 1985, 160, 37.
188.Benson, J.E.; Boudart, M. J. Catal. 1965, 4, 704.
189.Menon, P.G. In Advances in Catalysis Science and Technical (Proc. 7th Natl. Catal. Symp., India, Baroda, 1985); Wiley Eastern Ltd.: New Delhi, 1986; L1–L15.
190.Prasad, J.; Murthy, K.R.; Menon, P.G. J. Catal. 1978, 52, 515.
191.Isaacs, B.H.; Petersen, E.E. J. Catal. 1984, 85, 1.
192.Kobayashi, M.; Inoue, Y.; Takahashi, N.; Burwell, R.L.; Butt, J.B.; Cohen, J.B. J. Catal. 1980, 64, 74.
193.Freel, J. J. Catal. 1972, 25, 149.
268 |
Davis and Antos |
194.O’Rear, D.J.; Lo¨ffler, D.G.; Boudart, M. J. Catal. 1990, 121, 131–140.
195.Gland, J.L. Surf. Sci. 1980, 93, 487.
196.Wilson, G.R.; Hall, W.K. J. Catal. 1970, 17, 190.
197.Wilson, G.R.; Hall, W.K. J. Catal. 1972, 24, 306.
198.Gallezot, P.; Alarcon-Diaz, A.; Dalmon, J.A.; Renouprez, A.J.; Imelik, B. J. Catal. 1975, 39, 334.
199.Netzer, F.P.; Gruber, H.L. Z. Phys. Chem. 1975, NF96, 25.
200.Menon, P.G.; Froment, G.F. J. Catal. 1979, 59, 138.
201.Porod, G. Small-Angle X-ray Scattering; Glatter, O., Kratky, O., Eds.; Academic Press: New York, 1982; Part II, Chap. 2.
202.Brumberger, H. Trans. Am. Crystallogr. Assoc. 1983, 19, 1.
203.Brumberger, H.; Delaglio, F.; Goodisman, J.; Whitefield, M. J. Appl. Crystallogr. 1986, 19, 287.
204.Brill, G.L.; Weil, C.G.; Schmidt, P.W. J. Colloid Interf. Sci. 1968, 27, 479.
205.Delaglio, F.; Goodisman, J.; Brumberger, H. J. Catal. 1986, 99, 383.
206.Hall, P.G.; Williams, R.T. J. Colloid Interf. Sci. 104, 151.
207.Glatter, O.; Kratky, O. Small-Angle X-ray Scattering; Academic Press: New York, 1982.
208.Whyte, T.E., Jr.; Kirklin, P.W.; Gould, R.W.; Heinemann, H. J. Catal. 1972, 25, 407.
209.Cocco, G.; Schiffini, L.; Strukul, G.; Garturan, G. J. Catal. 1980, 65, 348.
210.Somorjai, G.A.; Powell, R.E.; Montgomery, P.W.; Jura, G. Small-Angel X-ray
Scattering; Brumberger, H., Ed.; Gordon and Breach: New York, 1967; 449–466.
211.Brumberger, H. Makromol. Chem., Macromol. Symp. 1988, 15, 223–230.
212.Goodisman, J.; Brumberger, H.; Cupelo, R. J. Appl. Crystallogr. 1981, 14, 305–308.
213.Brumberger, H.; Delaglio, F.; Goodisman, J.; Phillips, M.G.; Schwarz, J.A.; Sen, P. J. Catal. 1985, 92, 199–210.
214.Brumberger, H.; Chang, Y.C.; Phillips, M.G.; Delaglio, F.; Goodisman, J. J. Catal. 1986, 97, 561.
215.Brumberger, H.; Goodisman, J. J. Appl. Crystallogr., 1983, 16, 83.
216.Kronig, R. de L. J. Phys. 1931, 70, 317; 1932, 75, 468; 1932, 76, 468.
217. Winick, H.; Doniach, S. Synchrotron Radiation Research; Plenum Press: New York, 1980.
218.Stern, E.A.; Sayes, D.E.; Lytle, F.W. Phys. Rev. B 1975, 11, 4825, 4836.
219.Teo, B.K. EXAFS: Basic Principles and Data Analysis; Springer-Verlag: Berlin, 1986.
220.Teo, B.K.; Joy, D.C. Eds. EXAFS Spectroscopy: Techniques and Applications; Plenum Press: New York, 1981.
221.Lytle, F.W.; Greegor, R.B.; Marques, E.C. In Proc. 9th Int. Catal. Congr.; Phillips, M.J., Ternan, M., Eds.; The Chemical Institute of Canada, Ottawa, 1988; Vol. 5, p. 54.
222.Sinfelt, J.H.; Via, G.H.; Lytle, F.W. Catal. Rev.-Sci. Eng. 1984, 26, 81.
223.Prins, R.; Koningsberger, D.C. In Catalysis; Anderson, J.R., Boudart, M., Eds.; Springer-Verlag, New York, 1987, 1988; Vol. 8, p. 321.
224.Bazin, D.; Dexpert, H.; Lagarde, P. Top. Curr. Chem. 1988, 145, 69.
225.Lagarde, P.; Dexpert, H. Advances in Physics 1984, 33, 567.
Characterization of Naphtha-Reforming Catalysts |
269 |
226.Sinfelt, J.H.; Meitzner, G.D. Acc. Chem. Res. 1993, 26, 1.
227.Heald, S.M.; Tranquada, J.M. Physical Methods in Chemistry, 2nd Ed.; 1990; Vol. 5, p. 189.
228.Guyot-Sionnest, N.S.; Bazin, D.; Lunch, J.; Bournonville, J.T.; Dexpert, H. Physica 1989, B158, 211.
229.Lengeler, B.; Eisenberger, P. Phys. Rev. 1980, B21, 4057.
230.Zhao, J.; Montano, P.A.; Phys. Rev. 1989, B40, 3401.
231.Zhao, J., Ph.D. thesis, West Virginia University; 1991; personal communication.
232.Lytle, F.W.; Greegor, R.B.; Marques, E.C.; Sandstrom, D.R.; Via, G.H.; Sinfelt, J.H. J. Catal. 1985, 95, 546.
233.Lytle, F.W.; Greegor, R.B.; Marques, E.C.; Biebesheimer, V.A.; Sandstrom, D.R.; Horsley, J.A.; Via, G.H.; Sinfelt, J.H. Catalyst Characterization Science; Deveney, M.L., Gland, J.L., Eds.; ACS Symp. Series; 1985; Vol. 288, p. 280.
234.Marques, E.C.; Sandstrom, D.R.; Lytle, F.W.; Greegor, R.B. J. Chem. Phys. 1982, 77 (2), 1027.
235.Dalla Betta, R.A.; Boudart, M.; Foger, K.; Lo¨ffler, D.G.; Sa´nchez-Arrieta, J. Rev. Sci. Instrum. 1984, 55, 1910.
236.Neils, T.L.; Burlitch, J.M. J. Catal. 1989, 118, 79.
237.Dexpert, H. J. Phys., Colloque C8 1986, 47 (Suppl. 12), C8-219, C8-226.
238.Guyot-Sionnest, N.S.; Villain, F.; Bazin, D.; Dexpert, H.; Le Peltier, F.; Lynch, J.; Bournonville, J.P. Catal. Lett. 1991, 8, 283.
239.Wei, P.S.P.; Lytle, F.W. Phys. Rev. 1979, B19, 679.
240.Lytle, F.W. J. Catal. 1976, 43, 376–379.
241.Meitzner, G.; Via, G.H.; Lytle, F.W.; Sinfelt, J.H. J. Phys. Chem. 1992, 96, 4960.
242.Lytle, F.W.; Wei, P.S.P.; Greegor, R.B.; Via, G.H.; Sinfelt, J.H. J. Chem. Phys. 1979, 70, 4849.
243.Sinfelt, J.H.; Via, G.H.; Lytle, F.W.; Greegor, R.B. J. Chem. Phys. 1981, 75, 5527.
244.Meitzner, G. Catal. Today 1998, 39, 281.
245.Bazin, D.; Guczi, L. Rec. Res. Dev. Phys. Chem. 1999, 3, 387.
246.Newton, M.A.; Dent, A.J.; Evans, J. Chem. Soc. Rev. 2002, 31, 83.
247.Bazin, D.; Sayers, D.; Rehr, J.J.; Mottet, C. J. Phys. Chem. B 1997, 101, 5332.
248.Bazin, D.; Mottet, C.; Tre´glia, G. Appl. Catal. A: Gen 2000, 200, 47.
249.de Groot, F.M.F. Top. Catal. 2000, 10, 179.
250.Koningsberger, D.C.; Mojet, B.L.; van Dorssen, G.E.; Ramaker, D.E. Top. Catal. 2000, 10, 143–155.
251.Rehr, J.J.; Ankudinov, A.; Zabinsky, S.I. Catal. Today, 1998, 39, 262.
252.Lagarde, P. Ultramicroscopy, 2001, 80, 255.
253.Ferna´ndez-Garcı´a, M. Catal. Rev.-Eng. Sci. 2002, 44, 59–121.
254.Bazin, D.; Triconnet, A.; Moureaux, P. Nucl. Instrum. Meth. Phys. Res. B 1995, 97, 41.
255.Spieker, W.A.; Liu, J.; Miller, J.T.; Kropf, A.J.; Regalbuto, J.R. Appl. Catal. A: Gen. 2002, 232, 219.
256.Ramaker, D.E.; van Dorssen, G.E.; Mojet, B.L.; Koningsberger, D.C. Top. Catal. 2000, 10, 157, 167.
257.Yu, I.; Gibson, A.A.V.; Hunt, E.R.; Halperin, W.P. Phys. Rev. Lett. 1980, 44, 348.
270 |
Davis and Antos |
258.de Me´norval, L.-C.; Fraissard, J.P. Chem. Phys. Lett. 1981, 77, 309.
259.Rouabah, D.; Benslama, R.; Fraissard, J. Chem. Phys. Lett. 1991, 179, 218.
260.de Me´norval, L.-C.; Ito, T.; Fraissard, J. J. Chem. Soc. Faraday Trans. 1982, 78, 403.
261.Dalla Betta, R.A.; Boudart, M. Proc. 5th Int. Congr. Catal.; Hightower, J.W., Ed.; North-Holland: Amsterdam, 1973; Vol. 2, p. 1329.
262.Boudart, M.; Dje´ga-Mariadassou, G. Kinetics of Heterogeneous Catalysis Reactions; Princeton University Press: Princeton, NJ, 1984.
263.Gallezot, P.; Mutin, I.; Dalmai-Imelik, G. J. Microsc. Spectrosc. Electron. 1976, 1, 1.
264.Gallezot, P.; Bienenstock, A.I.; Boudart, M. Nouv. J. Chim. 1978, 2, 263.
265.Weber, R.S. PhD dissertation, Stanford University: Stanford, CA, 1985.
266.Ryoo, R.; Pak, C.; Chmelka, B. Zeolites 1990, 10, 790.
267.Boudart, M.; Valenc¸a, G.P. J. Catal. 1991, 128, 447.
268.Boudart, M.; Samant, M.G.; Ryoo, R. Ultramicroscopy 1986, 20, 125.
269.Rivera-Latas, F.J.; Dalla Betta, R.A.; Boudart, M. AIChE J 1992, 38, 771.
270.Dexpert, H.; Freund, E.; Lesage, E.; Lynch, J.P. Stud. Surf. Sci. Catal. 1982, 11, 53.
271. Boudart, M.; Ryoo, R.; Valenc¸a, G.P.; Van Grieken, R. Catal. Lett. 1993, 17, 273.
272.Sharma, S.B.; Laska, T.E.; Balaraman, P.; Root, T.W.; Dumesic, J.A. J. Catal. 1994, 150, 225.
273.Han, O.H.; Larsen, G.; Haller, G.L.; Ziln, K.W. Bull. Korean Chem. Soc. 1998, 19, 934.
274.Griffiths, J.M.; Bell, A.T.; Reimer, J.A. J. Phys. Chem. 1994, 98, 1918.
275.Griffiths, J.M.; Bell, A.T.; Reimer, J.A. J. Phys. Chem. 1993, 97, 9161.
276.Subramanian, S.; Schwarz, J.A. Appl. Catal. 1991, 68, 131.
277.Defosse´, C. Characterization of Heterogeneous Catalysts; Delannay, F., Ed.; Marcel Dekker: New York, 1984; 225–298.
278.Querini, C.A.; Fung, S.C. Catal. Today 1997, 37, 277.
279.Jess, A.; Hein, O.; Kern, C. Catalyst Deactivation 1999; Delmon, B., Froment, G.F., Eds., Elsevier: Amsterdam, 1999; 81–88.
280.Boudart, M.; de Me´norval, L.-C.; Fraissard, J.P.; Valenc¸a, G.P. J. Phys. Chem. 1988, 92, 4033.
281.Powell, C.J.; Erickson, N.E.; Madey, T.E. J. Electron. Spectrosc. Relat. Phenom. 1979, 17, 361.
282.Dianis, W.P.; Lester, J.E. Anal. Chem. 1973, 45, 1416.
283.Contour, J.P.; Mouvier, G. J. Electron. Spectrosc. Relat. Phenom. 1975, 7, 85.
284.Ogilvie, J.L.; Wolberg, A. Appl. Spectrosc. 1972, 26, 401.
285.Madey, T.E.; Wagner, C.D.; Joshi, A. J. Electron Spectrosc. Relat. Phenom. 1977, 10, 359.
286.Hoflund, G.B.; Asbury, D.A.; Corallo, C.F.; Corallo, G.R. J. Vac. Sci. Technol. 1988, A6, 70.
287.Asbury, D.A.; Hoflund, G.B. Surf. Sci. 1988, 199, 552.
288.Dwyer, D.J.; Robbins, J.L.; Cameron, S.D.; Dudash, N.; Hardenbergh, J. Strong Metal–Support Interactions; Baker, R.T.K., Tauster, S.J., Dumesic, J.A., Eds.; American Chemical Society: Washington, DC, 1986; 21–33.
289.Dwyer, D.J.; Cameron, S.D.; Gland, J. Surf. Sci. 1985, 159, 430.
Characterization of Naphtha-Reforming Catalysts |
271 |
290.Ewertowski, F.; Klimas, J.; Maj, A. Rocz. Chem. 1975, 49, 351.
291.Klimas, J.; Ewertowski, F. Pol. J. Chem. 1980, 54, 867.
292.Pliskin, W.A.; Eischens, R.P. Z. Phys. Chem. (Frankfurt) NF, 1960, 24, 11.
293.Barth, R.; Pitchai, R.; Anderson, R.L.; Verykios, X.E. J. Catal. 1989, 116, 61.
294.Lantz, J.B.; Gonzalez, R.D. J. Catal. 1976, 41, 293.
295.Sen, B.; Vannice, M.A. J. Catal. 1991, 130, 9.
296.Johnson, M.F.L.; LeRoy, V.M. J. Catal. 1974, 35, 434.
297.Webb, A. J. Catal. 1975, 39, 485.
298.Johnson, M.F.L. J. Catal. 1975, 39, 487.
299.McNicol, B.D. J. Catal. 1977, 46, 428.
300.Bolivar, C.; Charcosset, H.; Frety, R.; Primet, M.; Tournayan, L.; Betizeau, C.; Leclercq, G.; Maurel, R. J. Catal. 1975, 39, 249.
301.Yao, H.C.; Shelef, M. J. Catal. 1976, 44, 392.
302.Wagstaff, N.; Prins, R. J. Catal. 1979, 59, 434.
303.Isaacs, B.H.; Petersen, E.E. J. Catal. 1982, 77, 43.
304.Mieville, R.L. J. Catal. 1984, 87, 437.
305.Ambs, W.F.; Mitchell, M.M. J. Catal. 1983, 82, 226.
306.Menon, P.G.; Sieders, J.; Streefkerk, F.J.; van Keulen, G.J.M. J. Catal. 1973, 29, 188.
307.Eskinazi, V. Appl. Catal. 1982, 4, 37.
308.Kirlin, P.S.; Strohmeier, B.R.; Gates, B.C. J. Catal. 1986, 98, 308.
309.Adkins, S.R.; Davis, B.H. ACS Symp. Series, 1985, 228, 57.
310.Nacheff, M.S.; Kraus, L.S.; Ichikawa, M.; Hoffman, B.M.; Butt, J.B.; Sachtler, W.M.H. J. Catal. 1987, 106, 263.
311.Onuferko, J.H.; Short, D.R.; Kelley, M.J. Appl. Surf. Sci. 1984, 19, 227.
312.Short, D.R.; Khalik, S.M.; Katzer, J.R.; Kelley, M.J. J. Catal. 1981, 72, 288.
313.Kelley, M.J.; Freed, R.L.; Swartzfager, D.G. J. Catal. 1982, 78, 445.
314.Meitzner, G.; Via, G.H.; Lytle, F.W.; Sinfelt, J.H. J. Chem. Phys. 1987, 87, 6354.
315.Bazin, D.; Dexpert, H.; Lagarde, P.; Bournonville, J.P. J. Physique, 1986, 47, C8-293.
316.Hilbrig, F.; Michel, C.; Haller, G.L. J. Phys. Chem. 1992, 96, 9893.
317.Vuurman, M.A.; Stufkens, D.J.; Oskam, A.; Wachs, I.E. J. Mol. Catal. 1992, 76, 263.
318.Nan-Yu Tøpsoe, J. Catal. 1991, 128, 499.
319.Turek, A.M.; Decanio, E.; Wachs, I.E. J. Phys. Chem. 1992, 96, 5000.
320.Sibeijn, M.; Spronk, R.; van Veen, J.A.R.; Mol, J.C. Catal. Lett. 1991, 8, 201.
321.Hardcastle, F.D.; Wachs, I.E.; Horsley, J.A.; Via, G.H. J. Mol. Catal. 1988, 46, 15.
322.Jothimurugesan, K.; Nayak, A.K.; Mehta, G.K.; Rai, K.N.; Bhatia, S.; Srivastava, R.D. AIChE J, 1985, 31, 1997.
323.Kelley, M.J.; Short, D.R.; Swartzfanger, D.G. J. Mol. Catal. 1983, 20, 235.
324.Prestvik, R.; Tøtdal, B.; Lyman, C.E.; Holmen, A. J. Catal. 1998, 176, 246–252.
325.Rønning, M.; Gjervan, T.; Prestvik, R.; Nicholson, D.G.; Holmen, A. J. Catal. 2001, 204, 292–304.
326.Bensaddik, A.; Caballero, A.; Bazin, D.; Dexpert, H.; Didillon, B.; Lynch, J. Appl. Catal. A: Gen. 1997, 162, 171–180.
272 |
Davis and Antos |
327.Biloen, P.; Helle, J.N.; Berbeck, H.; Dautzenberg, F.M.; Sachtler, W.M.H. J. Catal. 1980, 63, 112.
328.Sachtler, W.M.H. J. Mol. Catal. 1984, 25, 1.
329.Burch, R. Platinum Metals Rev. 1978, 22, 57.
330.Sexton, B.A.; Hughes, A.E.; Folger, K. J. Catal. 1984, 88, 1566.
331.Lieske, H.; Vo¨lter, J. J. Catal. 1984, 90, 46.
332.Burch, R. J. Catal. 1981, 71, 348.
333.Burch, R.; Garla, L.C. J. Catal. 1981, 71, 360.
334.Burch, R.; Mitchell, A.J. Appl. Catal. 1981, 6, 121.
335.Mu¨ller, A.C.; Engelhard, P.A.; Weisang, J.E. J. Catal. 1979, 56, 65.
336.Adkins, S.R.; Davis, B.H. J. Catal. 1984, 89, 371.
337.Stencel, J.M.; Goodman, J.; Davis, B.H. Proc. 9th Int. Congr. Catal. 1988, 3, 1291.
338.Li, Y.-X.; Stencel, J.M.; Davis, B.H. Reaction Kin. Catal. Lett. 1988, 37, 273.
339.Li, Y.-X.; Stencel, J.M.; Davis, B.H. Appl. Catal. 1990, 64, 71.
340.Bouwman, R.; Biloen, P. Surf. Sci. 1974, 41, 348.
341.Hoflund, G.B.; Asbury, D.A.; Kirszenzatejn, P.; Laitinen, H.A. Surf. Interf. Anal. 1986, 9, 169.
342.Hoflund, G. Preparation of Catalysts III; Poncelet, G., Grange, P., Jocobs, P.A., Eds.; Elsevier: Amsterdam, 1983; 91–100.
343.Gardner, S.D.; Hoflund, G.B.; Schryer, D.R. J. Catal. 1989, 119, 179.
344.Cox, D.F.; Hoflund, G.B. Surf. Sci. 1985, 151, 202.
345.Gardner, S.D.; Hoflund, G.B.; Schryer, D.R.; Upchurch, B.T. J. Phys. Chem. 1991, 95, 835.
346.Laitinen, H.A.; Waggoner, J.R.; Chan, C.Y.; Kirszensztejn, P.; Asbury, D.A.; Hoflund, G.B. J. Electrochem. Soc. 1986, 133, 1586.
347.Hoflund, G.B.; Asbury, D.A.; Gilbert, R.E. Thin Solid Films, 1985, 129, 139.
348.Bacaud, R.; Bussiere, P.; Figueras, F. J. Catal. 1981, 69, 399.
349.Berndt, V.H.; Mehner, H.; Vo¨lter, J.; Meise, W. Z. Anorg. Allg. Chem. 1977, 429, 47.
350.Bacaud, R.; Bussiere, P.; Figueras, F.; Mathieu, J.P. C.R. Acad. Sci. Paris Ser. C 1975, 281, 159.
351.Bacaud, R.; Bussiere, P.; Figueras, F. J. Phys. Colloq. 1979, 40, C2-94.
352.Charlton, J.S.; Cordey-Hayes, M.; Harris, I.R. J. Less-Common Met. 1970, 20, 105.
353.Li, Y.-X.; Zhang, Y.-F.-; Klabunde, K.J. Langmuir 1988, 4, 385.
354.Klabunde, K.J.; Li, Y.-X.; Purcell, K.F. Hyperfine Interact. 1988, 41, 649.
355.Lin, L.; Wu, R.; Zang, J.; Jiang, B. Acta Pertrol Sci. (China) 1980, 1, 73.
356.Pakhomov, N.A.; Buyanov, R.A.; Yurchenko, E.N.; Cherynshev, A.P.; Kotel’nikov, G.R.; Moroz, E.M.; Zaitseva, N.A.; Patanov, V.A. Kinet. Katal. 1981, 22, 488.
357.Gray, P.R.; Farha, F.E. Mo¨ssbauer Effect Methodology; Grunerman, I.J., Seidel, Eds.; Plenum: New York, 1976; Vol. 10, p. 47.
358.Yurchenko, E.N.; Kuznetsov, V.I.; Melnikova, V.P.; Startsev, A.N. React. Kinet. Catal. Lett. 1983, 23, 137.
359.Zhang, P.; Shao, H.; Yang, X.; Pang, L. Cuihua Xuebao 1984, 5, 101.
360.Li, Y.-X.; Zhang, Y.-F.; Shai, Y.-F. Cuihua Xuebao, 1985, 5, 311.
Characterization of Naphtha-Reforming Catalysts |
273 |
361.Zhang, S.; Xie, B.; Wang, P.; Zhang, J. Cuihua Xuebao, 1980, 1, 311.
362.Li, Y.-X.; Klabunde, K.J.; Davis, B.H. J. Catal. 1991, 128, 1.
363.Kuznetsov, V.I.; Belyi, A.S.; Yurchenko, E.N.; Smolikov, M.D.; Protasova, M.T.; Zatolokina, E.V.; Duplyakin, V.K. J. Catal. 1986, 99, 159.
364.Srinivasan, R.; Davis, B.H. Platinum Metal Rev. 1992, 36, 151.
365.Srinivasan, R.; De Angelis, R.J.; Davis, B.H. J. Catal. 1987, 106, 449.
366.Li, Y.-X.; Chiu, N.-S.; Lee, W.-H.; Bauer, S.H.; Davis, B.H. Charaterization and catalyst development. An interactive approach. ACS Symp. Series, 1989, 411, 328.
367.Chiu, N.-S.; Lee, W.-H.; Li, Y.-X.; Bauer, S.H.; Davis, B.H. Advances in Hydrotreating Catalysts; Occelli, M.L., Anthony, R.G., Eds.; Elsevier Sci. Pub: Amsterdam, 1989; 147–163.
368.Meitzner, G.; Via, G.H.; Lytle, F.W.; Fung, S.C.; Sinfelt, J.H. J. Phys. Chem. 1988, 92, 2925.
369.Srinivasan, R.; Davis, B.H. Appl. Catal. (A General), 1992, 87, 45.
370.Le Peltier, F.; Didillon, B.; Jumar, J.-C.; Olivier-Fourcade, J. Eur. Pat. Appl. EP 1181978 A1, (2002).
371.Macleod, N.; Fryer, J.R.; Stirling, D.; Webb, G. Catal. Today 1998, 46, 37–54.
372.Srinivasan, R.; Sparks, D.; Davis, B.H. J. Mol. Catal. 1994, 88, 325.
373.Srinivasan, R.; Davis, B.H. J. Mol. Catal. 1994, 88, 343.
374.Srinivasan, R.; Sparks, D.; Davis, B.H. J. Mol. Catal. 1994, 88, 359.
375.Sinfelt, J.H. Bimetallic Catalysts. Discoveries, Concepts, and Applications; John Wiley & Sons: New York, 1983.
376.Chan, S.C.; Fung, S.C.; Sinfelt, J.H. J. Catal. 1988, 113, 164.
377.Subramanian, S.; Schwarz, J.A. Appl. Catal. 1991, 68, 131.
378.Huang, J.-J.; Fung, S.C.; Gates, W.E.; McVicker, G.B. J. Catal. 1989, 118, 192.
379.Subramanian, S.; Schwarz, J.A. Appl. Catal. 1990, 61, L15.
380.Huang, Y.-J.; Fung, S.C. J. Catal. 1991, 131, 378.
381.McVicker, G.B.; Ziemiak, J.J. Appl. Catal. 1985, 14, 229.
382.von Brandis, H.; Wagner, F.E.; Sawicki, J.A.; Marcinkowska, K.; Rolston, J.H. Hyperfine Interact. 1990, 57, 2127.
383.Sinfelt, J.H.; Via, G.H.; Lytle, F.W. J. Chem. Phys. 1982, 76, 2779.
384.Romero, T.; Arenas, B.; Perozo, E.; Bolı´var, C.; Bravo, G.; Marcano, P.; Scott, C.; Pe´rez Zurita, M.J.; Goldwasser, J. J. Catal. La Plata, Argentina, 1990, 124, 281.
385.Romero, T.; Tejeda, J.; Jaunay, D.; Bolı´var, C.; Charcoset, H. Proceedings of the VIIth Iberoamerican Congress in Catalysis; La Plata: Argentina, 1980; p. 453.
386.Goldwasser, J.; Arenas, B.; Bolı´var, C.; Castro, G.; Rodriguez, A.; Fleitas, A.; Giron, J. J. Catal. 1986, 100, 75.
387.Bouwman, R.; Biloen, P. J. Catal. 1977, 48, 209.
388.de Miguel, S.R.; Scelza, O.A.; Castro, A.A. Appl. Catal. 1988, 44, 23.
389.de Miguel, S.R.; Martinez Correa, J.A.; Baronetti, G.T.; Castro, A.A.; Scelza, O.A. Appl. Catal. 1990, 60, 47.
390.Vo¨lter, J.; Lieske, H.; Lietz, G. React. Kinet. Catal. Lett. 1981, 16, 87.
391.Palizov, A.; Bonev, Kh.; Kadinov, G.; Shopov, D.; Lietz, G.; Vo¨lter, J. J. Catal.
1981, 71, 1.
392.Lieske, H.; Vo¨lter, J. React. Kinet. Catal. Lett. 1983, 23, 403.
274 |
Davis and Antos |
393.Bernard, J.R. Proc. Fifth Int. Conf. Zeolites, Heyden: London, 1980; p. 686.
394.Besoukhanova, C.; Guidot, J.; Barthomeuf, D. J. Chem. Soc. Faraday Trans. I, 1981, 77, 1595.
395.Hughes, T.R.; Buss, W.C.; Tamm, P.W.; Jacobson, R.L. New Developments in Zeolite Science and Technology; Murakami, Y., Iijima, A., Ward, J.W., Eds.; Elsevier: Amsterdam, 1986; 725–732 and discussion 120–126.
396.Ward, J.W. J. Catal. 1968, 10, 34; Zeolite Chemistry and Catalysis; Rabo, J.A., Ed.; 1976; ACS Monograph Series, Vol. 171, 229–234.
397.Newell, P.A.; Rees, L.V.C. Zeolites, 1983, 3, 22, 28.
398.Anderson, J.R. Structure of Metallic Catalysts; Academic Press: New York, 1975.
399.Rice, S.B.; Koo, J.Y.; Disko, M.M.; Treacy, M.M.J. Ultramicroscopy 1990, 34, 108.
400.Miller, J.T.; Sajkowski, D.J.; Modica, F.S.; Lane, G.S.; Gates, B.C.; Vaarkamp, M.; Grondelle, J.V.; Koningsberger, D.C. Catal. Lett. 1990, 6, 369.
401.van Zon, J.B.A.D.; Koningsberger, D.C.; van’t Blik, H.F.J.; Sayers, D.E. J. Chem. Phys. 1985, 83, 5742.
402.Larsen, G.; Haller, G.L. Catal. Today 1992, 15, 431.
403.McVicker, G.B.; Kao, J.L.; Ziemiak, J.J.; Gates, W.E.; Robbins, J.L.; Treacy, M.M.J.; Rice, S.B.; Vanderspurt, T.H.; Cross, V.R.; Ghosh, A.K. J. Catal. 1993, 139, 48.
404.Iglesia, E.; Baumgartner, J.E. 10th Int. Congr. Catal. Budapest, 1992; paper 0-65.
405.Vaarkamp, M.; Miller, J.T.; Modica, F.S.; Lane, G.S.; Koningsberger, D.C. J. Catal. 1992, 138, 675.
406.Tatsumi, T.; Dai, L.-X.; Sakashita, H.; Catal. Lett. 1994, 27, 289–295.
407.Jacobs, G.; Ghadiali, F.; Pisanu, A.; Padro, C.L.; Borgna, A.; Alvarez, W.E.; Resasco, D.E. J. Catal. 2000, 191, 116–127.
408.Jongpatiwut, S.; Sackamduang, P.; Rirksomboon, T.; Osuwan, S.; Alvarez, W.E.; Resasco, D.E. Appl. Catal. A: Gen. 2002, 230, 177–193.
409.Watwe, R.M.; Spiewak, B.E.; Cortright, R.D.; Dumesic, J.A. Catal. Lett. 1998, 51, 139–147.
410.Sharma, S.B.; Laska, T.E.; Balaraman, P.; Root, T.W.; Dumesic, J.A. J. Catal. 1994, 150, 225–233.
411.Hunger, M.; Weitkamp, J. Angew. Chem. Int. Ed. 2001, 40, 2954–2971.
412.Shido, T.; Prins, R. Curr. Opin. Solid State Mater. Sci. 1998, 3, 330–335.
413. Le Normand, F.; Borgna, A.; Garetto, T.F.; Apesteguia, C.R.; Moraweck, B.
J. Phys. Chem. 1996, 100, 9068–9076.
414.Somorjai, G.A. Appl. Surf. Sci. 1997, 121/122, 1–19.
415.Knop-Gericke, A.; Ha¨vecker, M.; Schedl-Niedrig, Th.; Schlo¨gl, R. Top. Catal. 2000, 10, 187–198.
416.Mojet, B.L.; Miller, J.T.; Ramaker, D.E.; Koningsberger, D.C. J. Catal. 1999, 186, 373–386.
417.Zaera, F. Appl. Catal. A: Gen. 2002, 229, 75–91.