

7
Optimization of Catalyst Pore Structure by Kinetics and Diffusion Analysis
Jerzy Szczygieł
Wrocław University of Technology
Wrocław, Poland
1INTRODUCTION
The design of the catalyst is of paramount importance to the economics of catalytic processes,[1 – 5] and the choice of an optimal porous structure is an inherent part not only of catalyst design but also of catalyst selection for the intended technological process. In the assessment of industrial catalysts it is essential to relate catalytic activity on a unit volume basis. This volume-related activity depends on a variety of factors, such as the specific activity of the catalyst relative to the developed surface area, the amount of the surface area in the unit catalyst volume, and the porous structure of the catalyst. The porosity is responsible for the transport of reacting substances and heat in the grains. All these parameters are determined by the conditions of catalyst preparation and the nature of the material.[6,7] A high specific activity can be achieved by controlling the chemical composition of the catalyst under design.[8] However, it is worth remembering that the more active the catalyst, the more difficult becomes the utilization of the catalytic potential because fast reactions induce resistances concomitant with the transport of reagents. It is therefore essential for the designer of a new catalyst to define a priori the required internal surface and the most advantageous pore structure for the intended reaction so as to provide free access of the reacting substances to the surface of the catalyst pores.
The optimal parameters of the pore structure depend on the specific activity of the catalysts, on the kinetics of the process, on the reactant nature, and on the
275
276 |
Szczygieł |
technological conditions. Where elementary reactions are concerned, the (qualitative) effect of catalyst activity on the choice of the optimal structure is quite clear. Thiele[9] was first to construct a mathematical model that incorporated the effect of diffusion on the rate of a chemical reaction. With such a model in hand it was possible to assess the influence of mass transport in the catalyst pores on the progress of the reaction. Although Thiele’s model involved mass transport equations for ideal geometrical grains, it approximated real phenomena with good adequacy. The Thiele model may also be of use in estimating how the parameters of the catalyst’s porous structure affect the reaction rate.[10] In the absence of diffusion resistance, the rate of the reaction is proportional to the surface developed within the catalyst and does not depend on the pore volume. In the presence of molecular diffusion, reaction rate increases linearly with the square root of the surface area and pore volume developed in the catalyst. Under conditions of Knudsen diffusion, reaction rate does not depend on the catalyst surface but is proportional to the pore volume.
Analysis of the pore structure effect, as well as the choice of an optimal porous structure, raises problems whenever a catalytic process involves many reactions—both simultaneous and consecutive. In that particular case the influence of the porous structure on the efficiency of the catalytic process increases with the increasing difference in rate between individual reactions. Faster reactions are limited by diffusion; slower reactions run in the kinetic region. The effect of diffusional limitation on the total rate and selectivity of the composite reaction depends on the structure of these complex changes.[5] Thus, the optimal parameters of the porous structure for a catalyst of a defined chemical composition should be selected separately, according to the desired kinetic scheme and process conditions, by analyzing the mass transfer and heat transfer phenomena that occur in the catalyst grain. The optimal pore structure is determined by the transfer processes in the grain, as well as by the kinetics of the reactions participating in the process.
The objective of catalytic reforming is to produce high-octane gasoline by increasing the content of aromatic compounds and isoparaffins in an organic material starting with predominantly n-paraffins and naphthenes. The kinetics of the process and the reactions involved, as described by Froment and coworkers,[11 – 15] are sophisticated. In the course of the process, paraffins are dehydrocyclicized to naphthenes, which in turn convert to aromatic compounds, whereas n-paraffins isomerize to form isoparaffins. The undesired reactions of hydrocracking convert some part of the product into light paraffins. There is a substantial difference in the rate between particular reactions. Thus, the hydrogenation of naphthenes to aromatic hydrocarbons operates at a rate that is two orders of magnitude faster than the rate with which paraffins are dehydrocyclicized to naphthenes. Hence, under the same process conditions, slower reactions may run in the kinetic region whereas faster reactions may be
Catalyst Pore Structure |
277 |
constrained by diffusion resistance, thus slowing down the rate of the process. Control of transport phenomena via a careful choice of the pore structure can disclose further catalytic potential and upgrade the performance of the catalyst. Recent developments in computer techniques have enhanced preferences for mathematical methods when analyzing the effect of the porous structure on the performance of the catalyst. Such an approach requires assumptions for the physical model of the catalyst grain, description of the porous structure, as well as assumptions for the mathematical description of transport phenomena and reactions in the grain model.
1.1Models of Porous Structures
Mass transfer and chemical reactions in the catalyst are interrelated. To gain a better understanding of this interrelationship it is advisable to model the porous structure of the catalyst support and to quantify the effective diffusion coefficients. Real porous structures are complex in nature. They form an irregular network of channels, which range in size from micropores (with much smaller radii than the mean free paths of the diffusing components) to macropores (of micrometer dimensions). The pores are randomly interconnected. In chemical reaction engineering use is made of a variety of models that provide a simple description of such a structure. Specialized literature contains many references to the porous structures of a variety of catalysts—from monodispersive,[16] through bidispersive,[17 – 19] to models including a wide range of pore distributions.[20]
A chronological review of such models (from the simple Wheeler model to the models developed in the 1990s) can be found elsewhere.[21,22] Thus, the model
developed by Wheeler[23] suffices for the approximation of a monodispersive catalyst,[24] but it fails to describe the topology of the space produced by the pores of a real catalyst. What is more, the coefficient of tortuosity, t (with a value ranging from 2 to 7), includes too much information and smoothes over the discrepancy between a real porous structure and the one described by the model. The random model constructed by Wakao and Smith[17] allows a description of bidispersive systems; it incorporates Knudsen diffusion and molecular diffusion for narrow pores and wide pores, respectively. The parallel cross-linked pore model established by Steward[25] includes a wide range of pore size distribution, and the calculated effective diffusion coefficient values differ only slightly from those determined experimentally.[26]
In the past few years preference has been given to such models that incorporate not only porosity and pore volume distribution as a function of pore radii, but also pore length distribution and a parameter describing the method of pore interconnection.[27] For the purpose of simplification, all of the models mentioned above make use of the assumption that the pores are cylindrical in shape. Quite recently, a number of publications[28 – 32] have directed attention to
278 |
Szczygieł |
the more likely shapes of the pores described by fractal models. In their description of the catalytic reforming process, Coppens and coworkers[31 – 33] demonstrate how the fractal roughness of the catalyst pore walls affects the yields and distribution of industrial processes.
An earlier study of ours[34] described a “globular model,” which was tested for the support of an Al2O3-reforming catalyst. Using this model, the variation of the pore volume can be related to a wide range of variations in the pore radii. The model[34] is based on the assumptions of the Wakao–Smith model,[17] but it contains one more parameter—a variable number of contacts of the molecule with
its “neighbors”—which extends the application of the model to the description of a more complex porous structure. The bidispersive “layered model”[19,35] was
used to optimize the porous structure of the reforming catalyst, and the values proposed for the parameters of the porous structure were confirmed by experiments.[41] In a previous study,[71] the same catalyst grain model was used to analyze the problem of how the kinetics of the reforming process affects the choice of an optimal porous structure. These models of pore networks apply to a
variety of situations—to the prediction of effective diffusion coefficients,[37] to the simulation of diffusion and reactions in the catalyst pores,[19,35,38,39,71] and to
the interpretation of experimental results and measured diffusion values.[40]
1.2Optimization of Porous Structure Reported in Literature
Optimizing the porous structure can be viewed as an increase in the potentiality of
upgrading the efficiency of the catalyst unit volume. The porous structure of the catalyst can be optimized using more or less sophisticated models.[19,27,33,42 – 46]
The mathematical methods made use of in such analyses are of particular importance when the interactions of the complex kinetics of the process, diffusion, and porous structure make it difficult to experimentally assess the optimal values for the parameters of the grain pore structure.
Apart from porosity and mean pore radius, the following parameters are to be considered: pore radii distribution, pore length distribution, pore shape, and pore interconnection. At this stage of catalyst design, it is also essential to choose the right shape and size of the catalyst grains so as to match them with the optimal
porous structure.
Boreskov[47] seems to have been first to express the need of determining an optimal porous structure, and he specified some general principles for choosing it. The parameters of an optimal porous structure differ according to the adopted objective that is to be achieved. Thus, if the primary objective is to maximize the process rate, then—for a simple reaction and a low-activity catalyst—it is advisable to use a monodispersive catalyst with a developed internal surface. When the catalyst displays a high activity, the application of bidispersive catalysts will be better suited because (apart from the narrow pores that develop
Catalyst Pore Structure |
279 |
the catalyst surface) they include a certain portion of wide (transport) pores.[47] The transport pores facilitate access of the raw material to the surface developed by the narrow pores, thus enabling complete utilization of the internal surface.
Dyrin and coworkers[48] corroborated the above-mentioned recommendations. Beskov and coworkers also focused on the optimization of the porous structure.[49,50]
Their recommendations pertaining to the choice of the optimal porous structure for a catalyst were based on the analysis of mass transport phenomena inside the grain, and their results were made use of by relevant industries. In their studies, Beskov and coworkers aimed at determining the interaction between the optimal porous structure, grain size, and process parameters.
Owing to the developments in computational techniques, the porous structure can be optimized using a variety of more sophisticated models. Detailed accounts of
these models and of relevant optimizing techniques were reported by a number of investigators.[1,22,51 – 53] Delancey[43] made use of a simple diffusion model to
analyze a single, reversible, first-order reaction and proposed an optimal density for a catalyst of a defined composition, an optimal composition for a catalyst of a defined density, as well as an optimal composition and an optimal density. Hegedus[44] applied a random model proposed by Wakao and Smith[17] to the optimization of the porous structure for an automotive catalyst and pointed to a variety of advantages when using a catalyst of an optimal porous structure. Pereira and coworkers[45] used a mathematical model for the design and simulation of a monolithic automotive catalyst. The model, as well as the optimizing procedure, made it possible to predict the optimal values for a variety of factors (washcoat thickness, porous structure, channel size, and wall thickness) needed by the designer of the catalyst to minimize diffusion in the presence of poisons. In the majority of complex processes involving simultaneous and consecutive reactions, an optimal structure must be able to deliver maximal quantities of the defined final product.
Keil and Rieckman optimized the porous structure of a catalyst for the complex hydrodemetallation of crude oil (HDM process) by making use of various
theoretical models—the macro-micropore model[46] and the three-dimensional network of interconnected cylindrical pores.[27,55] The porous structure models and
the mathematical methods of analysis were found to be a useful tool in determining the optimal parameters for this structure because the interaction between kinetics, diffusion, and geometrical pore structure is too complicated to allow intuitive methods for parameter determination. The methods are useful in optimizing the porous structure for a variety of complex processes.
2SCOPE OF CHAPTER
In this chapter, we present an algorithm with which one can optimize the porous structure of the reforming catalyst. The algorithm consists of three major steps: analysis
280 |
Szczygieł |
of kinetic phenomena in the catalyst grain (Section 3); analysis of diffusion phenomena in the catalyst grain (Section 4), and construction of a mathematical model that makes it possible to optimize the parameter values for the porous structure of the reforming catalyst grain (Section 5). For convenience, the experimental verification of the results obtained with the algorithm has been itemized as Section 6.
In Section 3, the paraffin reaction paths and the kinetic scheme are determined on the basis of experiments in a flow-through reactor and in the presence of a catalyst. Then the relevant mathematical equations describing the time-related changes in substrate concentrations are derived. The proposed kinetic model of the process and the calculated reaction rate constants can be used in further analysis of the model constructed for optimizing the catalyst pore structure.
In Section 4, the attempt is made to assess the effective coefficients of diffusion for the group components of a reforming mixture. The group components originate in the interior of the catalyst grain. The proposed equation makes it possible to calculate the numerical values of these coefficients as a function of the parameters of the porous structure. On the basis of experimental data, a method is suggested for determining the efficiency of grain utilization.
In Section 5, the objective is to construct a mathematical model for optimizing the porous structure of the reforming catalyst. Using a layered model of the catalyst grain and the kinetic scheme adopted for the process, equations are derived to describe the mass transfer in the catalyst grain under conditions of reforming. Particular consideration is given to the problem of how the parameters of the porous structure affect the efficiency of the process.
Finally, in Section 6, the effect exerted by the porous structure of the reforming catalyst on its activity in the reaction of n-heptane dehydrocyclization is determined experimentally, using statistical analysis for the interpretation of the results. Also determined is the minimal radius of pores functioning at the two different temperatures. The results substantiate those obtained by theoretical analysis.
Each of the four steps constitutes an entity with a defined objective and scope, with a description of the mathematical tools, an algorithm, the analysis of results, and partial conclusions. In each of the three major steps, analysis is carried out at two levels—a statistical level and a level involving thorough physicochemical analysis of the investigated phenomena. The statistical approach, which aims at smoothing the experimental results, is helpful in constructing the hypothetical course of the phenomena under study and in interpreting the results obtained. The other approach involves mathematical models that provide a thorough description of the phenomena occurring in the adopted physical models of the catalyst grain. The two approaches are complementary, thus enabling a more detailed analysis of the phenomena examined.
The full range of the tasks performed when optimizing the porous structure of the reforming catalyst, as well as the relations among particular steps, is included in Figure 1, which is a block diagram of the algorithm displaying the

Catalyst Pore Structure |
281 |
Figure 1 Optimization of porous structure for a reforming catalyst.
accomplishment of the main goal: optimization of the porous structure of the reforming catalyst. As shown by this diagram, analysis of the kinetics on the developed grain surface, along with the analysis of diffusion phenomena inside the catalyst grain, is a prerequisite to generate the input data—reaction rate constants and diffusion coefficients—for the mathematical model, which was built with the aim of optimizing the porous structure.
3KINETICS AND REACTION PATHS FOR REFORMING
3.1Previous Kinetic Modeling
Catalytic reforming is a well-known source of high-octane gasoline and aromatic hydrocarbons.[4,56,57] An in-depth review of the process and many related aspects
282 |
Szczygieł |
can be found in the first edition of this book.[3] In order to extend these earlier studies so as to predict the composition and the properties of the product, or to
optimize the pore structure of the reforming catalyst, it is advisable to describe the process mathematically in terms of a kinetic model.[39,58,76] The model
comprises a set of differential equations with rate constants that describe the rate of each reaction involved in the process. Using the model, one may compute the composition of the reaction mixture at any point in time, provided that the initial reaction conditions are given. However, extrapolation to the multicomponent feed in a commercial-scale reforming process may raise serious problems. Joffe,[65] Szczygieł,[36] and Rabinovilsch and coworkers[66] investigated the kinetics of reforming by making use of individual hydrocarbons as raw materials, which were then converted by reforming. Ancheyta-Juarez and Villafuerte-Macias[54] proposed a kinetic model of reforming, which includes 71 reactions. The investigators took into account the reactions of hydrocarbons C1 –C11, including isomerization of methylcyclopentane to cyclohexane. Values of the rate constants for the catalytic reaction of individual hydrocarbons over platinum[59] allow comparison of the relative rate constants for particular reactions.
The conventional approach to investigate the kinetics of multicomponent reactions is to employ a kinetic scheme that includes the smallest possible number of reactants. Smith[60] assumed that the multicomponent raw material that was to be reformed consisted of three group reagents—paraffins, naphthenes, and aromatic hydrocarbons. However, such an assumption leads to undesirable simplifications in the kinetic model, yielding pseudo–rate constants for pseudoreactions Dorozhov[61] tried to imnrove the kinetic scheme by including additional reagents (e.g., by making a distinction between paraffins C5 –C6 and paraffins C7). The results were not very promising in that the description of the
process was only slightly better but the model itself was more complicated. Zhorov[62,63] incorporated a relationship between the reaction rate constants and
the composition of the reagent groupings. Kmak and Stuckey[64] simulated the Powerforming process within a wide parameter range, using data from single components, mixtures of pure components, and a naphtha fraction. This model attempted to describe the performance of a pilot unit over a wide spectrum of operating parameters and starting materials, and to determine the concentration profiles of 22 components in four reactors in series while targeting octane number
upgrade.
Ramage et al.[67,68] developed a comprehensive kinetic model, which attempted to capture the reactivity differences between particular raw materials and to modify the process kinetics by incorporating deactivation of the catalyst due to coke formation. The reaction network proposed by Ramage and coworkers was based on kinetic studies of pure components and narrow-boiling fractions of naphthas. The studies led to the construction of the Mobil Kinetic Model of the Reforming Process (KINPtR—“start-of-cycle” and “deactivation” kinetics).
Catalyst Pore Structure |
283 |
Interconversion between 13 kinetic lumps participating in the reactions of hydrocracking, hydrogenation–dehydrogenation, cyclization, and isomerization was predicted. Reactions of hydrocarbons with equal carbon atom number were assumed to be reversible, whereas those for which carbon content changed were regarded as irreversible. Joshi et al.[69] described the use of software (NetGen) that allows construction of a sophisticated model, simulation of the reforming process, and prediction of the results of the reforming process over a wide range of parameters for various feeds. Up to 79 components may participate in the process, and NetGen simulates up to 464 reactions. The program identifies the components and then selects potential reactions. A model of the process is generated that determines products and rates of change of each product, in good agreement with experimental data.
3.2Experiments and Methods
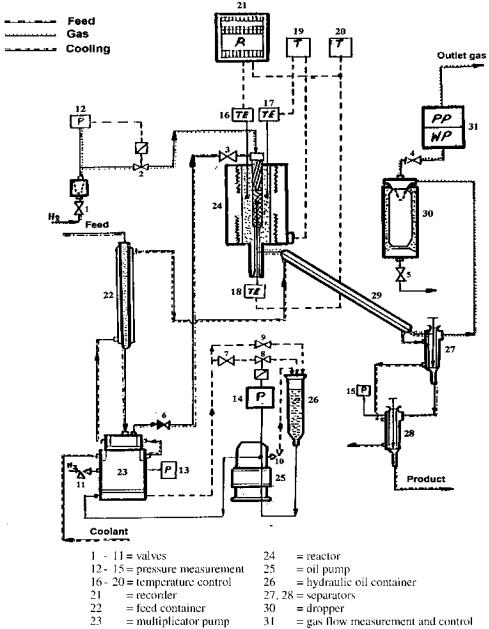
The experiments were carried out in a flow-through apparatus (a 3-cm3 volume microreactor of OL 115/09 type) (Fig. 2). In order to establish a reliable kinetic scheme of the reforming process, experiments were performed to examine the conversion for n-heptane, an n-heptane and methylcyclohexane mixture, and a naphtha fraction with varying reaction times (controlled by the space velocity of the feed) at set temperatures of 470, 490, and 5108C. In addition to following the changes in the feed species with time at different temperatures, this enabled us to trace the variations in diffusion concomitant with the variations in the composition of the reaction mixture, as well as to establish the effect of temperature on the values of the diffusion coefficients. All experiments were run at 1 MPa and an H2/raw material ratio of 10 : 1 over a Pt-Re catalyst of 0.15 mm grain size, which had been shown in previous experiments to ensure a kinetic limitation of the process rate. Chromatographic analysis was used. The results are listed in Table 1.
Two mathematical methods of analysis were employed: a statistical description of the process, where reforming (as a “black box”) was defined in terms of polynomial equations, and second by a description based on the material balance.[76] Both methods were complementary. Statistical description smoothed the experimental results and offered certain suggestions pertaining to the kinetic schemes proposed. The description involving the physicochemistry of reforming made it possible to verify these suggestions and to establish an appropriate kinetic scheme for a process carried out with a different feed component. The use of three feed materials allowed the determination of how the fractional composition of the starting compound affected the course of the process. The kinetic schemes
proposed (along with the rate constants and diffusion coefficient values calculated in[22,36]) can be used in optimizing the porous structure of the reforming catalyst by the method described in.[19,35,71] A detailed description of
the mathematical tools (along with the graphics generated by them) can be found
284 |
Szczygieł |
Figure 2 Experimental setup.[41]
elsewhere.[36,76] Statistical analysis of the results in Table 1 made it possible to generate the coefficients of polynomial equations (Table 2), to plot the isolines of the investigated output quantities in the reaction temperature–reaction time coordinate system, and to assess unequivocally the effect of these parameters on the course of the process. Analysis of the graphics was helpful in establishing the hypothetical kinetic schemes of the process.[76]

Table 1 Result of Reforming Tests for Various Raw Materials
|
|
|
|
|
n-Heptane |
|
|
|
Heptane þ methylcyclohexane |
|
|
Naphtha fraction (60–1508C) |
||||||
Process |
|
|
|
|
|
|
|
|
|
|
|
|
|
|
|
|
|
|
|
|
|
|
|
|
|
|
|
|
|
|
|
|
|
|
|
|
|
parameters |
|
|
|
|
Yield (wt%) |
|
|
|
|
Yield (wt%) |
|
|
|
Yield (wt%) |
|
|||
|
|
|
|
|
|
|
|
|
|
|
|
|
|
|
|
|
|
|
Temp. |
S.vel. |
|
Conv. |
Gases |
Paraffins |
Naphthenes Aromatics |
|
Conv. |
Gases |
Paraffins |
Naphthenes Aromatics |
|
Gases |
Paraffins |
Naphthenes Aromatics |
|||
(8C) |
(h 1) |
(%) |
(%) |
|
||||||||||||||
|
|
|
|
|
|
|
|
|
|
|
|
|
||||||
|
|
|
|
|
|
|
|
|
|
|
|
|
|
|
|
|||
470 |
1 |
37.74 |
14.65 |
81.47 |
1.03 |
2.85 |
52.78 |
9.41 |
55.41 |
3.22 |
31.97 |
14.98 |
36.51 |
2.51 |
46.01 |
|||
470 |
2 |
29.44 |
14.21 |
82.82 |
1.27 |
1.72 |
46.96 |
8.21 |
58.99 |
2.18 |
30.62 |
10.01 |
40.25 |
2.94 |
46.81 |
|||
470 |
4 |
17.97 |
8.54 |
89.32 |
1.17 |
0.97 |
38.57 |
3.55 |
62.32 |
2.61 |
31.53 |
7.63 |
44.81 |
3.25 |
44.32 |
|||
470 |
8 |
11.86 |
6.61 |
92.11 |
0.72 |
0.56 |
32.98 |
2.48 |
62.78 |
5.68 |
29.07 |
4.31 |
48.62 |
3.45 |
43.63 |
|||
490 |
1 |
55.76 |
22.73 |
69.2 |
1.11 |
6.97 |
60.97 |
12.29 |
51.75 |
3.71 |
32.25 |
21.01 |
31.41 |
1.55 |
46.04 |
|||
490 |
2 |
41.31 |
17.43 |
77.4 |
1.23 |
3.95 |
56.24 |
11.99 |
53.31 |
3.11 |
31.61 |
14.71 |
35.39 |
1.98 |
47.92 |
|||
490 |
4 |
28.07 |
13.48 |
82.38 |
1.18 |
2.06 |
46.83 |
6.49 |
59.31 |
2.09 |
32.12 |
10.11 |
40.34 |
2.63 |
46.92 |
|||
490 |
8 |
16.63 |
6.82 |
90.66 |
1.19 |
1.33 |
37.21 |
2.75 |
63.94 |
2.49 |
30.83 |
6.54 |
44.22 |
3.19 |
46.05 |
|||
510 |
1 |
83.28 |
37.36 |
48.08 |
0.96 |
13.6 |
75.79 |
18.5 |
42.19 |
1.31 |
38.01 |
24.26 |
28.24 |
1.44 |
46.06 |
|||
510 |
2 |
55.66 |
25.23 |
63.45 |
1.17 |
8.61 |
66.7 |
14.6 |
49.5 |
1.71 |
34.19 |
18.95 |
32.63 |
1.78 |
46.64 |
|||
510 |
4 |
42.87 |
16.13 |
76.76 |
1.82 |
5.29 |
53.72 |
8.44 |
55.86 |
2.73 |
32.97 |
13.83 |
36.47 |
2.14 |
47.56 |
|||
510 |
8 |
24.41 |
10.7 |
86.64 |
0.16 |
2.5 |
44.12 |
4.41 |
60.52 |
2.23 |
32.85 |
10.16 |
40.51 |
2.91 |
46.42 |
|||
|
|
|
|
|
|
|
|
|
|
|
|
|
|
|
|
|
|
|
Structure Pore Catalyst
285
286
Table 2 Coefficient of Polynomial Equations
Coefficients
Raw material |
Y |
b0 |
b1 |
b2 |
b11 |
b12 |
b22 |
R |
FT |
Heptane and |
Conversion |
43.71 |
8.02 |
212.55 |
1.14 |
22.84 |
6.18 |
0.99 |
252.54 |
methylcyclohexane |
Gases |
5.48 |
2.44 |
25.32 |
0.32 |
21.63 |
2.79 |
0.99 |
59.77 |
|
Paraffins |
61.01 |
23.38 |
6.24 |
21.13 |
2.54 |
24.11 |
0.99 |
59.49 |
|
Naphthenes |
2.54 |
20.82 |
0.41 |
20.14 |
20.52 |
0.62 |
0.73 |
1.39 |
|
Aromatics |
30.98 |
1.77 |
21.33 |
0.95 |
20.39 |
0.69 |
0.91 |
4.93 |
|
Reformate |
89.93 |
22.63 |
7.36 |
23.58 |
21.53 |
24.41 |
0.95 |
10.07 |
Heptane |
Conversion |
23.32 |
12.21 |
219.61 |
2.46 |
26.79 |
12.51 |
0.99 |
46.28 |
|
Gases |
9.97 |
4.21 |
27.78 |
0.75 |
23.12 |
5.51 |
0.93 |
8.21 |
|
Paraffins |
87.21 |
26.74 |
10.92 |
21.55 |
5.19 |
27.48 |
0.96 |
12.97 |
|
Naphthenes |
1.47 |
20.03 |
20.17 |
20.14 |
20.11 |
20.51 |
0.75 |
1.56 |
|
Aromatics |
1.36 |
2.57 |
22.97 |
0.93 |
21.97 |
2.49 |
0.98 |
34.55 |
|
Reformate |
89.82 |
21.01 |
7.01 |
0.41 |
3.81 |
212.03 |
0.91 |
5.13 |
Naphtha fraction |
Gases |
11.92 |
5.02 |
27.71 |
22.18 |
21.02 |
4.78 |
0.99 |
61.16 |
(60–1508C) |
Paraffins |
37.41 |
25.17 |
6.15 |
0.67 |
0.84 |
22.49 |
0.99 |
76.72 |
|
Naphthenes |
2.19 |
20.41 |
0.81 |
0.08 |
20.19 |
20.21 |
0.99 |
51.71 |
|
Aromatics |
48.47 |
0.54 |
0.74 |
1.43 |
0.36 |
22.07 |
0.96 |
15.27 |
Source: Ref. [76].
Szczygieł
Catalyst Pore Structure |
287 |
3.3Discussion of Results
Heptane þ Methylcyclohexane
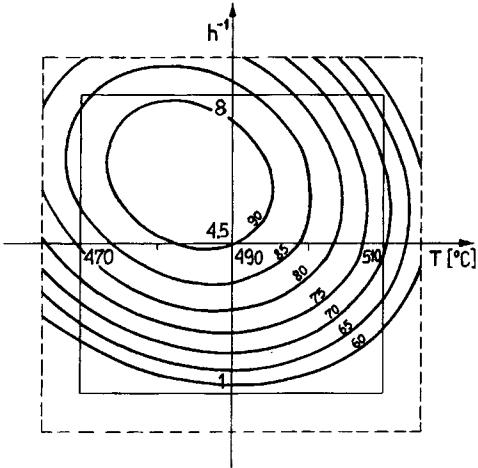
The weight ratio of heptane to methylcyclohexane in the mixture was 67 : 33. Aromatic hydrocarbons are produced primarily from methylcyclohexane after a short reaction time. Even under mild conditions (at 4708C and a reaction time of 8 h 1), a considerable portion of naphthenes (methylcyclohexane) undergoes dehydrogenation to aromatic hydrocarbons, while there is very poor dehydrocyclization of the paraffins (Table 1). The results evidence the wellknown findings that the dehydrogenation of naphthenes runs at a very fast rate, while the paraffins that are present in the starting material undergo conversion at a noticeably slower rate. They are extensively converted at higher temperatures and a longer reaction time, but then a considerable portion of the paraffins undergoes cracking to gases. At longer reaction times, the content of aromatic hydrocarbons exceeds that of naphthenes in the raw material, which evidences the dehydrocyclization of heptane. On comparing the plots of Figure 3 with the data of Table 1, it can be seen that, depending on the reaction conditions, the process yields either large amounts of reformate, which are rich in paraffins and much poorer in aromatic hydrocarbons, or reduced amounts of reformate with a high aromatic and much lower paraffin content.
n-Heptane
The use of heptane alone as a raw material for the reforming process has corroborated the well-described fact that aromatic hydrocarbons are formed via cyclization of paraffins to naphthenes and by a very fast dehydrogenation of the latter. This finding is evidenced by the variation in naphthene content with time through a maximum, which is typical of consecutive reactions (Table 1). The effect of reaction time and temperature on the aromatic hydrocarbon content is similar to the heptane–methylcyclohexane case. This suggests that the reforming process involves the same kinetic scheme. From the increased content of gases produced under equivalent conditions (Table 1) it can be inferred that paraffins are the main source of gas production and that naphthene cracking is very slow. The relationship between the quantity of the reformate and the content of aromatic hydrocarbons and paraffins in the
reformate is the same as for the heptane–methylcyclohexane mixture when used as raw material.[76]
Naphtha Fraction (60–1508C)
The group composition of this raw material can be itemized as follows: 1.40 wt % of gases, 52.80 wt % of paraffins, 31.96 wt % of naphthenes, and
288 |
Szczygieł |
Figure 3 Isolines of reformate content (wt %) in reaction product as a function of temperature (T) and time of reaction (h 1); raw material: heptane þ methylcyclohexane.[76]
13.84 wt % of aromatic hydrocarbons. As shown by the product data of Table 1, naphthene content is noticeably lower and aromatic hydrocarbon content distinctly higher than in the raw material—even at the onset of the reaction. This is indicative of the very fast naphthenes–aromatic hydrocarbons
reactions. At a reaction time of 4 h 1, aromatic hydrocarbon content (in statistically smoothed data[76]), approached 60% and was higher than the sum
of naphthenes and aromatic hydrocarbons contained in the raw material, indicating that paraffins through dehydrocyclization were the source of aromatic hydrocarbons. At 5108C, with a longer reaction time, the content of paraffins decreased to 20 wt %, and gas content amounted to 35%, which confirms the previous finding that under such conditions paraffins undergo significant cracking.[76]

Catalyst Pore Structure |
289 |
3.4Choice and Analysis of Kinetic Schemes
After data processing by statistical methods, and making use of the results from analyzing the plots, potential kinetic schemes were examined:
where P is paraffins, N is naphthenes, A is aromatic hydrocarbons, and G is gases. Each of the three schemes was tested by the numerical methods described in[76] with respect to the experimental results obtained with each of the three raw materials (Tables 3–5).
n-Heptane
Scheme 1 and Scheme 3 were found to be inadequate, as shown by the estimated values of the rate constants (Table 3). Scheme 1 fails to satisfy the fundamental relationship between the rate constants and temperature (Arrhenius law). The values of the rate constants k4 at 4908C and 5108C are negative. For Scheme 3, all the rate constants take positive values, but their decrease with increasing temperature (for k1, k3, k4, and k6) makes the model inadequate. Scheme 2 satisfies all the criteria for an appropriate choice of the model. The small error of the model at positive values of the rate constants supports the scheme. The description allows transition of naphthenes through a maximum (and this should be attributed to the incorporation of the transition of P ! N ! A in the scheme) and is in agreement with the experiment.
n-Heptane þ Methylcyclohexane
The best fitting of the theoretical curves (lowest Fc value) to experimental data is that of Scheme 3 (Table 4). However, the negative values of k6 and the nonconformance of the k3 values with the Arrhenius law make the model inadequate and infeasible. The other two schemes generally fulfill the criteria of an adequate description. Under equivalent temperature conditions, the values of the objective function for Scheme 2 are lower than those for Scheme 1, so Scheme 2 is recommended as best suited for the description of the process with an n-heptane þ methylcyclohexane mixture as raw material.

290
Table 3 Rate Constants for the Investigated Schemes of Reforminga
|
|
Scheme 1 |
|
|
|
Scheme 2 |
|
|
|
|
Scheme 3 |
|
|||
|
|
|
|
|
|
|
|
|
|
|
|
|
|
|
|
Rate |
|
|
Temp. (8C) |
|
|
|
|
Temp. (8C) |
|
|
|
|
|
Temp. (8C) |
|
constant |
Initial |
|
|
|
|
Initial |
|
|
|
|
Initial |
|
|
|
|
|
|
|
|
|
|
|
|
|
|
|
|
||||
(min21) |
value |
470 |
490 |
510 |
|
value |
470 |
490 |
510 |
|
value |
470 |
490 |
510 |
|
|
|
|
|
|
|
|
|
|
|
|
|
|
|||
k1 102 |
0.5 |
0.65 |
1.04 |
1.42 |
0.7 |
0.84 |
1.28 |
2.02 |
0.6 |
1.36 |
1.2 |
1.56 |
|||
k2 102 |
50.0 |
187.7 |
70.64 |
10.32 |
70.0 |
4.28 |
10.54 |
16.71 |
60.0 |
4.57 |
10.84 |
17.86 |
|||
k3 102 |
1.0 |
5.37 |
3.42 |
4.44 |
3.0 |
2.99 |
3.31 |
4.06 |
2.0 |
5.91 |
3.42 |
4.31 |
|||
k4 102 |
0.5 |
0.48 |
20.72 |
21.63 |
1.0 |
0.59 |
0.76 |
2.23 |
0.5 |
0.33 |
0.21 |
0.24 |
|||
k5 102 |
— |
— |
— |
— |
0.5 |
0.75 |
1.20 |
3.00 |
0.5 |
0.0006 |
0.0006 |
0.0003 |
|||
k6 102 |
— |
— |
— |
— |
|
— |
— |
— |
— |
0.5 |
0.032 |
0.041 |
0.038 |
||
KF |
50.00 |
80.95 |
68.07 |
46.50 |
45.0 |
75.54 |
67.71 |
46.37 |
30.0 |
81.24 |
67.93 |
46.5 |
|||
FC |
Initial |
6.71 |
6.48 |
12.63 |
|
Initial |
12.18 |
9.96 |
5.1 |
|
Initial |
8.65 |
5.08 |
8.36 |
|
|
value |
|
|
|
|
value |
|
|
|
|
value |
|
|
|
|
|
Final |
3.47 |
3.59 |
3.54 |
|
Final |
3.47 |
2.9 |
3.59 |
|
Final |
2.7 |
2.88 |
3.54 |
|
|
value |
|
|
|
|
value |
|
|
|
|
value |
|
|
|
|
aRaw material: n-heptane.
Source: Ref. [76].
Szczygieł

Table 4 Rate Constants for Investigated Schemes of Reforminga
|
|
Scheme 1 |
|
|
|
Scheme 2 |
|
|
|
|
Scheme 3 |
|
|||
|
|
|
|
|
|
|
|
|
|
|
|
|
|
|
|
Rate |
|
|
Temp. (8C) |
|
|
|
|
Temp. (8C) |
|
|
|
|
|
Temp. (8C) |
|
constant |
Initial |
|
|
|
|
Initial |
|
|
|
|
Initial |
|
|
|
|
|
|
|
|
|
|
|
|
|
|
|
|
||||
(min21) |
value |
470 |
490 |
510 |
|
value |
470 |
490 |
510 |
|
value |
470 |
490 |
510 |
|
|
|
|
|
|
|
|
|
|
|
|
|
|
|||
k1 102 |
0.5 |
0.26 |
0.34 |
0.63 |
0.7 |
0.41 |
0.57 |
0.95 |
0.6 |
0.35 |
0.59 |
0.87 |
|||
k2 102 |
50.0 |
23.59 |
30.22 |
45.76 |
70.0 |
23.09 |
33.71 |
57.25 |
60.0 |
23.05 |
34.14 |
60.47 |
|||
k3 102 |
1.0 |
2.41 |
3.83 |
3.98 |
3.0 |
3.44 |
4.89 |
5.61 |
2.0 |
3.01 |
2.41 |
2.09 |
|||
k4 102 |
0.5 |
0.69 |
0.74 |
0.97 |
1.0 |
0.54 |
0.71 |
0.79 |
0.5 |
0.24 |
1.08 |
1.37 |
|||
k5 102 |
— |
— |
— |
— |
0.5 |
0.25 |
0.38 |
0.48 |
0.5 |
0.358 |
0.5 |
0.67 |
|||
k6 102 |
— |
— |
— |
— |
|
— |
— |
— |
— |
0.5 |
20.0729 |
20.13 |
20.053 |
||
KF |
50.00 |
52.46 |
51.27 |
43.47 |
45.0 |
55.26 |
52.28 |
46.92 |
30.0 |
54.02 |
48.59 |
37.06 |
|||
FC |
Initial |
6.03 |
6.77 |
8.46 |
|
Initial |
8.92 |
7.26 |
6.71 |
|
Initial |
8.09 |
9.63 |
11.36 |
|
|
value |
|
|
|
|
value |
|
|
|
|
value |
|
|
|
|
|
Final |
4.31 |
4.80 |
4.70 |
|
Final |
4.21 |
4.70 |
4.57 |
|
Final |
4.14 |
4.47 |
3.77 |
|
|
value |
|
|
|
|
value |
|
|
|
|
value |
|
|
|
|
aRaw material: n-heptane þ methylcyclohexane.
Source: Ref. [76].
Structure Pore Catalyst
291

292
Table 5 Rate Constants for Investigated Schemes of Reforminga
|
|
Scheme 1 |
|
|
|
|
Scheme 2 |
|
|
|
|
|
Scheme 3 |
|
||
|
|
|
|
|
|
|
|
|
|
|
|
|
|
|
|
|
Rate |
|
|
Temp. (8C) |
|
|
|
|
|
Temp. (8C) |
|
|
|
|
|
Temp. (8C) |
|
constants |
Initial |
|
|
|
|
Initial |
|
|
|
|
|
Initial |
|
|
|
|
|
|
|
|
|
|
|
|
|
|
|
|
|
||||
(min21) |
value |
470 |
490 |
510 |
|
value |
470 |
490 |
510 |
|
value |
470 |
490 |
510 |
||
|
|
|
|
|
|
|
|
|
|
|
|
|
|
|||
k1 102 |
0.5 |
0.64 |
0.71 |
0.49 |
0.7 |
0.58 |
0.62 |
0.71 |
|
0.6 |
0.43 |
1.06 |
0.79 |
|||
k2 102 |
50.0 |
30.77 |
48.89 |
40.15 |
70.0 |
30.29 |
41.81 |
51.02 |
|
60.0 |
30.07 |
51.81 |
42.82 |
|||
k3 102 |
1.0 |
2.71 |
4.20 |
5.60 |
3.0 |
2.82 |
4.28 |
5.79 |
|
2.0 |
2.07 |
3.42 |
5.89 |
|||
k4 102 |
0.5 |
0.38 |
0.45 |
0.35 |
1.0 |
0.02 |
0.037 |
0.051 |
|
0.5 |
0.093 |
0.019 |
0.074 |
|||
k5 102 |
— |
— |
— |
— |
0.5 |
|
2.78E205 |
3.52E205 4.30E205 |
0.5 |
23.42E203 5.01E203 |
3.34E203 |
|||||
k6 102 |
— |
— |
— |
— |
|
— |
|
— |
— |
— |
0.5 |
29.60E202 21.80E201 |
29.80E202 |
|||
KF |
50.00 |
34.00 |
30.22 |
27.6 |
45.0 |
34.08 |
30.2 |
27.65 |
|
30.0 |
31.03 |
29.29 |
27.79 |
|||
FC |
Initial |
8.04 |
10.15 |
11.4 |
|
Initial |
6.31 |
8.41 |
9.89 |
|
Initial |
12.21 |
13.73 |
14.73 |
||
|
value |
|
|
|
|
value |
|
|
|
|
|
value |
|
|
|
|
|
Final |
4.1 |
4.37 |
4.5 |
|
Final |
4.15 |
4.31 |
4.13 |
|
Final |
4.04 |
3.95 |
4.22 |
||
|
value |
|
|
|
|
value |
|
|
|
|
|
value |
|
|
|
|
aRaw material: naphtha fraction.
Szczygieł

Catalyst Pore Structure |
293 |
Naphtha Fraction
When a naphtha fraction is used as raw material, it is possible to predict the direction of conversion in a real system. The models tested for this system favored Scheme 2 as best suited (Table 5). Scheme 1 was rejected due to the lack of the required relationship between rate constant variations and temperature. Scheme 3 generated negative values of k6 for each of the investigated temperatures and a negative value of k5 for the temperature of 4708C. The plots of k1 and k4 variations with temperature also raised serious objections. Scheme 2 was found to satisfy all the criteria required, so it can be regarded as suitable for the description of the reforming process for naphtha as raw material. Even though the curve describing the time dependence of naphthene content variations runs below the experimental points for each of the investigated temperatures, the fit is good, as shown by the plots of Figure 4.
3.5Models Based on an Analytical Description of Time-Related Variations in the Content of Reagents
Analysis of the kinetics identifies the same model (kinetic Scheme 2), irrespective of the starting compound. This finding has been further substantiated by investigations into dehydrocyclization of n-heptane over a more active
Figure 4 Composition of reaction product (wt %) vs. time for 5108C and 1 MPa. Lines for Scheme 2: a, paraffins; b, naphthenes; c, aromatics; d, gases. Experimental points: 4, paraffins; A, naphthenes; W, aromatics; , gases. Raw material: naphtha fraction.[76]

294 |
Szczygieł |
catalyst, as well as by functional descriptions of time-related variations in the reagents for Scheme 1 and Scheme 2.[36]. The results of tests performed with a pressure apparatus (Fig. 2) are listed in Table 6. The use of functional descriptions of time-related reagent variations for the estimation of the rate constants noticeably saves computation time and makes it possible to avoid errors resulting from numerical calculations during selection of an appropriate integration step.
Both models provide reliable profiles of reagent concentration variations; they incorporate the maximum and the decreasing time-related content of naphthenes.[36] According to expectations, both models yield a k2 value that is considerably higher than the values of other rate constants (Table 7). The model represented by Scheme 2 provided better fitting of the curves to experimental data, which is manifest in the lower value of the objective function Fc (Table 7).
3.6Summarizing Comments
Two complementary mathematical methods for the analysis of the reforming
process were employed. Statistical analysis based on relevant plots (figures from[36,76]) “smoothes” the experimental data, making it possible to predict the
content of the substrates at any point of time and temperature. By extension, it
Table 6 Results of Dehydrocyclization of n-Heptane
|
|
|
|
Raw material: n-heptane |
|
|||
Process |
|
|
|
|
|
|
|
|
|
|
|
|
|
|
|
||
parameters |
|
|
|
|
Yield (wt%) |
|
||
|
|
|
Conversion |
|
|
|
|
|
Temp. |
Space vel. |
Gases |
Paraffins |
Naphthenes |
Aromatics |
|||
(8C) |
(h 1) |
(%) |
||||||
|
|
|
|
|||||
470 |
1 |
|
92.81 |
38.78 |
45.36 |
1.63 |
14.24 |
|
470 |
2 |
|
86.14 |
35.07 |
53.23 |
1.67 |
10.03 |
|
470 |
4 |
|
71.3 |
19.36 |
69.05 |
1.78 |
9.82 |
|
470 |
8 |
|
64.64 |
22.06 |
70.94 |
0.7 |
6.3 |
|
490 |
1 |
|
96.17 |
46.9 |
38.43 |
1.27 |
13.4 |
|
490 |
2 |
|
90.62 |
33.65 |
52.25 |
2.03 |
12.07 |
|
490 |
4 |
|
81.14 |
29.86 |
56.65 |
1.27 |
12.22 |
|
490 |
8 |
|
73.33 |
22.7 |
70.91 |
0.61 |
5.78 |
|
510 |
1 |
|
99.17 |
57.12 |
28.5 |
0.45 |
13.93 |
|
510 |
2 |
|
96.6 |
42.5 |
40.56 |
1.08 |
15.87 |
|
510 |
4 |
|
93.06 |
38.13 |
46.22 |
1.24 |
14.41 |
|
510 |
8 |
|
78.35 |
27.35 |
67.11 |
0.95 |
4.58 |
|
|
|
|
|
|
|
|
|
|

Table 7 Rate Constants for Investigated Schemes of Dehydrocyclizationa
|
|
|
Scheme 1 |
|
|
|
|
|
Scheme 2 |
|
|
||
|
|
|
|
|
|
|
|
|
|
|
|
|
|
Rate |
|
|
Temp. (8C) |
|
|
|
|
|
|
Temp. (8C) |
|
|
|
constants |
Initial |
|
|
|
|
|
|
Initial |
|
|
|
|
|
|
|
|
|
|
|
|
|
|
|
|
|||
(min 1) |
value |
470 |
490 |
510 |
ln k0 |
E=R |
|
value |
470 |
490 |
510 |
ln k0 |
E=R |
k1 102 |
2.11 |
1.26 |
1.75 |
2.15 |
|
|
1.6 |
1.53 |
1.89 |
2.21 |
|
|
|
k2 102 |
20.56 |
25.12 |
32.04 |
43.13 |
8.39 |
7244.04 |
30.13 |
31.18 |
35.0 |
53.42 |
9.19 |
7733.80 |
|
k3 102 |
6.07 |
3.36 |
5.07 |
6.59 |
9.79 |
9787.50 |
3.77 |
3.95 |
5.0 |
6.04 |
5.03 |
6138.70 |
|
k4 102 |
1.74 |
1.5 |
2.07 |
2.59 |
6.49 |
7931.33 |
0.97 |
0.94 |
1.7 |
3.05 |
18.27 |
17048.90 |
|
k5 102 |
— |
— |
— |
— |
— |
— |
0.78 |
0.86 |
1.3 |
2.23 |
13.75 |
13776.54 |
|
kF |
35.00 |
35.02 |
35.01 |
28.34 |
|
|
38.75 |
39.5 |
38.07 |
28.3 |
— |
— |
|
FC |
Initial |
38.04 |
26.63 |
22.95 |
— |
— |
|
Initial |
15.14 |
13.78 |
11.86 |
— |
— |
|
value |
|
|
|
|
|
|
value |
|
|
|
|
|
|
Final |
17.47 |
14.93 |
12.63 |
— |
— |
|
Final |
14.92 |
12.64 |
11.80 |
— |
— |
|
value |
|
|
|
|
|
|
value |
|
|
|
|
|
aRaw material: n-heptane.
Structure Pore Catalyst
295
296 |
Szczygieł |
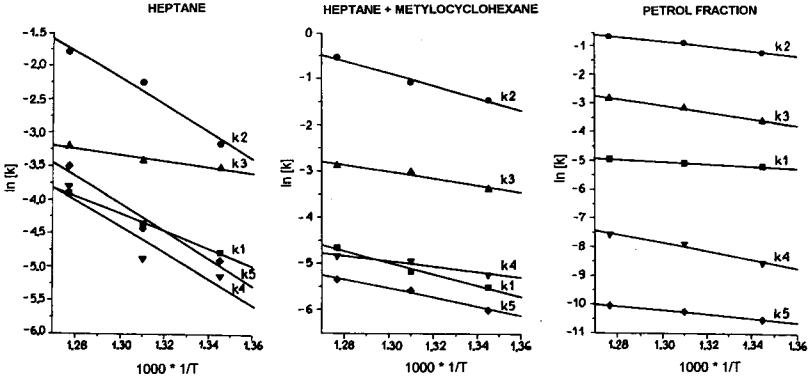
allows a level of optimization of the process and an appropriate choice of the process parameters so as to achieve an anticipated goal, e.g., a maximal yield of the reformate or a maximal content of aromatic hydrocarbons in the reformate. Statistical analysis of the black box led to certain suggestions about the kinetics of the process, which were verified while constructing the kinetic model based on the mass balance and on the physicochemical principles of the reforming process. It was found that irrespective of the raw material used, analysis of the kinetics of the process evidences the applicability of the same model (Scheme 2). This finding was additionally corroborated in other studies using n-heptane.[36] Figure 5 shows the criterion of compliance with the Arrhenius law for the rate constants generated by the adopted model with the use of various raw materials. The numerical Runge–Kutta approach to the solution of the differential equations representing the investigated models was found to be effective, so it may be of equal utility when applied to the analysis of other kinetic schemes.
This part of the study deals with the macrokinetics of the reforming process. Consequently, consideration is given to the rates of pseudoreactions (conversion of the group components), not to the rates of the reactions between individual compounds. That is why not all of the thermodynamic relations are fulfilled, and the rate constants depend on the composition of the raw material and are effective constants. However, for kinetic schemes the Arrhenius law is satisfied quite well and the model describes the experimental values. Hence, Scheme 2 may be of utility in predicting and optimizing the reforming process. The calculated rate constants of conversion will be employed in the analysis of the model to optimize the porous structure of the reforming catalyst.
4DIFFUSION PHENOMENA IN THE BIDISPERSIVE GRAIN OF THE CATALYST
At standard temperature and pressure, the reforming process runs in the internal diffusion region because of the different rates of the reactions involved. This implies that the rate of the reforming process is limited by the rate of the substrate
and product transport inside the catalyst grain. Thus, the porous structure becomes an important factor affecting the rate of the process.[72] To find an
optimal porous structure it is necessary to analyze the transport phenomena in the
grain interior and to incorporate the transport equations (which include the parameters of the porous structure) into the model of the reforming process.[19,35]
Under reforming conditions, the substrates and products occur in gaseous form, requiring the consideration of molecular diffusion and of Knudsen diffusion in the catalyst pores. Whether molecular or Knudsen diffusion becomes dominant
depends on the ratio of the pore diameter to the mean free path of molecular motion.[73] At typical reforming conditions, and with a range of pore size for each
Structure Pore Catalyst
Figure 5 Arrhenius line for reaction rate constant calculated from Scheme 2.[76]
297
298 |
Szczygieł |
porous structure, both mechanisms are of vital importance and both should be considered when determining the overall diffusion coefficient. When equations are derived for the transport in the entire catalyst grain, the porous structure is regarded as a quasi-homogeneous environment that obeys the law of gases, and the diffusion coefficients are then effective constants.[74,75] The definition of the effective diffusion coefficient as an explicit function of the porous structure parameters will make it possible to analyze the influence of the latter on the efficiency of the process and to establish their optimal values.
4.1Tasks in Analyzing Diffusion Phenomena
It is necessary to propose a method and an algorithm in order to assess the coefficients of molecular, Knudsen, overall, and effective diffusion for the group components regarded as chemical individuals in the reforming process under conditions of internal diffusion.[22] These values are used in the analysis of
the reforming model to optimize the porous structure of the catalyst at the successive stage.[19,35] Making use of the adopted geometrical model of the pore
network,[34] a function is proposed. The function relates the effective coefficient of diffusion to the coefficients of Knudsen and molecular diffusion, as well as to the parameters of the porous structure.[22] The expression of the effective coefficients of diffusion as a function of the parameters of the porous structure will dictate the distribution of concentrations in the catalyst grain. A controlled distribution of concentrations can guarantee an effective utilization of the internal surface. After incorporation of the proposed function into the equations of mass transport, it will be possible to make an appropriate choice of parameters for the porous structure. Another major objective is to analyze some properties of bidispersive catalytic structures in the applied range of variations of their structural and kinetic parameters, thereby substantiating their usefulness.
4.2Assumptions in the Description of Diffusion Phenomena
For use in the reforming process model, the term “chemical individuals” will denote the following group components: paraffin hydrocarbons, naphthenes, aromatic hydrocarbons, and gases.[36,76] For the substrates, the transport phenomena that occur in the cylindrical pores and in the entire grain regarded as a quasi-homogeneous environment are analyzed. The transport phenomena considered here can be defined as macrodiffusion. The assumptions are as follows:
1.Under conditions of reforming, the substrates and the products have a gaseous form. For this reason, Knudsen diffusion in addition to molecular diffusion may occur in both wide and narrow pores. To calculate the overall coefficients of diffusion in both pore types, use
Catalyst Pore Structure |
299 |
should be made of the relation:
|
1 |
1 |
1 |
|
Diov ¼ |
|
þ |
|
(1) |
Dim |
Dik |
|||
which is valid for the transition zone and limit cases.[77]
2.There are no reasons for the occurrence of mass stream other than diffusion. The effect of surface diffusion is neglected because in a catalytic process surface diffusion would require a high activation energy. The existence of the stream induced by pressure drop in the reactor is neglected because it exists in very large pores only ( 100 nm, which account for a very small percentage of the total pore number) or at very high pressure (.100 atm). Also neglected is convectional mass motion induced by the change of the mole number in the reaction.
3.The coefficient of molecular diffusion depends not only on the type of diffusing substance (group component) but also on the composition of the reaction mixture (other group components). To calculate the coefficient of diffusion through the mixture for the ith group
component (Dim) it is necessary to use the expression derived by Wilke.[78]
4.The coefficient of diffusion of a group component through another
pomponent (Di;j) is calculated in terms of the correlation established by Hirschfelder et al.[79,80]
5.The effect of hydrogen as a component of the reaction mixture is neglected when calculating the coefficient of molecular diffusion for the group components.
6.Making use of the process balance and of the reported values of the Lennard–Johns force constants (1=k and s) for the chemical individuals which are present in the reforming products (Table 8),[79] as well a considering the mole fraction of the compounds that occur in the adopted group components, molecular weights—(Mi), the 1=k ratio, and the s values of these group components are calculated as additives to the molar fraction of the compounds in these groups. The process balance is used to calculate the molar fractions of the group components yi.
7.For the transition from Diov to Dief , use is made of a geometrical model of the pore network, which is based on the globular structure of the reforming catalyst grain tested in a previous study.[34] If the
contacting particles are identical in size and have a constant density of arrangement (homogeneous monodispersive model), the pore network model will be similar to the bidispersive random model developed by Wakao and Smith. Therefore, the effective coefficient

300
Table 8 Reported Data for Calculation of Diffusion Coefficients
Component |
Group |
Mc |
1=k (K) |
˚ |
Tc (K) |
Vc (cm |
3 |
/g) |
Pc (atm) |
s (A) |
|
||||||||
|
|
|
|
|
|
|
|
|
|
Hydrogen |
— |
1 |
33.3 |
2.968 |
33.2 |
— |
|
|
12.8 |
Methane |
Gas |
16 |
136.5 |
3.822 |
190.6 |
99.0 |
|
45.8 |
|
Ethane |
Gas |
30 |
230.0 |
4.418 |
305.2 |
148.0 |
|
48.8 |
|
Propane |
Gas |
44 |
254.0 |
5.061 |
370.0 |
195.0 |
|
42.0 |
|
i-Butane |
Gas |
58 |
313.0 |
5.341 |
408.2 |
263.0 |
|
36.0 |
|
n-Butane |
Gas |
58 |
410.0 |
4.997 |
425.2 |
254.58 |
37.5 |
||
i-Pentane |
Paraffin |
72 |
355.0 |
5.500 |
461.0 |
304.85 |
32.8 |
||
n-Pentane |
Paraffin |
72 |
345.0 |
5.769 |
470.2 |
312.44 |
33.0 |
||
i-Hexane (2-methylcyclopentane) |
Paraffin |
86 |
385.0 |
5.850 |
500.0 |
367.00 |
30.0 |
||
Cyclopentane |
Naphthene |
70 |
394.0 |
5.220 |
511.8 |
260.00 |
44.6 |
||
n-Hexane |
Paraffin |
86 |
413.0 |
5.909 |
508.0 |
— |
|
|
29.50 |
Methylcyclopentane |
Naphthene |
84 |
410.0 |
5.580 |
532.8 |
319.00 |
— |
||
i-Heptane (2-methylhexane) |
Paraffin |
100 |
430.4 |
6.420 |
559.0 |
488.00 |
27.60 |
||
n-Heptane |
Paraffin |
100 |
282.0 |
8.880 |
540.0 |
426.00 |
26.80 |
||
Cyclohexane |
Naphthene |
84 |
313.0 |
6.143 |
554.2 |
308.0 |
|
40.0 |
|
Methylcyclohexane |
Naphthene |
98 |
440.6 |
5.850 |
572.2 |
367.88 |
34.3 |
||
Benzene |
Aromatic |
78 |
308.0 |
6.920 |
561.8 |
258.94 |
48.0 |
||
Toluene |
Aromatic |
92 |
185.0 |
12.00 |
593.8 |
315.60 |
41.6 |
||
Xylenes (naphthalane) |
Aromatic |
106 |
485.1 |
6.010 |
630.0 |
400.00 |
36.0 |
||
Aromatics (n-butylbenzene) |
Aromatic |
120 |
508.2 |
6.460 |
660.00 |
497.00 |
32.3 |
||
Source: Ref. [7 – 9].
Szczygieł
Catalyst Pore Structure |
301 |
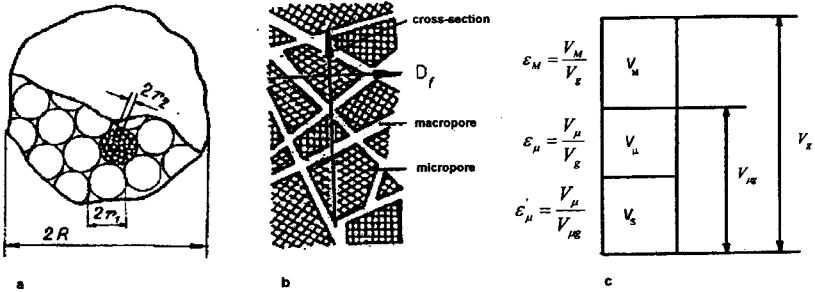
of diffusion related to the parameters of the porous structure will be described by the relation resulting from the analysis of the Wakao–Smith model.[17] The grain model, the resulting pore structure model, and the parameters of this structure are shown in Figure 6.
8.To analyze the effect of structural and kinetic parameters on the
utilization of micrograms and macropores ( fm and fM), the notion of the FS modulus (analogous to the Thiele modulus, h[9] and based on experimental data) is introduced.
F ¼ h2 f |
¼ |
ð |
|
|
Þ |
(2) |
Thus, it is possible to determine the relationships fm |
Fm |
|
||||
|
g |
|
and |
|||
fM ¼ gðFMÞ from experimental data. This method of analysis |
[81] |
can |
||||
|
|
|||||
be modified by including the effective diffusion coefficient (Dief ) calculated with the Wakao–Smith model[17] and by distinguishing the terms responsible for the diffusion in microand macropores. A detailed algorithm adopted for the assessment of the Dif values and for the analysis of the properties of bidispersive catalytic systems can be found in a previous paper.[22]
4.3Examples of Calculations
Microreactor results for n-heptane conversion[82] at various reaction times and two temperatures (4708C and 5108C) enabled us to investigate the diffusion variations with each change in the composition of the reaction mixture and to determine the effect of temperature on the values of the diffusion coefficients. Based on the1=k and s and Mc values reported in the literature (Table 8), as well as on the results of chromatographic analysis and balance for each experiment, the additive values of these quantities were calculated for the group components. The additive values were used as input data for the equations of the proposed algorithm[22] to calculate the diffusion coefficients in the pores and the effective coefficients of diffusion for each group component (Table 9).
Statistical Analysis
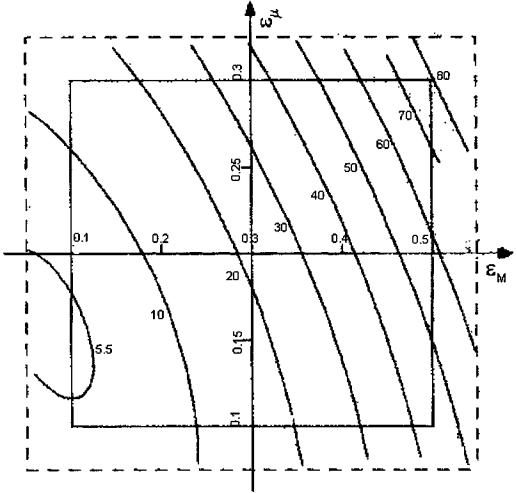
For a reliable qualitative analysis of the influence of porosity 1M and 1m on the
effective diffusion coefficients of the group components, the Dief values calculated in terms of the algorithm[22] for 27 points within the ranges 1M (0.1–0.5)
and 1m (0.1–0.3) were approximated by adequate polynomial equations, which were analyzed by transformation to the canonical form[83] and by the Hoerle method.[84] The transformation method enables analysis on clear “maps” where variations of the Dief values can be examined in the system of two variables, 1M
302
Figure 6 (a) Model of catalyst grain. (b) Model of porous structure of catalyst grain. (c) Parameters of porous structure of catalyst grain.[22]
Szczygieł

Table 9 |
Diffusion Coefficients of Group Components for Different Conditions of Reforming |
|
|
|
||||||||||
|
|
|
|
|
|
|
|
|
|
|
||||
|
|
|
|
Space velocity (h 1) ¼ 1 |
|
|
|
|
Space velocity (h 1) ¼ 8 |
|
||||
Group |
|
|
|
|
|
|
|
|
|
|
|
|
|
|
|
|
1=k |
s |
Dim |
DiM |
Dief |
|
Mc |
1=k |
s |
Dim |
DiM |
Dief |
|
component |
|
Mc |
|
|||||||||||
Temperature, 4708C |
|
|
|
|
|
|
|
|
|
|
|
|
||
Gases |
38.12 |
244.91 |
4.67 |
1.291E202 |
1.74E202 |
8.312E203 |
44.66 |
270.32 |
4.93 |
1.129E202 |
1.455E202 |
7.185E203 |
||
Paraffins |
98.65 |
314.99 |
8.23 |
9.437E203 |
1.535E202 |
6.418E203 |
99.69 |
288.05 |
9.76 |
8.471E203 |
1.211E202 |
5.545E203 |
||
Naphthenes |
98.00 |
440.00 |
5.85 |
8.562E203 |
1.226E202 |
5.608E203 |
95.72 |
423.15 |
5.81 |
7.866E203 |
1.030E202 |
5.026E203 |
||
Aromatics |
92.00 |
185.00 |
12.00 |
6.030E203 |
6.030E203 |
3.704E203 |
92.00 |
185.00 |
12.00 |
5.345E203 |
5.759E203 |
3.255E203 |
||
Temperature, 5108C |
|
|
|
|
|
|
|
|
|
|
|
|
||
Gases |
37.70 |
243.57 |
4.66 |
1.375E202 |
1.909E202 |
8.926E203 |
40.82 |
258.19 |
4.77 |
1.289E202 |
1.748E202 |
8.314E203 |
||
Paraffins |
94.88 |
367.33 |
7.08 |
1.017E202 |
1.732E202 |
7.017E203 |
99.29 |
299.99 |
8.53 |
9.542E203 |
1.526E202 |
6.455E203 |
||
Naphthenes |
98.00 |
440.00 |
5.85 |
1.006E202 |
1.728E202 |
6.961E203 |
98.00 |
440.00 |
5.85 |
8.679E203 |
1.227E202 |
5.663E203 |
||
Aromatics |
92.00 |
185.00 |
12.00 |
7.743E203 |
9.684E203 |
4.889E203 |
92.00 |
185.00 |
12.00 |
6.134E203 |
6.835E203 |
3.765E203 |
||
Source: From Ref. [22].
Structure Pore Catalyst
303
304 |
Szczygieł |
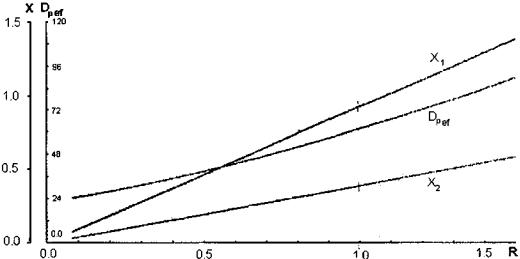
and 1m (Fig. 7). The other method allows determination of the 1M and 1m, values, which maximize the Dief coefficients, relating them to the radius of the experimental region R. The values of 1M and 1m can be read on the common axis X (Fig. 8) as a result of their standardization in the limits of 1 to þ1 prior to the generation of the polynomial equations. The radius of the experimental region takes the form R ¼ X12 þ X22, where X1 and X2 are standardized values of 1M and 1m, respectively. The increase of both macropore and micropore volumes is advantageous to the increase of Dief for all components. The inclinations of the isolines evidences a noticeably greater contribution of 1M (Fig. 7). Hoerle’s analysis (Fig. 8) makes it possible to take readings of the optimal values (i.e., those maximizing Dief ) of macropore and micropore porosity for a defined R.
Figure 7 Isolines of Dpef 1000 value (effective coefficient of diffusion of paraffins) as a function of macroporosity (1M) and microporosity (1m) of grain.[22]
Catalyst Pore Structure |
305 |
Figure 8 Extreme values of Dpef 1000 value (effective coefficient of diffusion of
paraffins) and corresponding values of standardized macroporosity (X1) and microporosity (X2) vs. R.[22]
Properties of Bidispersive Catalytic Systems
With the algorithm proposed[22] it is possible to analyze the effect of rM and VM on the utilization and diameter of micrograms in a bidispersive catalyst (dmg) (Fig. 9). The analysis was performed for a 0.15-cm-diameter catalyst with Vm of 0.3 cm3/g and for two n-heptane dehydrocyclization rate constants, Kexp: 11 and 22 cm3/ (g s). Figure 9 shows the efficiency of micrograin utilization for the macropore volume of 0.4 cm3/g within the radius range from 0 to 40 mm practically equals 1. At VM ¼ 0:2 and 0.1, the efficiency of micrograin utilization decreases with an increasing value of rM and is smaller for a smaller macropore volume. The increase in diffusivity may be attributed to the decreased number of macropores (at an increased radius), to their constant volume, and consequently to a more restricted availability of the micrograin pores. For higher rate constant values,[22] the limitation of the process is shifted toward the diffusion region. In both cases the efficiency of micrograin utilization in the applied range of macropore radii is unity, irrespectve of the VM value. However, the efficiency of macropore utilization fM increases with increasing VM. Therefore, it is recommended to use a catalyst characterized by an increased VM value (0.4 cm3/g) so as to increase the overall coefficient of grain utilization, fg. VM values greater than 0.4 cm3/g may decrease the mechanical strength of the catalyst.
Making the assumption that in the investigated range of macropore radii, a free transport of mass is provided, then the utilization of the macropores fM will not depend on their radii, and the overall coefficient of grain utilization at
306 |
Szczygieł |
Figure 9 Utilization of micrograins fm (left-hand side), micrograins diameter dmg (righthand side) vs. macropore radius rM for different volume of macropore.[22]
constant VM will not vary in a wide range of the macropore radius. Knowing the
value of the rate constant related to the unit surface Ki (which is calculated in step 10 of the proposed algorithm[22]), one can not only calculate the efficiency of
micrograin surface utilization, f0, in the absence of macropores (VM ¼ 0), but also assess the increase of grain effectiveness resulting from the presence of macropores. The results are demonstrated in Table 10. The data of column 1 and column 2 (for VM ¼ 0:1) pertain to the catalyst which was used in the experiment. It can be inferred that the increase of the macropore volume in the catalyst will increase the utilization of the catalyst surface. The other columns include the results calculated in terms of the algorithm for hypothetical data. These results are utilized to determine their influence on the diffusivity in the grain.

Catalyst Pore Structure |
|
|
|
|
307 |
|
Table 10 Diffusion Parameters for Various Parameters of Porous Structure |
|
|||||
|
|
|
|
|
|
|
|
1 |
2 |
3 |
4 |
5 |
6 |
|
|
|
|
|
|
|
S (cm2/g) |
192.00 |
192.00 |
192.00 |
192.00 |
192.00 |
192.00 |
d (cm) |
0.15 |
0.15 |
0.15 |
0.15 |
0.15 |
0.10 |
DM (cm2/s) |
0.015350 |
0.012110 |
0.015350 |
0.015350 |
0.015350 |
0.015350 |
Dm (cm2/s) |
0.009437 |
0.008471 |
0.009437 |
0.009437 |
0.001000 |
0.001000 |
3 . |
22.00 |
22.00 |
11.00 |
22.00 |
22.00 |
22.00 |
Kexp (cm /g s) |
||||||
Vm (cm3/g) |
0.407 |
0.407 |
0.407 |
0.200 |
0.407 |
0.407 |
Volume of macropores VM (cm3/g) |
|
|
|
|
||
0.1 |
|
|
|
|
|
|
fM |
0.203 |
0.181 |
0.406 |
0.083 |
0.033 |
0.073 |
fm |
1 |
1 |
1 |
1 |
1 |
1 |
fg |
0.203 |
0.181 |
0.406 |
0.083 |
0.033 |
0.073 |
Ki |
5.56E205 |
6.37E205 |
1.41E205 |
1.38E204 3.51E204 |
1.56E204 |
|
fo |
0.170 |
0.152 |
0.341 |
0.062 |
0.022 |
0.049 |
h |
1.20 |
1.19 |
1.20 |
1.34 |
1.47 |
1.47 |
0.2 |
|
|
|
|
|
|
fM |
0.273 |
0.240 |
0.547 |
0.138 |
0.069 |
0.155 |
fm |
1 |
1 |
1 |
1 |
1 |
1 |
fg |
0.273 |
0.240 |
0.547 |
0.138 |
0.069 |
0.155 |
Ki |
4.19E205 |
4.77E205 |
1.05E205 |
8.28E205 1.66E204 |
7.38E205 |
|
fo |
0.197 |
0.175 |
0.394 |
0.080 |
0.032 |
0.072 |
h |
1.38 |
1.37 |
1.38 |
1.72 |
2.13 |
2.13 |
0.4 |
|
|
|
|
|
|
fM |
0.437 |
0.374 |
0.870 |
0.283 |
0.179 |
0.404 |
fm |
1 |
1 |
1 |
1 |
1 |
1 |
fg |
0.437 |
0.374 |
0.870 |
0.283 |
0.179 |
0.404 |
Ki |
2.63E205 |
3.06E205 |
6.58E206 |
4.04E205 6.38E205 |
2.84E205 |
|
fo |
0.249 |
0.219 |
0.498 |
0.114 |
0.052 |
0.117 |
h |
1.75 |
1.71 |
1.75 |
2.46 |
3.45 |
3.45 |
Source: Ref. [22].
On the basis of the data presented in this section, the following generalizations can be made:
.The limitation for a slower reaction shifts towards the kinetic region, which manifests in the increase of surface utilization (Table 10, column 3).
.The decrease of micropore volume at an unchanged surface is concomitant with a decrease of the micropore radius, thus inhibiting the access of the substrate to the grain interior. This manifests in a decrease
of the fg value (Table 10, columns 1 and 4).
.The increase of diffusion coefficients DM and Dm enhances the utilization of the catalyst surface, whereas an increase of the grain
308 |
Szczygieł |
effectiveness h (contributed by the presence of macropores) depends on the DM=Dm ratio, when Vm and VM are constant (Table 10, columns 1, 5, and 6).
.Application of a small grain diameter (d) shifts the process towards the kinetic region, which manifests in an increase of the fg value (Table 10, column 6).
4.4Summary Comments on Diffusion Phenomena in the Grain of the Reforming Catalyst
The realization of the presented algorithm made it possible not only to analyze the diffusion phenomenon in a bidispersive grain of the reforming catalyst but also to include experimental results. Making use of the physical model for a bidispersive structure,[34] calculations yielded the following parameters: the coefficients of macrodiffusion for the group components in macroand micropores, the effective coefficient of macrodiffusion for the entire grain, and the effective coefficients of macrodiffusion for micrograms. All these values are needed when calculating the coefficients for the utilization of macropores ( fM) and micrograms ( fm).
Analysis of the bidispersive structure revealed a low degree of utilization for macropores and a high degree of utilization for micrograms (approaching unity in the investigated range of macropore radii). The overall utilization of the grain can be raised by the increase of the macropore volume, but such increase is concomitant with the deterioration of the grain strength. This finding calls for a reasonable compromise. This study showed that in a wide range of variation the macropore radius exerted no effect on the overall utilization of the grain.
5OPTIMIZING THE POROUS STRUCTURE OF THE REFORMING CATALYST
An appropriately chosen pore structure for the reforming catalyst may shift the course of some reactions from the diffusion region to the kinetic one, thus increasing the efficiency of the process.[71] Narrow pores increase the reaction surface. But this increase is paralleled by the deterioration of the access to that
surface. The reforming catalyst should therefore contain a certain number of wide pores (transporting pores), which facilitate such an access.[85,86] The expression
“optimal structure” denotes a bidispersive catalyst consisting of wide pores (radius r1) and narrow pores (radius r2) in an exactly defined proportion v, of which provides an optimal efficiency for the reforming process. State-of-the-art technologies of catalyst preparation make it possible to obtain reforming catalysts of various porous structures, so that it is conceivable to implement porous structure parameters proposed in the final part of this section.
Catalyst Pore Structure |
309 |
5.1Scope of the Simulation of the Optimal Structure
The last link of the block diagram in Figure 1 includes two tasks—construction and analysis of the mathematical model for the optimization of the porous structure. For the purposes of the model a physical “layered” model of the catalyst grain[19] was assumed and then verified in Section 3. Then, using a probable kinetic scheme (which comprised consecutive, simultaneous, and opposite reactions) the coefficients of diffusion were derived in Section 4. The input data for the model (composition of reagents, coefficients of diffusion, rate constants of conversion) were obtained from the results of various studies. With the goal of raising the efficiency of the process by controlling the transport
phenomena in the catalyst grain, the effects exerted |
by the parameters of |
the porous structure on the diffusion limitation were |
analyzed. Following |
the mathematical analysis of transport phenomena and process kinetics, an optimal porous structure in which the transport of the substrates would not inhibit the rate of the entire process was proposed. Analysis of the model with the aim to optimize the porous structure of the reforming catalyst was performed for the dehydrocyclization of n-heptane under reforming conditions. The rate constants for particular reactions were assessed using an analytical form of description that showed time-related variations in the content of particular reagents (Table 7).
5.2Topological and Geometrical Representation of the Pore Space
Mathematical analysis of the reaction–diffusion phenomena in the grains of the reforming catalyst was carried out with a layered model (Fig. 10a), which involved the following assumptions:
. The grain has a radius Rg and consists of n adjacent layers, Fj.
.The number of n layers in the grain, which are of the same thickness (Rg=n), must provide convergence of calculations.
.The surfaces limiting the layers pass through the points of pore ramification, and the pore number increases with the increasing sphere
radius.
.If the layer thickness is appropriately small, the pores passing through the layer are parallel and have the same length, l, which is equal to the thickness of each layer.
.Each layer contains two types of cylindrical pores: wide pores of radius r1 (macropores) and narrow pores of radius r2 (micropores).

310 |
Szczygieł |
Figure 10 (a) Layered model of catalyst grain.[19] (b) Scheme of cylindrical pore.[19]

Catalyst Pore Structure |
311 |
.The numbers assigned to the wide (m1) and narrow (m2) pores of particular layers are functions of the number of the layer ( j); m1 and m2 are interrelated by the condition of constant porosity
m1( j) p r12 þ m2( j) p r22 |
¼ |
k |
(3) |
|
4 p( j l)2 |
||||
|
|
|||
as well as by their ratio, which is constant in all layers: |
|
|||
m1( j) ¼ v m2( j); |
v ¼ constant |
(4) |
||
.The porous structure of the catalyst grain described by the proposed model is characterized by the parameters r1, r2, and v.
Like the Bethe lattice topology developed by Reyes and Jensen,[37] the pore lattice topology presented in this work (Fig. 10) contains no closed loops. Real
pore walls can be tortuous and have a rough fractal surface. As shown by Coppens and Froment,[31,32] the fractal dimension exerts a noticeable effect on
the efficiency of the catalyst grain. In our model, the pores are cylindrical in shape, and the fractal dimension effect is reduced by the controlled short length of the pores.
5.3Physicochemical Phenomena of the Reforming Process
Kinetics
It is on the surface of the cylindrical pore lattice (Fig. 10b) that the chemical reactions of the reforming process proceed and the reactions follow the macrokinetic pattern described earlier as Scheme 2. The reactions adopted in the scheme are first-order reactions. From this, it can be shown that if paraffins are the starting compounds (n-heptane [Pðt0Þ& ¼ 100%), the content of naphthenes CN at an arbitrary point of time (except at t0 ¼ 0) can be expressed approximately as a function of paraffin content (Cp) in terms of the following equation:
CN |
k1 |
Cp |
(5) |
(k2 þ k4 þ k5) (k1 þ k3) |
The rate constant values for the reactions of Scheme 2 (Table 8), which have been used as input data to the derived model, are from a previous study[36] reporting on
investigations into the kinetics of the reforming process.
Diffusion
Group components behave in the same way as chemical individuals. Diffusion transport phenomena therefore pertain to the same group components treated as

312 |
Szczygieł |
individuals (macrodiffusion). Considering the assumptions in Section 4.2 and making use of the theoretical relations of the algorithm,[22] the overall coefficients of diffusion in micropores and macropores were assessed as follows:
|
|
|
|
1 |
|
|
1 |
|
|
|
|
1 |
|
1 |
|
1 |
|
|
|
|||||||
|
|
|
|
|
|
1 |
|
|
|
|
|
|
|
|
|
|
|
|
||||||||
Dim |
¼ |
|
|
þ |
|
|
|
|
|
|
DiM |
¼ |
|
|
þ |
|
|
|
|
|
(6) |
|||||
Dim |
(Di)Km |
|
|
|
|
|
Dim |
|
(Di)KM |
|
|
|||||||||||||||
where |
|
|
|
|
|
|
|
|
|
|
|
|
|
|
|
|
|
|
|
|
|
|
|
|
|
|
D |
|
¼ |
|
1 yi |
|
D |
i,j ¼ |
0:001858 |
T1:5 |
½(Mi þ Mi)=Mi Mj&0:5 |
||||||||||||||||
im |
|
|
|
|
|
|
|
|||||||||||||||||||
|
|
|
|
|
|
|
|
|
|
ii |
||||||||||||||||
|
|
LSM |
( yj=Dij) |
|
|
|
|
P ((si þ sj)=2) |
2 |
|||||||||||||||||
|
|
|
|
j¼1 |
|
|
|
|
|
|
|
Vi,j |
||||||||||||||
|
|
|
|
|
|
|
|
|
|
|
|
|
|
|
|
|
|
|
|
|
|
|
|
|
|
(6a) |
|
|
|
|
|
|
|
|
8 RG T 1=2 |
|
|
|
|
|
|
|
|
|
|
8 RG T 1=2 |
|||||||
(Di)Km ¼ 2=3 rm |
|
|
|
|
|
(Di)KM ¼ 2=3 rM |
|
|
|
|||||||||||||||||
P Mi |
|
|
|
|
|
P Mi |
||||||||||||||||||||
|
|
|
|
|
|
|
|
|
|
|
|
|
|
|
|
|
|
|
|
|
|
|
|
|
|
(6b) |
5.4Method and Scope of Model Analysis
The detailed mathematical analysis[71] yielded relations that can be regarded as a basis for assessing the efficiency of the reforming catalyst grain. The first of these related the performance of the catalyst grain as the ratio of raw material flux—q (directed to the depth of the grain) to raw material concentration (C) on the grain surface, QP=CP. The second related the diffusion resistance (referred to as diffusivity) of the grain with its measure, which is the ratio of the raw material concentration on the catalyst surface to the raw material concentration in the center of the catalyst grain, CP=C0.
In a preceding section, we analyzed the effect which the porous structure of the reforming catalyst, specifically the wide pore radius, r1 (transport macropores
in the range of 500–900 |
˚ |
˚ |
|
A and 3000–7000 A); the narrow pore radius, r2 |
|||
|
|
|
˚ |
(micropores developing the catalyst surface in the range 4–40; 100–200 A); the |
|||
proportion of wide pores |
to narrow |
pores, v (in the |
range of 0.1–0.3 for |
˚ |
|
|
˚ |
r1 ¼ 500–900 A; and in the range of 0.001–0.005 for r2 |
¼ 3000–5000 A), and |
||
the catalyst grain radius, Rg (for 0.035 and 0.05 cm), exerts on the two defined parameters characterizing the efficiency of the grain.
This was accompanied by optimization of the values of the porous structure parameters in order to upgrade the efficiency of the grain, i.e., to increase the grain performance (QP=CP) without deteriorating diffusivity (CP=C0Þ, which enables free transport of reagents in the grain (relative optimization for the assumed value of CP=C0 2:0). Then, the correlation between the parameters of
Catalyst Pore Structure |
313 |
grain efficiency (QP=CP and CP=C0) and those of the specific surface which is a function of the porous structure parameter values were analyzed.
The effect of the porous structure on the grain efficiency for a fixed kinetic scheme is determined by making use of the plots established from the algorithm.[71] Statistical analysis was used to carry out a conditional optimization which provides advantageous values of the process efficiency parameters for the adopted set of porous structure parameter values. The calculations of input data for the proposed model (kinetic and diffusion constants) (Tables 7 and 9) involved
the results of chromatographic analysis and the experimental balance,[82] as well as the algorithms described in a number of previous publications.[22,36,76]
5.5Discussion of Results Obtained from Analysis of the Mathematical Model
Effect of Porous Structure on Grain Performance
In order to determine the effect that the porous structure of the reforming catalyst exerts on the values of the grain efficiency parameters, the plots obtained from the computer simulations of transport phenomena and reactions in the catalyst grain were analyzed. Grain efficiency is found to be high when its performance, QP=CP, takes the highest possible values at a diffusivity, CP=C0, enabling free transport of the substrates in the grain. A value of CP=C0 2 was adopted as the diffusivity value that provides a relatively free transport of the reacting substances in the grain. The use of bidispersive grains enhances the process efficiency. Wide pores facilitate transport of the reacting substances into the narrow pores, with the surfaces available for the reaction.
Figures 11–15 present plots characterizing the efficiency of the grain with an Rg ¼ 0:035 (cm) radius at T ¼ 4708C. The plots relate the QP=CP (a) and CP=C0 (b) values to the radius of micropores (r2) for different ranges of the macropore radius (r1) and for different proportions of macroand micropores (v). Figures 11, 12 and 13 include calculated results for v ¼ 0:05 and for two ranges of
˚ ˚
macropore radii, 3000–7000 A (Figs. 11 and 13) and 500–900 A (Fig. 12). From Figure 11 it can be inferred that as the radius of macropores increases, performance decreases (Fig. 11a). This is an indication that the reactions in the wide pores proceed in the “pure” kinetic range. An increase in the micropore
˚
radius from 4 to 40 A produces no distinct changes in diffusivity, and there is a slight concomitant increase in performance. This suggests that the selected radius of narrow pores, r2, is too small to allow the starting compound to penetrate the
˚
pore interior. Thus, it is only the 3000-A macropore radius that brings about a comparatively distinct increase of diffusivity and performance (slope of line 1 in Fig. 11a) with the increasing radius of micropores. This indicates that the contribution of the micropores has increased and the reactions on their surfaces
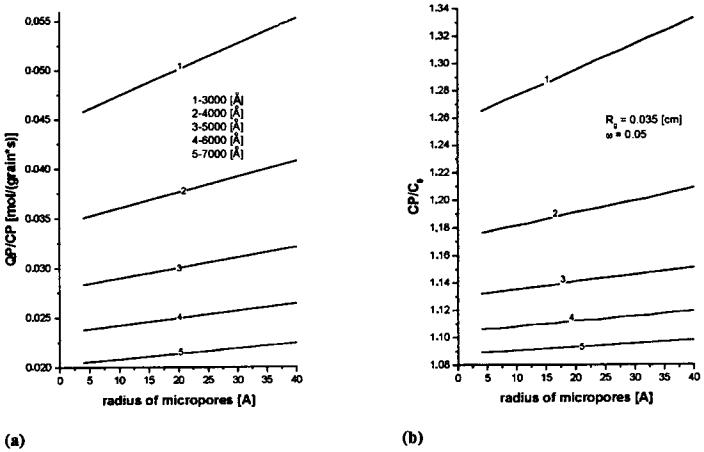
314
Figure 11 Performance (a) and diffusivity (b) of the grain related to micropore radius (r2) for various macropores (r1); T ¼ 4708C, h 1 ¼ 1.[71]
Szczygieł

Structure Pore Catalyst
Figure 12 Performance (a) and diffusivity (b) of the grain related to micropore radius (r2) for various macropores (r1); T ¼ 4708C, h 1 ¼ 1.[71]
315
316
Figure 13 Performance (a) and diffusivity (b) of the grain related to micropore radius (r2) for various macropores (r1); T ¼ 4708C, h 1 ¼ 1.[71]
Szczygieł

Structure Pore Catalyst
Figure 14 Performance (a) and diffusivity (b) of the grain related to micropore radius (r2) for various macropores (r1); T ¼ 4708C, h 1 ¼ 1.[71]
317
318 Szczygieł
have accounted for the increase in performance, as the available surface of the catalyst increases.
˚
In Figure 13 the range of micropores has been increased to 200 A, with the values of the remaining structural parameters being identical to those in Figure 11. The slopes of the performance and diffusivity curves, as well as their values, are all greater than those in Figure 11. This indicates that the contribution of micropores to the reaction in this radius range is greater, reflected not only in performance but also in diffusivity. But the values of the ratio of raw material concentration on the surface to the raw material concentration in the center of the grain are lower than the adopted limit value, which equals 2. This is an indication that the utilization of the grain is satisfactory.
˚
In Figure 12, for the macropore radius range of 500–900 A, performance is one order of magnitude greater than in the other relevant figures. The high performance has been contributed by the increased internal surface of the catalyst. The increase of the internal surface as compared to previous examples should be attributed to the presence of macropores with a smaller radius at constant porosity.
The diffusivity for these structural parameters is very high, suggesting a low degree of grain utilization. To reduce diffusivity it is advisable to increase the quantity of macropores, i.e., the value of v. Increase of the v value decreases diffusivity, but there is a concomitant decrease in grain performance, as seen in Figure 15, which relates performance and diffusivity to v (QP=CPðvÞ;
= ðvÞ r ¼ ˚ v :
CP C0 ) for the micropore radius 1 80 A. Once a value of 0 4 has been achieved, its further increase brings about a slight drop of diffusivity and a comparatively large decrease in performance.
˚
Summing up, it is seen that the use of pores with a 500 to 900-A radius to act as transport pores in the catalyst grain fails to upgrade the efficiency of the grain.
r ˚
Considering Figure 13 ( 1: 3000–7000 A), it should be noted that diffusivity has
values smaller than the limit value across the entire micropore range (r2: 0–200 ˚ A),
which is an indication that at v ¼ 0:05 the porous structure imposes no limitations to the penetration of the starting compound into the grain interior. Owing to the low diffusivity value (CP=C0 , 2), one can increase the content of micropores in the grain (decrease the value of v) in order to extend the effective surface, thus upgrading the performance of the grain. The results of simulation are plotted in Figure 14 for v ¼ 0:005. Grain performance obtained with v ¼ 0:005 is greater than that obtained with v ¼ 0:05 for diffusivities 2. Figure 14 suggests several
optimal |
values for the parameters of a porous grain structure with a radius |
||
Rg ¼ 0:005, which is to work at T ¼ 4708C. For v ¼ 0:005, one predicts |
|||
1. |
r1 |
˚ |
˚ |
¼ 3000 A; r2 |
¼ 40 A |
||
2. |
r1 |
˚ |
˚ |
¼ 4000 A; r2 |
¼ 80 A |
||
3. |
r1 |
˚ |
˚ |
¼ 5000 A; r2 |
¼ 130 A |
||
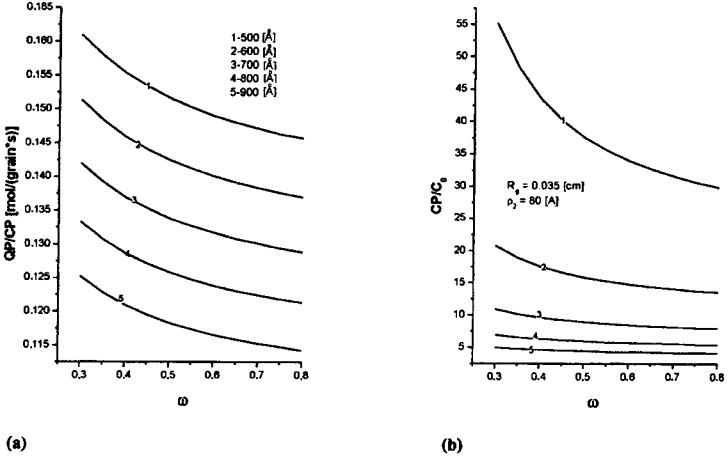
Structure Pore Catalyst
Figure 15 Performance (a) and diffusivity (b) of the grain related to quantitative ratio of wide to narrow pores (v) for various macropores (r1); T ¼ 4708C, h 1 ¼ 1.[71]
319
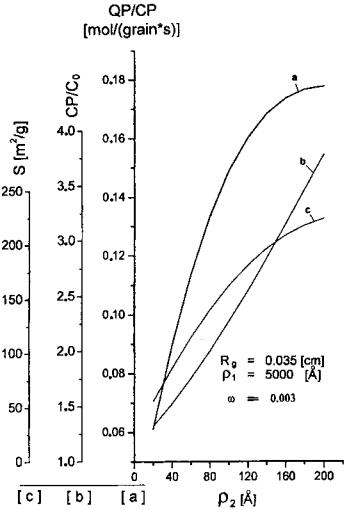
320 |
|
Szczygieł |
|
Figure 16 relates the performance, diffusivity, and specific surface of the |
|
grain |
˚ |
v ¼ 0:003), which enables an accurate |
to r2 (for r1 ¼ 5000 A and |
||
assessment of the advantageous r2 value for the remaining determined parameters. Comparing the plots of Figure 17 and Figure 13, it is seen that the performance of the grain increases with increasing grain size, but there is a concomitant increase in diffusion resistance. A rise in process temperature would allow for the increase of grain performance at the same parameters of the porous structure. However, the reactions run at a faster rate and shift the process toward diffusion limitation, so that is necessary to make another attempt in order to find
the optimal parameters for the porous structure of the grain.
Figure 16 Performance (a), diffusivity (b), and specific surface (c) of a grain as a
r r ¼ ˚ [71]
function of micropore radius 2 for macropore radius 1 5000 (A).

Structure Pore Catalyst
Figure 17 Performance (a) and diffusivity (b) of the grain related to micropore radius (r2) for various macropores (r1); T ¼ 4708C, h ¼ 1.[71]
321
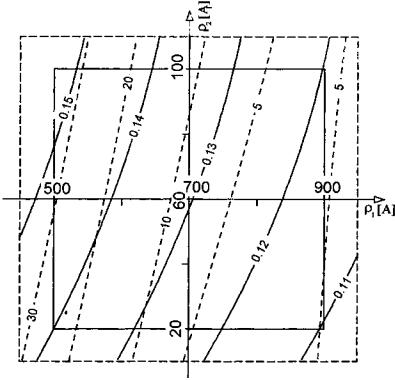
322 Szczygieł
Statistical Approach to the Results of Model Analysis
To analyze more precisely the problem of how the parameters of the porous structure affect the quantities which characterize the efficiency of the grain (Q=C, C=C0), their values were approximated (calculated from the model for 125 points, with actual T, ranges for Rg, r1, r2, and v) by polynomial equations. The equations were analyzed by transformation into the canonical form. The results of statistical analysis have been mapped. In a system of two variables, rx v or r1 r2, it is possible to examine simultaneously the variations the Q=C, C=C0 ratios. With these maps we can find the regions (ranges of variables) that fulfill the requirements of conditional optimization, i.e., maximize the performance of the grain without deteriorating the transport conditions. From the plots of
r ¼ ˚
Figure 18 we can see that in the macropore radius range 1 500–900 A, even at a high v value (high amount of macropores), grain diffusivity defined by the CP=C0 value in the investigated r1 r2 range exceeds the adopted limit value of 2. This eliminates the plots from further analysis in spite of the comparatively high performance value included there. The diffusivity values included in
Figure 18 Isolines of grain performance [QP=CP] and diffusion resistance [CP=C0] as
a function of micropore radius (r2) and macropore radius (r1); T ¼ 4708C, h 1 ¼ 1, Rg ¼ 0:035 (cm), v ¼ 0:5.[71]

Catalyst Pore Structure |
323 |
r ¼ ˚
Figure 19 ( 1 3000–7000 A) are smaller than 2 in the whole investigated range, which means that the performance of the grain can be increased by reducing the number of transport pores (by decreasing v).
5.6Conclusions
The assumptions included in the physical model simplify the real image of the catalyst grain. Even so, the conclusions drawn from the analysis of the model are not inconsistent with the available knowledge, and the model should be of utility in analyzing the bidispersive properties of the catalytic systems for different processes. With the mathematical model it is possible to analyze the effect exerted by the parameters of the porous structure on the performance of the catalyst grain and take into account any change in the kinetic schemes of the investigated processes. Based on the verification of the kinetic schemes,
Figure 19 Isolines of grain performance [QP=CP] and diffusion resistance [CP=C0] as
a function of micropore radius (r2) and macropore radius (r1); T ¼ 4708C, h 1 ¼ 1, Rg ¼ 0:035 (cm), v ¼ 0:5.[71]

324 |
Szczygieł |
the results of porous structure optimization for Scheme 2 are the most probable options for the porous structure of the catalyst grain for process of n-heptane dehydrocyclization at 4708C. The next step of the study should include experimental verification of the optimal parameters for the porous structure by incorporation during catalyst preparation.
6EXPERIMENTAL VERIFICATION OF THEORETICAL RESULTS
Pores of a small radius generate a large surface, but eventually their radii become too small to facilitate access for reagents, with the result being the surface is insufficiently utilized. It is therefore of importance to define the minimal pore radius that will facilitate such access. The value of the minimal radius affects the reaction rate–diffusion rate ratio. The numerical value of the radius can be determined experimentally by investigating the activity of catalysts that vary in their porous structure. This section has two major objectives—to determine the minimal radius for the pores that are to work in the dehydrocyclization of n-heptane under reforming conditions and to compare the minimal pore radius established experimentally with the optimal micropore radius defined theoretically.[41] Agreement between these results would corroborate the adequacy of the adopted assumptions and encourage adoption of the presented mathematical model and its use in further determination of the optimal porous structure for the reforming catalyst.
6.1Method of Analysis
To solve the problem in question, statistical methods were used for the analysis of pore size and activity. Catalytic activity was assumed to be related to the unit surface of catalysts with the same chemical composition. Therefore, it is a constant quantity and should be identical for the entire series of investigated catalysts.
A1 |
|
A2 |
|
Aj |
|
|
|
|
¼ |
|
¼ |
¼ |
|
¼ aj |
(7) |
S1 |
S2 |
Sj |
|||||
Using the results of adsorption and activity tests, the specific activities, aij, were calculated for catalysts with particular pore radii ranges. Mean-square deviations were calculated for each pore radius range.
|
|
nc |
|
|
|
aij) |
2 |
|
||
|
|
(ai |
|
|||||||
MSD |
¼ |
i¼1 |
|
(8) |
||||||
|
|
|
||||||||
|
nc |
(nc |
|
1) |
|
|
||||
|
|
|
|
|||||||
Catalyst Pore Structure |
325 |
If it is assumed that pore surface distribution as a function of radius for the investigated catalysts differs from one catalyst to another, the minimal value of MSD will be equivalent to the critical pore radius, which does not exhibit pore restriction. Knowing the radius of these limit pores and the portion of the specific surface corresponding with the pores of radius the limit pores, one can calculate catalytic activity in terms of the “working” surface unit of the catalyst. On that basis it is possible to predict, for real catalysts of a specified chemical composition, their volume activity, which is a function of the porous structure.
6.2Experimental
Preparation of Support
The support was prepared using technology developed at the Institute of Chemistry and Technology of Petroleum and Coal, Wrocław University of
Technology, which serves for the manufacture of spherical aluminum oxide supports for reforming catalysts.[87,88] There is a general resemblance between
these methods and those in patents issued to various catalyst manufacturers. The technology involves the following steps: preparation of an aluminum salt solution (by treating metallic aluminum with hydrochloric acid and nitric acid), mixing the solution with hexamine, formation and conditioning of the support. After drying, the support is subject to calcination for the removal of organic material and for conversion to an active aluminum oxide. Nine supports that varied in their porous structures were selected.
Preparation of Catalyst
The support is first contacted with rhenium from an ammonia perrhenate/2% acetic acid solution. After drying and calcination, platinum is applied from a solution made of hexachloroplatinic acid, hydrochloric acid, and acetic acid. After each operation of metal contacting, the catalyst is dried at 608C for 12 h and at 1208C for another 12 h prior to calcination according to a selected program. Pore surface within the radius range of 1.5–100 nm is determined by the method of benzene vapor adsorption (Table 11).
Activity Tests: Dehydrocyclization of n-Heptane
The tests were carried out as described in Section 3.3 with 5 cm3 bed for 1 h duration. Each catalyst tested had a grain size varying between 0.3 and 0.75 mm. The activity of the catalysts under test was assessed in terms of the process balance, which served as a basis for calculation of the activity index. The activity
326 |
Szczygieł |
Table 11 Porous Structure of the Investigated Reforming Catalyst
Pore surface in defined range of radius Si (m2/g)
No. of |
.3.33 |
.30 |
.10 |
.5 |
.3 |
.1.5 |
Composition of |
catalyst |
(nm) |
(nm) |
(nm) |
(nm) |
(nm) |
(nm) |
catalyst |
|
|
|
|
|
|
|
|
1 |
0.48 |
0.67 |
3.50 |
16.29 |
177.40 |
259.30 |
|
2 |
0.56 |
0.78 |
4.13 |
27.84 |
124.13 |
248.78 |
Support: Al2O3 |
3 |
0.55 |
0.77 |
3.80 |
19.19 |
152.41 |
241.45 |
|
4 |
0.45 |
0.89 |
2.36 |
8.60 |
202.46 |
275.70 |
Metals: |
5 |
0.40 |
0.57 |
3.47 |
1.322 |
140.74 |
267.45 |
Pt, 0.6 wt % |
6 |
0.69 |
0.97 |
5.99 |
20.46 |
165.31 |
288.74 |
Re, 0.6 wt % |
7 |
0.82 |
1.15 |
6.91 |
31.95 |
184.86 |
262.57 |
|
8 |
0.66 |
0.93 |
5.49 |
21.70 |
174.64 |
271.00 |
|
9 |
0.56 |
0.80 |
3.37 |
16.37 |
209.40 |
310.59 |
|
Source: Ref. [41].
index includes the reaction rate at which toluene forms; it is expressed in moles/sec) and is calculated as follows:
VTOL ¼ |
MTOL |
(9) |
Gc t |
Tables 12 and 13 gather the numerical values of catalyst activity and the calculated values of specific activity for defined ranges of pore radii.
6.3Analysis of Results
The results listed in Tables 11–13 serve as a basis for the analysis and assessment of the effect exerted by the porous structure of the catalyst on the dehydrocyclization of n-heptane under reforming conditions. Tables 12 and 13 gather the numerical values of catalyst activity and the calculated values of specific activity for defined ranges of pore radii. Statistical analysis was used to determine the limit (minimal) values of the pore radii at which the particles of the reagent can adsorb on the pore surface. These values are in correspondence with the minimal values of the parameter MSD (Fig. 20). The limiting radius of the “working” pores is smaller at 4708C (3 nm) than at 5108C (5 nm). This finding can be attributed to the temperature-enhanced effect of diffusion factors on the process rate. At 4708C, pores of 3-nm radius are accessible to the reagents. However, at 5108C, when the process rate depends to a great extent on the diffusion of reactants, the radius of the pores providing readily available surfaces must be increased. The average specific activity (related to unit surface) of the

Table 12 Total Activity and Specific Activity of Reforming Catalysts (4708C)
|
|
|
Specific activity in defined range of radius aij [mol/(m2 s)] |
|
|||
No. of |
Activity of catalyst |
|
|
|
|
|
|
|
|
|
|
|
|
||
catalyst |
mol/(gcat S) |
.33.3 (nm) |
.30 (nm) |
.10 (nm) |
.5 (nm) |
.3 (nm) |
.1.5 (nm) |
|
|
|
|
|
|
|
|
1 |
2.680 |
5.583 |
4.000 |
0.766 |
0.165 |
0.015 |
0.010 |
2 |
1.560 |
2.786 |
2.000 |
0.378 |
0.056 |
0.013 |
0.006 |
3 |
2.120 |
3.855 |
2.753 |
0.558 |
0.110 |
0.014 |
0.009 |
4 |
3.090 |
6.867 |
3.472 |
1.309 |
0.359 |
0.015 |
0.011 |
5 |
2.110 |
5.275 |
3.702 |
0.608 |
0.160 |
0.015 |
0.008 |
6 |
2.470 |
3.580 |
2.546 |
0.412 |
0.121 |
0.015 |
0.009 |
7 |
2.770 |
3.378 |
2.409 |
0.401 |
0.087 |
0.015 |
0.011 |
8 |
2.610 |
3.955 |
2.806 |
0.475 |
0.120 |
0.015 |
0.010 |
9 |
3.140 |
5.607 |
3.925 |
0.932 |
0.192 |
0.015 |
0.010 |
|
MSD |
199E201 |
5.81E202 |
1.06E202 |
8.61E204 |
8.31E208 |
2.64E207 |
Source: Ref. [41].
Structure Pore Catalyst
327

328
Table 13 Total Activity and Specific Activity of Reforming Catalysts (5108C)
|
|
|
Specific activity in defined range of radius aij [mol/(m2 s)] |
|
|||
No. of |
Activity of catalyst |
|
|
|
|
|
|
|
|
|
|
|
|
||
catalyst |
mol/(gcat S) |
.33.3 (nm) |
.30 (nm) |
.10 (nm) |
.5 (nm) |
.3 (nm) |
.1.5 (nm) |
|
|
|
|
|
|
|
|
1 |
3.560 |
7.42 |
5.31 |
1.02 |
0.22 |
0.02 |
0.01 |
2 |
6.080 |
10.86 |
7.79 |
1.47 |
0.22 |
0.05 |
0.02 |
3 |
4.180 |
7.60 |
5.43 |
1.10 |
0.22 |
0.03 |
0.02 |
4 |
1.870 |
4.16 |
2.10 |
0.79 |
0.22 |
0.01 |
0.01 |
5 |
2.880 |
7.20 |
5.05 |
0.83 |
0.22 |
0.02 |
0.01 |
6 |
4.460 |
6.46 |
4.60 |
0.74 |
0.22 |
0.03 |
0.02 |
7 |
6.960 |
8.49 |
6.05 |
1.01 |
0.22 |
0.04 |
0.03 |
8 |
4.730 |
7.17 |
5.09 |
0.86 |
0.22 |
0.03 |
0.02 |
9 |
3.560 |
6.36 |
4.45 |
1.062 |
0.22 |
0.02 |
0.01 |
|
MSD |
3.57E201 |
2.50E201 |
5.43E203 |
1.48E208 |
1.52E205 |
4.50E206 |
Source: Ref. [41].
Szczygieł

Catalyst Pore Structure |
329 |
Figure 20 Standard deviation of specific activity for the investigated catalysts vs. different ranges of pore radii at (a) 4708C, (b) 5108C.[41]
330 |
Szczygieł |
0.6 wt % Pt/0.6 wt % Re catalysts is 0.015 mol/(m2 s) and 0.218 mol/(m2 s) at 4708C and 5108C, respectively.
6.4Conclusions
The minimal radius of pores with surfaces accessible to reagents in the reaction of
˚ |
˚ |
n-heptane dehydrocyclization is found to be 30 A at 4708C and 50 A at 5108C. |
|
Statistical analysis of results substantiates the |
conclusions derived in |
Section 5, thus corroborating the assumptions in that section as well as the mathematical model. It follows that one can use the assumptions and the same model when analyzing and optimizing the porous structure of a reforming catalyst that is to process starting compounds other than n-heptane.
Knowing the chemical composition, the specific activity (related to unit surface), and the pore structure of the catalyst, one can determine its activity related to unit volume. If one knew the relationship between the conditions of catalyst preparation and the porous structure of the catalyst, as well as the relation between chemical composition and specific surface activity, one could then produce a catalyst of the desired volume activity.
NOTATION
aj ai
aij
CP, CN, CA, GG
Dim, Dik
Diov, Dief
Dim, DiM
Dij
ðDiÞKm; ðDiÞKM
d, dmg Fj
¼specific activity of jth catalyst; [mol/(m2 s)].
¼mean value of specific activity for a given series of catalyst in a defined ith range of pore radii; [mol/(m2 s)].
¼specific activity for jth catalyst, calculated in a defined ith range of pore radii; [mol/(m2 s)].
¼concentration of paraffins, naphthenes, aromatics, and gases; [mol/cm3].
¼coefficient of molecular diffusion and Knudsen diffusion for the ith component of reaction mixture; [cm2/s].
¼overall coefficient of diffusion and effective coefficient of diffusion for the ith component of reaction mixture; [cm2/s].
¼overall coefficient of diffusion for the ith component in micropores and macropores; [cm2/s].
¼coefficient of diffusion of the ith component for a twocomponent system i,j; [cm2/s].
¼coefficient of Knudsen diffusion for the ith component in micropores and macropores; [cm2/s].
¼grain diameter and micrograin diameter; [cm].
¼jth grain layer.
Catalyst Pore Structure |
331 |
|
fM, f m, fg |
¼ utilization factor for macropores, micrograins, and catalyst |
|
|
grain. |
|
Gc |
¼ catalyst weight; [g]. |
|
h0, f0 |
¼ dimensionless Thiele modulus and efficiency of |
|
|
monodispersive catalyst surface utilization. |
|
Kexp, Ki |
¼ experimental rate constant per gram of catalyst [cm/m3/ |
|
|
(g s)] and rate constant per surface of catalyst; [cm/s]. |
|
ki |
¼ reaction rate constants; [1/s]. |
|
l¼ length of pore; [cm].
Mi |
¼ molecular weights of group components. |
Mtol |
¼ mole fraction of toluene in liquid reaction product. |
MSD |
¼ mean-square deviations. |
m1ð jÞ |
¼ number of macropores in the grain layer Fj. |
m2ð jÞ |
¼ number of micropores in the grain layer Fj. |
n¼ number of layers in the grain.
nc |
¼ number of catalysts tested. |
P, Pc |
¼ pressure and critical pressure; [atm]. |
R¼ radius of experimental region.
RG |
¼ gas constant; [erg/K]. |
Rg |
¼ radius of grain; [cm]. |
rM, rm |
¼ mean macropore and micropore; [cm]. |
S¼ specific surface of the catalyst; [m2/g].
Sj |
¼ “working” surface of jth catalyst; [m2/8g]. |
T, Tc |
¼ temperature and critical temperature; [ C], [K]. |
yi |
¼ mole fractions of group components. |
q¼ feed stream; [mol/s].
qi |
¼ feed stream for the ith component; [mol/s]. |
|
|
VTOL |
¼ rate of toluene-producing reaction; [mol/(g s)]. |
3 |
|
VM, Vm |
¼ volume per gram of macropores, micropores; [cm |
/g]. |
|
t¼ time; [s].
V¼ collision integral.
F¼ dimensionless modulus made up of experimental data.
Fm, FM |
¼ modulus for microporous grain and entire grain. |
1M, 1m |
¼ macroporosity of grain, microporosity of grain. |
s, 1=k |
˚ |
¼ Lennard–Jones force constants; [A], [K]. |
v¼ ratio of number of wide pores (macropores) to number of narrow pores (micropores).
x¼ porosity.
r |
˚ |
˚ |
¼ radius of pore; [A]. |
||
r1 |
¼ radius of wide pores (macropores); [A]. |
|
r2 |
|
˚ |
¼ radius of narrow pores (micropores); [A]. |
||
h |
¼ coefficient of increase of catalyst surface utilization. |
|
332 |
Szczygieł |
ACKNOWLEDGMENTS
This study was carried out under KBN Grant No. 300359101. This chapter is dedicated to the memory of my mother.
REFERENCES
1.Becker, E.R.; Pereira, C.J. Eds. Computer-Aided Design of Catalysts; Marcel Dekker: New York, 1993.
2.Hegedus, L.L. Ed. Catalyst Design; John Wiley and Sons: New York, 1987.
3.Antos, G.J.; Aitani, A.A.M.; Parera, J.M. Catalytic Naphtha Reforming: Science and Technology; Marcel Dekker: New York, 1995.
4.Little, D.M. Catalytic Reforming; PennWell Publishing: Tulsa, OK, 1985.
5.Joffe, I.I.; Reshetov, V.A.; Dobrotvorskii, A.M. Raschetnye Metody v PrognozirOvanii Aktivnosti Geterogennykh Katalizatorov; Khimiya: Leningrad, 1977.
6.Radomyski, B.; Szczygieł, J.; Marcinkowski, M. Przemysł Chemiczny 1986, 65 (7), 352.
7.Radomyski, B.; Szczygieł, J.; Marcinkowski, M. Przemysł Chemiczny 1986, 65 (8), 423.
8.Radomyski, B.; Marcinkowski, M.; Szczygieł, J. Nafta 1984, 2, 65.
9.Thiele, E.W. Ind. Eng. Chem. 1939, 31, 916.
10.Thomas, J.M.; Thomas, W.J. Principles and Practice of Heterogeneous Catalysis; VCH: Weinheim, 1996.
11.Hosten, L.; Froment, G.F. Ind. Eng. Chem. Proc. Des. Dev. 1971, 10, 280.
12.Marin, G.B.; Froment, G.F. Chem. Eng. Sci. 1982, 37, 759.
13.Van Trimpont, P.A.; Marin, G.B.; Froment, G.F. Appl. Catal. 1986, 24, 53.
14.Van Trimpont, P.A.; Marin, G.B.; Froment, G.F. Ind. Eng. Chem. Res. 1988, 27, 51.
15.Marin, G.B.; Froment, G.F. Proc. 1st Kuwait Conf. Hydrotreating Processes, EFCE Public. Ser. 27(II), 1989.
16.Wheeler, A. Adv. Catal. 1951, 3, 249.
17.Wakao, N.; Smith, J.M. Chem. Eng. Sci. 1962, 17, 825.
18.Mann, R.; Thomson, G. Chem. Eng. Sci. 1987, 42, 555.
19.Szczygieł, J. Comput. Chem. 2000, 24, 203.
20.Johnson, M.F.L.; Steward, W.E. J. Catal. 1965, 4, 248.
21.Keil, F.J. Catal. Today 1999, 53, 245.
22.Szczygieł, J. Comput. Chem. 1999, 23, 121.
23.Wheeler, A. Adv. Catal. 1950, 3, 250.
24.Zhang, L.; Seaton, N.A. Chem. Eng. Sci. 1994, 49 (1), 41.
25.Johnson, M.F.L.; Steward, W.E. J. Catal. 1965, 4, 248.
26.Feng, C.; Steward, W.E. Ind. Eng. Chem. Fund. 1973, 12 (2), 143.
27.Keil, F.J.; Rieckmann, C. Chem. Eng. Sci. 1994, 49, 4811.
28.Coppens, M.O.; Froment, G.F. Chem. Eng. Sci. 1995, 50, 1013.
29.Coppens, M.O.; Froment, G.F. Chem. Eng. Sci. 1995, 50, 1027.
30.Coppens, M.O.; Froment, G.F. Chem. Eng. Sci. 1994, 49, 4897.
Catalyst Pore Structure |
333 |
31.Coppens, M.O.; Froment, G.F. Chem. Eng. Sci. 1996, 51, 2283.
32.Coppens, M.O.; Froment, G.F. Chem. Eng. J. 1996, 64, 69.
33.Coppens, M.O. Catal. Today 1999, 53, 225.
34.Szczygieł, J. Inz˙ynieria Chemiczna i Procesowa 1997, 4, 693.
35.Szczygieł, J. Inz˙ynieria Chemiczna i Procesowa 1992, 3, 489.
36.Szczygieł, J. Inz˙ynieria Chemiczna i Procesowa 1998, 3, 621.
37.Reys, S.; Jensen, K.F. Chem. Eng. Sci. 1985, 40 (9), 1723.
38.Hollewand, M.P.; Gladden, L.F. Chem. Eng. Sci. 1992, 47 (7), 1761.
39.Sahimi, M.; Gavvalas, G.R. Chem. Eng. Sci. 1990, 45 (6), 1443.
40.Burghardt, A.; Rogut, J.; Gotkowska, J. Chem. Eng. Sci. 1988, 43 (9), 2463.
41.Szczygieł, J. Inz˙ynieria Chemiczna i Procesowa 2000, 21, 533.
42.Larraz, R. Hydrocarbon Proc. 1999, (July), 69.
43.DeLancey, G.B. Chem. Eng. Sci. 1974, 29, 1391.
44.Hegedus, L.L. Ind. Eng. Chem. Prod. Des. Dev. 1980, 19, 533.
45.Pereira, C.J.; Kubsh, J.E.; Hegedus, L.L. Chem. Eng. Sci. 1988, 43 (8), 2087.
46.Keil, F.J.; Rieckmann, C. Hung. J. Ind. Chem. 1993, 21, 277.
47.Boreskov, G.K. Khim. Prom. 1947, 9, 253.
48.Dyrin, W.G.; Levinter, M.E.; Loginova, A.N. Neftekhimiya 1976, XVI (2), 215.
49.Slinko, M.G.; Malinovskaya, O.A.; Beskov, B.C. Khim. Prom. 1967, 9, 1.
50.Beskov, V.; Flokk, V. Modelling of Catalytic Processes and Reactors; Khimiya: Moskva, 1991 (in Russian).
51.Johnson, M.F.L.; Steward, W.E. J. Catal. 1965, 4, 248.
52.Wijngaarden, R.J.; Kronberg, A.; Westerterp, K.R. Industrial Catalysis: Optimizing Catalyst and Processes; Wiley-VCH: Weinheim, 1998.
53.McGreavy, J.S.; Andrade, K.; Rajagopal, K. Chem. Eng. Sci. 1992, 47 (9–11), 2751.
54.Ancheyta-Juarez, J.; Villafuerte-Macias, E. Energy Fuels 2000, 14, 1032.
55.Rieckmann, C.; Diren, T.; Keil, F.J. Hung. J. Ind. Chem. 1997, 25, 137.
56.Rassev, S.D.; Ionescu, C.D. Reformowanie Katalityczne Benzyn; WNT: Warszawa, 1965.
57.Maslanskii, G.N.; Shapiro, R.N. Kataliticheskii Riforming Benzinov; Leningrad, 1985.
58.Zhorov, J.M. Modelowanie Proceso´w Przero´bki Ropy Naftowej; WNT: Warszawa, 1982.
59.Krane, H.G.; Groh, A.B. Proceedings of the Fifth World Petroleum Congress, New York, 1959, Sec. III, p. 39.
60.Smith, I.M. Chem. Eng. Prog. 1959, 55 (6), 76.
61.Dorozhov, A.P. Moskva, 1971; PhD thesis.
62.Zhorov, J.M.; Panchenkov, G.M. Kinetika i Kataliz 1967, 8, 658.
63.Zhorov, J.M.; Shapiro, I.J. Khem. Techn. Topliv i Masel 1973, 4, 1.
64.Kmak, W.S.; Stuckey, A.N. AIChE National Meeting; New Orleans; March 1973; Paper No. 56a.
65.Joffe, J.J. Neftekhimiya 1980, 2, 225.
66.Rabinovilsch, J.P.; et al. Khimija i Khimicheskaya Technol. 1983, 2, 214.
67.Ramage, M.P.; Graziani, K.R.; Krambeck, F.J. Chem. Eng. Sci. 1980, 35, 41.
68.Ramage, M.P.; Graziani, K.R.; Schipper, P.H.; Krambeck, F.J.; Choi, B.C. Adv. Chem. Eng. 1987, 13, 193.
334 |
Szczygieł |
69.Joshi, P.V.; Klein, M.T.; Huebner, A.L.; Leyerle, R.W. AIChE National Meeting; March 1997, Paper No. 133d.
70.Dennis, J.E.; Woods, D.J. New Computing Environments: Microcomputers in Large Scale Computing; Wouk, Ed.; SIAM, 1987; 116 pp.
71.Szczygieł, J. Computers & Chemical Engineering (submitted).
72.Sokolov, V.; Zaidman, N. React. Kinet. Catal. Lett. 1976, 6 (3), 329.
73.Froment, G.F.; Bischoff, K.B. Chemical Reactor Analysis and Design; John Wiley and Sons: New York, 1990.
74.Zeldovich, B. Zhur. Fiz. Khim. 1939, 13, 163.
75.Przezeckii, S. Zhur. Fiz. Khim. 1947, 21, 1019.
76.Szczygieł, J. Energy Fuels 1999, 13, 29.
77.Satterfield, Ch.N.; Sherwood, T.K. The Role of Diffusion in Catalysis; AddisonWesley: London, 1963.
78.Wilke, C.R. Chem. Eng. Progr. 1950, 46, 95.
79.Hirschfelder, J.; Curtiss, F.; Bird, R. Molecular Theory of Gases and Liquids; John Wiley and Sons: New York, 1954.
80.Reid, R.C.; Sherwood, T.K. The Properties of Gases and Liquids; McGraw-Hill: New York, 1958.
81.Montarnal, P. The porous structure of catalyst and transport processes in heterogeneous catalysis. 4th International Congr. Catal., Symposium III Novosibirsk, 1970.
82.Szczygieł, J. KBN Grant No. 300359101, 1993.
83.Davies, O.L. Design and Analysis of Industrial Experiments; Oliver and Boyd: London, 1967.
84.Hoerl, A.E. Chem. Eng. Progr. 1959, 55 (11), 69.
85.Boreskov, G.K. Geterogennyi Kataliz; Nauka: Moskva, 1986.
86.Malinovskaya, A.; Boreskov, G.K.; Slinko, M.G. Modelirowanie Kataliticheskikh Processov na Poristikh Zernakh; Nauka: Moskva, 1975.
87.Pat. Pol. 234698 (1983).
88.Grzechowiak, J.; Radomyski, B.; Marcinkowski, M. Przem. Chem. 1984, 63, 135.
8
The New Generation of
Commercial Catalytic Naphtha-Reforming Catalysts
George J. Antos, Mark D. Moser, and Mark P. Lapinski
UOP, LLC
Des Plaines, Illinois, U.S.A.
1INTRODUCTION
Catalytic reforming maintains its position as a major process in the petroleum refinery. Catalytic naphtha reforming and fluid catalytic cracking are the backbone processes for the production of high-octane gasoline for automotive use. Catalytic reforming also provides a key link between the refining and petrochemical industries through its effective production of aromatics. The high concentration of aromatics in reformate offers high octane ratings, and is a rich source of benzene, toluene, and, particularly, xylenes. The hydrogen produced is a valuable coproduct, particularly as the demands for hydroprocessing in the refinery increase.
The importance of the naphtha reforming process in the refinery in and of itself would generate continuous evolution of the technology. These improvements would be observed in both the processing and equipment pieces of the technology, as well as the catalyst component. The development of the technology through the early 1990s was covered in Chapter 15[1] and in Chapter 13[2] of the first edition. Since publication of the first edition, new drivers for technology evolution have surfaced. Popular concerns for actions on environmental issues have led to a worldwide series of environmental regulations and clean-fuel legislation. Gasoline properties, such as sulfur content, oxygenate content, benzene content, and vapor pressure, have varying levels of restrictions placed on them, all of which have an impact on the reforming operation and the
335
336 |
Antos et al. |
margins available to the refiner. In general, the reformer needs to produce greater quantities of higher octane product.
The second driver is the need to increase profitability by the refiner. Recent analyses have indicated a typical return on capital in the European refining sector of around 4%, compared to 15–20% for highest performing companies.[3,4] This is to be achieved against largely negative market factors such as crude availabilities, crude prices, shifting fuel markets, legislation, a worldwide economic slowdown, and international turmoil. Increasing capacity with newunit construction to meet local demands for octane barrels frequently does not have enough payback to be an acceptable approach. Thus, maximizing existing asset utilization becomes the strategy employed by the refiner.
Reforming technology vendors have responded. One of the most utilized improvements to naphtha reforming technology that enables the refiner to maintain or increase margins or to respond to market demands with existing assets is to employ new catalysts. Many examples of improvements to the flexibility and profitability of the refiner using catalysts, or catalyst and revamp combinations, are in the literature.[5 – 8] This chapter extends beyond the catalyst improvements in the first edition[1] to include commercial catalysts available from the main reforming catalyst vendors. Some of these catalysts have been developed to alleviate process issues, which are discussed in Chapter 11 of this edition. This chapter complements the process improvement discussions in Chapter 13 of this edition. The organization of the chapter is according to the usual alignment in the naphtha reforming process. Semiregenerative unit catalysts are treated first followed by cyclic unit and continuous-regeneration unit catalysts. Zeolitic catalysts are reviewed last. Some mention of revamp opportunities and process modifications that assist the refiner are included at various points.
2SEMIREGENERATIVE REFORMING CATALYSTS
The first platforming units, commercialized in 1949, were designed as semiregenerative (SR) or fixed-bed units, employing monometallic Pt on alumina catalysts. Semiregenerative reforming units are periodically shut down to regenerate the catalyst. To maximize the length of time (cycle) between regenerations, these early units were operated at high pressures in the range of 2760–3450 kPa (400–500 psig). The high reactor pressure minimizes deactivation by coking. Typically, the time between regenerations is a year or more. The platforming process was improved through introduction of platinum–rhenium catalysts to SR reforming units in 1968.[9] These catalysts enabled a lower pressure, higher severity operation: about 1380–2070 kPa (200–300 psig) at 95
New Generation of Naphtha-Reforming Catalysts |
337 |
to 98 octane while maintaining typical cycle lengths of one year. The Pt-Re catalyst has proven to be reliable and easily regenerable, making it the primary catalyst in use today.
The cycle length of a semiregenerative reforming unit can be determined in a number of ways. It can be defined as a ‘normal temperature cycle’ of 30–408F of catalyst activity loss that usually represents 0.5–1.0% C5þ yield decline. Some refiners may choose to operate to a greater decline in yield in order to obtain a longer run length. Other refiners may dictate run length based on a turnaround schedule, regardless of whether the catalyst has reached the end of run based on a temperature cycle. Refiners that are temperature limited may define the end of cycle when the reactor temperatures reach the maximum reactor design temperature limits. Therefore, high activity, excellent temperature stability, and yield stability are important to obtain long run length and high average yields over the cycle.
The early, monometallic Pt semiregenerative catalysts are much less stable than modern Pt-Re bimetallic catalysts. Figure 1 shows the relative performance for Pt and Pt-Re catalysts. The rhenium is proposed to lengthen cycle length by reducing the deactivating effect of coke on the platinum. This is either by
hydrogenating the coke to a less graphitic species[10] or cracking the coke precursors.[11] The stability of the Pt-Re catalyst roughly correlates with the Re/Pt
ratio over a limited range of values. An additional component, usually sulfur, is added to reduce the amount of metal activity for the Pt-Re catalysts.[12] This increases the liquid product yield and, depending on conditions, may impact stability. More recent work, described below, has used additional components other than, or in addition to, sulfur and claimed additional benefits.
The semiregenerative catalytic reformer remains one of the most critical units in today’s refineries. More than 500 units are operating worldwide, producing approximately 5 million BPSD of reformate. This large installed capital base presents the opportunity for refiners to increase their profits by maximizing the utilization of these existing assets. However, most semiregenerative reforming units are older designs that have been revamped over the years to push the operating parameters to the limit so as to maximize throughput and yields. The older designs may also have lower mechanical design temperature limits than newer reforming units. Given the limitations of the units, improvements have focused on:
. Improved reformate, aromatic and hydrogen yields
. Increased activity and stability to allow increased octane or throughput
. Lower cost of catalyst
The semiregenerative catalyst may be regenerated multiple times before a new load of catalyst is required. At the end of a catalyst’s life, it may be
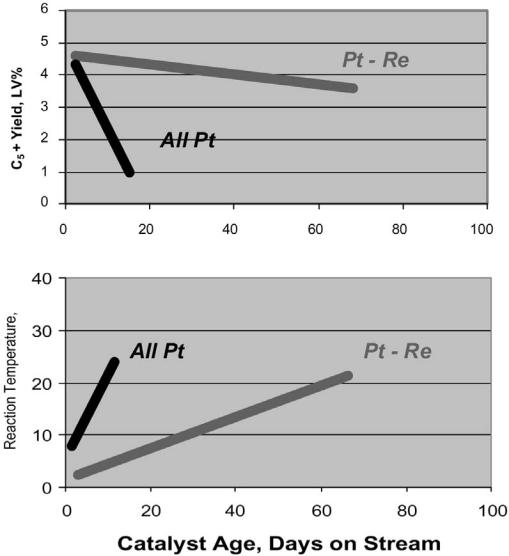
338 |
Antos et al. |
Figure 1 Comparison of process performance for Pt and Pt-Re catalysts.
difficult to completely rejuvenate the catalyst to fresh performance due to low surface area, resulting in lost gasoline yield and short run lengths. In many circumstances, a refiner may consider new catalyst prior to the end of a catalyst’s useful life in order to improve process economics. The availability of new catalysts with better activity, yields, and stability may make it attractive to reload with a new catalyst. A change in process requirements to more severe conditions for increased hydrogen production or higher octane may also lead a refiner to consider a reload to a catalyst that maximizes yield, activity, and stability.
New Generation of Naphtha-Reforming Catalysts |
339 |
2.1Recent Semiregenerative Catalyst Developments
The desire to increase yields has led Axens to introduce the RG 582 and, more recently, the RG 682 catalysts.[13] The RG 582 catalyst is equal weight percents of platinum and rhenium on an alumina extrudate to which a third component is added to reduce Pt and Re hydrogenolysis activity. Relative to the equal-metals
Pt-Re catalyst, the yield of C5þ product for the trimetallic RG 582 is 1 wt % greater and the cycle length is 0–7% less.[14]
The RG 682 catalyst uses the same promoter as RG 582 but has a higher Re/Pt ratio. The trimetallic RG 682 catalyst is 0.6 and 0.06 wt % more selective for C5þ and hydrogen products, respectively, and is more stable and active than RG 582.
Criterion also has a higher Re/Pt ratio catalyst, PR-29. The support has been modified to increase selectivity and maintain cycle length.[15] More recently, Criterion proposed the use of an equal-metals Pt-Re catalyst, PR-11, in the initial reactors of a semiregenerative unit, to provide increased C5þ and hydrogen yield in a catalyst system called ‘staged loading’.[16]
In 1994, UOP introduced a staged loading concept with the use of an R-72
catalyst in the initial reactors of a semiregenerative unit, followed by a Pt-Re catalyst in the latter reactors.[17,18] In 2000, UOP introduced a modified extrudate
support for Pt-Re catalysts, with a resultant increase of C5þ selectivity by 1 wt % while maintaining cycle length. This support is 15% lower in density than previous Pt-Re catalysts, saving in the weight of catalyst loaded in the reactors and reducing the amount and cost of Pt and Re that is used. The catalysts are available with equal-metals concentrations, R-88, or higher ratio Re/Pt, R-86.[19]
The trends in semiregenerative catalysts that have emerged in recent years are the addition of a third component to reduce Pt and Re hydrogenolysis activity, the modification of support acidity to decrease cracking, the use of multiple catalysts in a reforming unit in the concept called staged loading, and a reduction in the density of the catalyst to decrease catalyst cost. The advances have been driven by the need to improve process economics without additional capital investment. Typically, these units are at the maximal severity achievable while maintaining an acceptable catalyst life.
2.2Process Improvements
The economics of the semiregenerative process unit are typically inferior to that of a continuous reforming unit. Therefore, it is difficult to justify substantial capital investments other than the conversion to a continuous reforming unit. There are instances, however, where smaller capital investments can be justified. Unit modifications designed at improving the flow characteristics and additives used to increase cycle length have been proposed.
340 |
Antos et al. |
Axens has provided a refractory composite cover for the top of a radial flow catalyst bed since 1992.[13] The claimed benefits due to improved flow dynamics are increased activity from better utilization of the existing catalyst, reduced pressure drop, and reduced catalyst loading time. UOP has offered a coverless deck design that claims similar benefits. Conoco-Phillips is offering an improved regeneration procedure and the use of a proprietary additive that is claimed to reduce coking and increase the time between semiregenerative catalyst regenerations by 25%.
2.3Conclusion
Significant process changes in semiregenerative reforming are unlikely to occur due to the more favorable economics of conversion of these units into CCR platforming units.[8] However, the large installed operating capacity of more than 500 semiregenerative units assures that research and development will continue to improve the economics through advances in catalysts and process modifications. In fact, increased competition among catalyst vendors has accelerated the introduction of improved catalysts in recent years. Semiregenerative reforming will remain a primary process in refineries for many years to come.
3REGENERATIVE REFORMING PROCESSES AND CATALYSTS
3.1Cyclic and Continuous Units
The two general types of fully regenerative reforming processes are cyclic and continuous. In both types, a portion of partially aged reforming catalyst is taken from the process and regenerated in a regeneration system and a portion of freshly regenerated catalyst is returned to the process. The on-process catalyst train is maintained in a less deactivated state, resulting in increased activity and no losses in yield as is typically experienced in semiregenerative units when deactivating coke levels become high during a cycle (typically 6–18 months).
By removing coke and maintaining high activity, regenerative units can operate at lower pressures which leads to large increases in C5þ, aromatic, and hydrogen yields. Regenerative units can also recover quickly from upsets such as a compressor trip or a feed upset, which lead to increased coke on the catalyst. For a semiregenerative unit, the increased coke level can drastically shorten the catalyst cycle length or terminate the run.
Cyclic units utilize a swing reactor to substitute for one of the on-line process reactors while that reactor is regenerated in a separate regeneration system. The regeneration sequence and regeneration time are key factors in keeping the coke level low on all reactor positions. The lead reactors are
New Generation of Naphtha-Reforming Catalysts |
341 |
regenerated less often because the large endotherm in those reactor positions leads to lower coke production. The tail reactors have smaller endotherms and are at higher average bed temperatures, which leads to more rapid coking. The tail reactors therefore need to be regenerated more frequently. The total time to regenerate is also an important variable since longer regeneration times result in higher buildup of coke in the reactors that are processing naphtha. The regeneration time can vary from 16 to 72 or more hours for different units. Short regeneration times are essential for operations under conditions that lead to a high rate of deactivation, such as with low pressures, low hydrogen/hydrocarbon ratios, high temperatures, heavy feeds, and monometallic Pt catalysts.
Continuous units move reforming catalyst in spherical form continuously through the reactor train and back and forth between the reactor system and the regenerator system. UOP’s CCR platforming process utilizes a stacked-reactor design.[20] The catalyst flows gently by gravity downward from reactor to reactor, which minimizes attrition. After moving through the last reactor, the catalyst flows to a collector vessel and is lifted by nitrogen or hydrogen gas to a catalyst hopper above the regeneration tower. Catalyst then flows to the regeneration tower where it is coke-burned and then reoxychlorinated in separate zones. The regenerated catalyst is returned to the top of the reactor section via a similar system as the reactor-to-regenerator transfer. The Axens Octanizing and Aromizing processes move catalyst between each reactor and to/from the regenerator system via lift gas.[2]
Continuous units have been very successful due to their abilities to operate at very low pressures and produce high octanes and increased hydrogen, C5þ, and aromatic yields. As of 2003, UOP has 175 CCR platforming units operating around the world and Axens has more than 50 licenses awarded for Octanizing.[21] The combination of high octanes, excellent product selectivities, favorable economics, and continual process and catalyst improvements has made continuous units the most favorable for new constructions. Additional process details may be found in[2] and Chapter 13 of this edition.
3.2Catalyst Advances
The objectives for improved catalysts include improved octane, higher gasoline volume, improved aromatic yields and selectivities, and maximal hydrogen production. Long catalyst life is important in order to maximize the time on stream. Specifically for cyclic units, high surface area stability is desired, whereas for continuous moving-bed operations, both high surface area stability and low catalyst attrition are desired. Due to clean-fuel regulations, lower benzene is important for gasoline blending. For reformate used as a petrochemical feedstock, enhanced production of benzene, toluene, and especially xylene (BTX), is advantageous. Specific catalyst advances for cyclic and continuous units will be discussed below.
342 |
Antos et al. |
Cyclic Catalysts
The original advantages of cyclic units with monometallic platinum catalysts compared to semiregeneration units operating with monometallic catalysts were the higher yields and octanes from operating at lower pressures.[22] With the introduction of Pt-Re bimetallic catalysts in 1968,[9] semiregeneration units could be run at lower pressures and higher severities due to the high activity and stability of the bimetallic catalysts. Pt-Re catalysts were utilized in cyclic units as well, allowing even lower pressure operations; however, revamp costs to operate at lower pressures were substantial for some units.
In addition to monometallic Pt and bimetallic Pt-Re catalysts, bimetallic platinum-tin (Pt-Sn) and various trimetallic catalysts have been used in cyclic service. Some units run a combination of different types in different reactor positions; for example, a Pt-only catalyst may be run in the lead position with Pt-Re in the remaining positions. The Pt-only catalyst in the lead position guards against sulfur upsets, which would more severely deactivate a Pt-Re catalyst. An example of a trimetallic catalyst that has been used in cyclic service is the Axens RG582. Some cyclic units do not utilize Pt-Re catalysts due to difficulties of sulfiding the Pt-Re catalysts after catalyst regeneration and/or due to high feed
sulfur levels. For listings of the reforming catalyst offerings from the various vendors, see[23,24] and Chapter 13 of this edition.
Due to the frequent regenerations, especially in the tail positions, surface area stability is an important factor in maintaining long catalyst life. In addition, some cyclic units experience temperature excursions during coke burning, during reduction when using recycle gas, and/or when returning a reactor back to process. Large temperature excursions can lead to alumina phase transitions that convert g into the u and a phases that are less desired catalytically. Criterion’s catalysts such as P-93, P-96 (Pt-only), and PR-9 (Pt-Re) were designed to be hydrothermally stable for frequent regenerations with little surface area loss. The catalyst supports were modified to inhibit paraffin cracking, potentially providing higher hydrogen and reformate yields.[25] UOP has recently developed new catalysts, R-85H (Pt-only) and R-88H (Pt-Re), specifically for cyclic service with enhanced C5þ yields, enhanced surface area stability, and increased resistance to alumina phase transitions. Figure 2 shows a significant reduction in phase transitions as a function of the hydrothermal severity for the R-88H catalyst as compared to the R-88 catalyst.
Continuous Catalysts
Continuous catalysts today are mainly bimetallic Pt-Sn on chlorided alumina in spherical form. The advantages include increased activity and selectivity to aromatic formation during paraffin dehydrocyclization, decreased rate

New Generation of Naphtha-Reforming Catalysts |
343 |
Figure 2 UOP’s cyclic catalyst showing increased resistance of g-alumina phase transitions to u-alumina from hydrothermal treatments.
of deactivation vs. Pt-only catalysts, ability to attain a high degree of Pt dispersion, and resistance to agglomeration.[26 – 28] All of the major vendors have come out with new catalysts to improve process performance and/or operations.
Axens has improved their continuous catalysts by stringent control in manufacturing of the Pt and Sn distributions throughout the catalyst particle. The focus is to provide ‘nanoscale’ control of the homogeneity of the metallic phase. New preparation techniques for controlling the surface reaction of the tin precursor were developed. This is reported to increase activity and C5þ yields and decrease coke production for the new RG401 and RG405 catalysts vs. the RG200 series catalysts. In addition, two new catalysts, AR-501 and AR-505, were developed and commercialized for aromatics production with the objective
of optimizing the catalysts for pressure. For example, AR-501 was optimized for low-pressure units.[28] Both new catalysts require less Pt metal than earlier AR
series catalysts.[29]
In 1998, Criterion introduced the PS-40 catalyst. It was specifically designed to reduce paraffin cracking and coke production. Compared to Criterion’s older continuous catalyst, PS-10, the PS-40 catalyst gives higher C5þ yields, higher hydrogen yields, and lower coke. Criterion’s catalysts include new manufacturing methods for distributing metals and acidity modification of the alumina support. In addition, the alumina support was designed to reduce attrition losses and increase the surface area stability. The Pt level in PS-40 is
0.30 wt %, and a higher Pt catalyst version, PS-30, is also offered, at 0.375 wt %
Pt.[30,31]
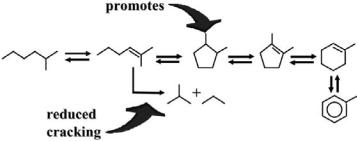
344 |
Antos et al. |
UOP commercialized the R-230 series catalysts in 2000. The catalyst support structure was modified through new manufacturing techniques that resulted in improved catalyst strength, and the acid–metal balance was optimized for improved performance characteristics. Compared to the R-130 series catalysts, the R-230 series catalysts provide a C5þ yield benefit of 0.5–0.7 wt %, a hydrogen benefit of 35 scf/b, and a coke reduction of 20–25%. Two versions are offered: R-232 catalyst with 0.375 wt % Pt and R-234 catalyst with 0.29 wt % Pt. Based on existing R-234 catalyst commercial operations, the ultimate life of the new catalysts are expected to be equal or better than the high-stability R-130 series catalysts.[5,7]
UOP has built on the R-230 series technology by modifying the acidity to decrease the paraffin cracking which increases the selectivity to ring closure reactions. This results in higher C5þ, aromatic, and hydrogen yields for the new R-270 series catalysts. Figure 3 illustrates how the reaction network is modified. Two versions are offered, R-272 catalyst with 0.375 wt % Pt and R-274 catalyst with 0.29 wt % Pt. The R-274 catalyst was commercialized in 2002 and offers
1–2 lv % increase in C5þ product yield, a 5% increase in hydrogen production, and reduced coke production by 25–40% as compared to R-134 catalyst.[32]
The catalyst also shows increased total and C8 aromatic yields. The highest yield benefits can be attained with lower endpoint feeds, leaner feeds and higher severity operation. The surface area stability and strength are equivalent to those of the R-230 series catalysts.[8]
3.3.Regenerator Advances
Both UOP and Axens have made improvements to their regenerator systems. Compared to previous designs, Axens has increased the catalyst circulation and therefore the regeneration frequency allowing more severe operations. The Axens’ Octanizing process uses the RegenC technology for regeneration. UOP commercialized the CycleMax CCR regenerator to enable optimal platinum
Figure 3 Effect of UOP’s R-270 series catalyst on reforming reactions.
New Generation of Naphtha-Reforming Catalysts |
345 |
redispersion, optimal operating conditions for maximum catalyst life, catalyst ‘change-out-on-the-fly’ capabilities (no shutdown required), simplified instrumentation and operation to reduce cost, and stainless steel construction with reduced structure height to reduce capital investments.[33]
3.4Combining Semiregeneration with Continuous Regeneration
The performance of existing semiregenerative units can be enhanced through a revamp that adds a new tail reactor, a heater, and a continuous catalyst regenerator. The catalyst in the new tail reactor is spherical and moves through the reactor to and from the regenerator in a similar fashion as in standard continuous units. Axens licenses two processes: Dualforming and Dualforming Plus. In the Dualforming process, the effluent from the last fixedbed reactor is passed to a new heater and then to the new tail reactor. The new reactor operates at the same pressure as the semiregenerative reactors. In terms of catalyst circulation, the aged catalyst at the bottom of the new reactor is lifted to the top of the regenerator vessel where it is regenerated and then lifted back to the top of the new reactor. In the Dualforming Plus process, the new reactor gets its feed from the product separator and operates
as a second stage. This allows operations at lower pressures than used in the fixed-bed reactors.[6,34]
UOP has developed the CycleX system comprising of a new reactor, interheater and CCR regenerator as a revamp solution for fixed-bed reformers. A new style of regenerator, the sequential regenerator, was developed to address small-capacity (5000–15,000 BPSD) fixed-bed, side-by-side or stacked reactor reforming units. Most operators of these small-capacity reforming units need a low capital cost solution for increasing hydrogen to produce clean reformulated fuels. Based on market assessments, there are three primary situations for the application of the CycleX system: (1) extend the fixed-bed reformer cycle length to match hydrodesulfurization unit cycles, (2) extend the fixed-bed reformer cycle length to match hydrodesulfurization unit cycles and increase hydrogen and reformate production, and (3) maintain the fixed-bed reformer cycle length and increase hydrogen and reformate production. The features of the CycleX system include low capital and operating costs, increased hydrogen and reformate yields, increased fixed-bed catalyst cycle length, and minimal downtime for implementation of the revamp solution.
A diagram of the CycleX system is shown in Figure 4. The only major pieces of equipment that need to be added to an existing fixed-bed reformer are a new heater, a new tail reactor, and a new CCR regenerator. Figure 5 shows the addition of the CycleX system to an existing fixed-bed reformer. As Figure 5 illustrates, the effluent from the last fixed-bed reactor (Rx. 3) is sent to a new
346 |
Antos et al. |
Figure 4 UOP’s CycleX system.
heater that provides the proper temperature to the inlet of a new, radial flow reactor (Rx. 4). The spherical catalyst flows by gravity to the CCR regenerator, which is directly below the new reactor for the new sequential style regenerator.
The catalyst is fully regenerated and then is lifted back to the top of the reactor.[35]
Figure 5 UOP’s CycleX system added to a fixed-bed reformer.
New Generation of Naphtha-Reforming Catalysts |
347 |
4ZEOLITIC REFORMING CATALYSTS
Molecular sieves demonstrate an amazing range of acidities and, due to their crystalline structure, possess the ability to differentiate the accessibility of reactants to active sites and the desorption of products from active sites by diffusional constraints. These properties have been found useful in a number of
petroleum processes. There are many reviews in publication, both from historical and forward-looking perspectives.[36,37]
The use of molecular sieves in naphtha reforming has employed both highly acidic zeolites for cracking and basic zeolites for dehydrocyclization. The diffusional constraint or shape selectivity is used to crack paraffinic species or the side chains of aromatics. Therefore, an emerging use of acidic zeolites is the cracking of reformate to change the endpoint in response to environmental concerns or aromatic distribution to obtain higher valued aromatics. The use of zeolites to dehydrocyclize paraffins has been applied to liquified petroleum gas (LPG) and to raffinates.[38 – 40] The use of zeolite catalysts for isomerization rather than reforming is not included in this discussion.
4.1Reformate Processing
Reformate or stabilized liquid product from the reformer may be further reacted to change its composition. Desirable changes are driven by both economic and environmental concerns. Increasing the benzene, toluene, and xylene (BTX) content through cracking ethylbenzene and heavier aromatics has been published.[13] An acidic zeolite is used to crack the aromatics to the BTX range and may be considered economically desirable, although there is some reduction in liquid gasoline yield and hydrogen, according to the reference. The initial name of the process as presented by Mobil was ‘Mobil Reformate Upgrading’ (MRU).[41] The acidic zeolite is placed at the bottom of the last reactor in a fixed-bed reformer, where it reacts with reformate prior to separation of the light gases. The process with the same objectives, possibly the same process or a derivative thereof, is now marketed under the name BTXtra by Exxon–Mobil.
4.2Aromatics from LPG
The conversion of LPG to aromatics using gallium-doped zeolite catalysts has been jointly developed by UOP and BP and is called the Cyclar process.[38] This
technology uses UOP’s moving-bed catalyst regeneration system and has been previously described.[1] The reaction pathway in the Cyclar process is shown below. The product from the Cyclar process can be fractionated without further processing to recover aromatics since there is a negligible nonaromatic content in

348 |
Antos et al. |
the BTX distillation temperature range. Sud-Chemie introduced the CPA
technology utilizing an MFI catalyst to accomplish similar reaction chemistries in 1999.[23]
4.3.Aromatics from Naphtha
The use of Pt-containing L zeolite catalyst for the conversion of light paraffins in the C6 –C9 range to the corresponding aromatics was patented by Elf in the late
1970s.[42] Based on this catalyst, Chevron has commercialized the AROMAX process and UOP has commercialized the RZ platforming process.[39,40] Figure 6
shows the significant selectivity advantage for the RZ platforming process compared to a conventional reforming process converting C6 –C8 paraffins in raffinate product from an aromatics separation unit.
Many theories have been proposed for the superior selectivity for aromatics production. Some theories espouse the hydrocarbon being preferably oriented for ring closure by the zeolite structure.[43 – 45] An alternative theory is that the structure protects Pt sites from coke deactivation.[46]
Figure 6 Comparison of aromatics yields for processing highly paraffinic feedstock derived from aromatics separation unit raffinate.

New Generation of Naphtha-Reforming Catalysts |
349 |
Figure 7 Chronology demonstrating the increase in catalytic reforming performance with catalyst and process innovations.
5FUTURE DEVELOPMENTS
Catalyst development for cyclic and continuous reforming processes has focused on reducing coke make, allowing longer time before the catalyst needs to be replaced, and increased selectivity for aromatics, hydrogen, and gasoline. Since hundreds of fixed-bed reformers remain in operation, catalyst research for these units is continuing. The primary goals of this research are to develop catalysts that are more selective or are capable of operating under more severe conditions in order to produce greater quantities of aromatics. Product octane has increased as have gasoline, aromatics, and hydrogen yields. The improvement of catalytic reformer performance over time is shown in Figure 7.
REFERENCES
1.Sivasankar, S.; Ratnasamy, P. Reforming for gasoline and aromatics: recent developments. In Catalytic Naphtha Reforming; Antos, G.J., et al., Eds.; Marcel Dekker: New York, 1995; p. 483.
2.Aitani, A. Catalytic reforming processes. In Catalytic Naphtha Reforming; Antos, G.J., et al., Eds.; Marcel Dekker: New York, 1995; p. 409.
3.Berger, R.; Partner. Study on Oil Refining in the European Community, Report prepared for European Commission, DGXVII/B2, 1997; p. 5.
4.Wood McKenzie Consultants Ltd. The Future for European Refining, Multi-Refining Study, 1998.
5.Beshears, D.R. CCR Platforming Catalyst Selection Improves Unit Flexibility and Profitability, NPRA Annual Meeting; San Antonio, TX, March 2000.
6.Clause, O.; Mauk, L.; Martino, G. Trends in catalytic reforming and paraffin isomerization. In Proceedings 15th World Petroleum Congress, 1998; p. 695.
350 |
Antos et al. |
7.Gautam, R.; Bogdan, P.; Lichtscheidl, J. Maximize use of existing assets through advances in CCR reforming catalysts. European Refining Technology Conference, Paris, November, 1999.
8.Sajbel, P.O.; Wier, M.J. The Power of Platforming Innovation Delivered, NPRA Annual Meeting; New Orleans, LA, March 2001.
9.Kluksdahl, H.E. U.S. Patent, 3,415,737, 1968.
10.Augustine, S.M.; Alameddin, G.N.; Sachtler, W.M.H. J. Catal. 1989, 115 (1), 217–232.
11.Sorrentino, C.M.; Pellet, R.J.; Bertolacini, R.J. U.S. Patent 4,469,812, September 4, 1984 (to Standard Oil Company, Indiana).
12.Antos, G.J.; Hayes, J.C.; Mitsche, R.T. U.S. Patent 4,124,491, 1978.
13.LeGoff, P.Y.; Pike, M. ECTC Conference Presentation. Increasing semiregenerative reformer performance through catalytic solutions, 2002.
14.Morse, R.W.; Vance, P.W.; Novak, W.J.; Franck, J.P.; Plumail, J.C. Improve Reformer Yield and Hydrogen Selectivity with Tri-Metallic Catalyst, Hart’s Fuel Reformulation, March/April 1995.
15.Phansalkar, S.S.; Edgar, M.D.; Grey, S.; Lee, B. Catalytic reforming optimization, Criterion Newsletter, 1998.
16.Edgar, M.D. Recent Developments in Catalytic Reforming, AIChE 1999 Spring National Meeting; Houston, TX, March 14–18.
17.Moser, M.D.; Wei, D.H.; Haizmann, R.S. Improving the Catalytic Reforming Process, CHEMTECH, October 1996; 37–41.
18.Haizmann, R.S.; Moser, M.D.; Wei, D.Y. UOP R-72 Staged Loading for Maximum Reformer Yields, 1995 NPRA Annual Meeting; San Francisco, CA, March 1995.
19.Senn, D.R.; Lin, F.-N.; Wuggazer, T. Improve reforming catalyst performance. World Refining 2000, 10 (4), 48–49.
20.Dachos, N.; Kelly, A.; Felch, D.; Reis, E. UOP Platforming processes. In Handbook of Petroleum Refining Processes, 2nd Ed.; Meyers, R.A., Ed.; McGraw-Hill: New York, 1997; p. 4.19.
21.Octanizing, Axens IFP Group Technologies web site, Jan. 2003.
22.Remsberg, C.; Higdon, H. Ideas for Rent, The UOP Story; UOP: Des Plaines, Ill., 1994, p. 348.
23.Armor, J.N. New catalytic technology commercialized in the USA during the 1990’s. Appl. Catal. A: Gen. 2001, 222, 407–426.
24.Stell, J. Worldwide catalyst rep. Oil Gas J. 2001 (Oct. 8), 56.
25.Criterion Catalysts and Technologies Product Bulletins, P-93, P-96, and PR-9 Reforming Catalysts, 1998–1999.
26.Boitiaux, J.P.; Deves, J.M.; Didillion, B.; Marcilly, C.R. Catalyst preparation. In Catalytic Naphtha Reforming; Antos, G.J., et al., Eds.; Marcel Dekker: New York, 1995; p. 98.
27.Murthy, K.R.; Sharma, N.; George, N. Structure and performance of reforming catalysts. In Catalytic Naphtha Reforming; Antos, G.J., et al., Ed.; Marcel Dekker: New York, 1995; p. 229.
28.Le Goff, P.-Y.; Le Peltier, F.; Domergue, B. Increasing reformer performance through catalytic solutions. European Refining Technology Conference, Paris, France, 2002.
29.AR 501 and AR 505, Axens IFP Group Technologies web site, April 2003.
New Generation of Naphtha-Reforming Catalysts |
351 |
30.Gray, S.; Fischer, M.; Phansalkar, S.S. Application of the Criterion PS-40 CCR Catalyst at the ERE Refinery, Lingren Germany, NPRA Annual Meeting; San
Antonio, TX, March 17–19, 2002; Paper AM-02-62.
31. Catalyst and Technology News, Criterion Catalysts and Technologies, Oct–Nov 2002; p. 3.
32.High-yield CCR platforming catalyst commercialized, UOP Technology and More, August 2002; 1–2.
33.UOP Technical Sheet, UOP CycleMax CCR Regenerator, UOP LLC, 1998.
34.Dualforming, Axens IFP Group Technologies web site, Jan. 2003.
35.Peters, S.T. Platforming Technology Advances: CycleX System for Increased Hydrogen Production from a Fixed-Bed Reforming Unit, NPRA Annual Meeting; San Antonio, TX, March 2003.
36.Flanigen, E.M. Zeolites and molecular sieves: an historical perspective. Stud. Surf. Sci. Catal. 2001, 137 (Introduction to Zeolite Science and Practice, 2nd Ed.), 11–35.
37.Rabo, J.A. New advances in molecular sieve science and technology. Periodica Polytechnica Chem. Eng. 1988, 32 (4), 211–234.
38.Imai, T.; Kocal, J.A.; Gosling, C.D.; Hall, A.H.P. New route to aromatics production. The UOP-BP Cyclar Process, Kikan Kagaku Sosetsu 1994, 21, 144–151.
39.O’Rear, D.J.; Scheuerman, G.L. Zeolite Catalysis in Chevron, Book of Abstracts, 214th ACS National Meeting; Las Vegas, NV, September 7–11, 1997.
40.Solis, J.J.; Moser, M.D.; Ibanez, F.J. RZ platforming process improves profitability– first new unit at CEPSA, Algeciras, European Oil Refining Conference & Exhibition, Cascais, Portugal, June 18–20, 1997.
41.Sorenson, C.M.; Harandi, M.N.; Sapre, A.V.; Freyman, D.G. Improving Reformate Quality for BTX Using the Mobil Reformate Upgrading Process, National Petroleum Refiners Association Annual Meeting; San Antonio, Texas, March 16–18, 1997.
42.Bernard, J.R. U.S. Patent 4,104,320, 1978.
43.Tauster, S.J.; Steger, J.J. Molecular die catalysis: hexane aromatization over Pt/KL. J. Catal. 1990, 25, 382–389.
44.Derouane, E.G.; Vanderveken, D.J. Structural recognition and preorganization in zeolite catalysis: direct aromatization of hexane on zeolite L-based catalysts. Appl. Catal. 1988, 45 (1).
45.Lane, G.S.; Modica, F.S.; Miller, J.T. Platinum/zeolite catalyst for reforming hexane: kinetic and mechanistic considerations. J. Catal. 1991, 129 (1), 145–158.
46.Iglesia, E.; Baumgartner, J.E. A mechanistic proposal for alkane dehydrocyclization rates on platinum/L-zeolite. Inhibited deactivation of Pt sites with zeolite channels. Stud. Surf. Sci. Catal. 1993, 75 (New Front. Catal. B), 993–1006.