

Metal-Catalysed Reactions of Hydrocarbons / 13-Reactions of the Lower Alkanes with Hydrogen
.pdfREACTIONS OF THE LOWER ALKANES WITH HYDROGEN |
555 |
than those of supported catalysts. Isomerisation selectivity decreased with temperature, unlike the situation with supported platinum catalysts.3,14,43 This paper91 provides a detailed and thoughtful analysis of the role of surface structure in hydrocarbon reactions; it is therefore disconcerting to find another work in which Pt(100) and (111) surfaces were used that makes no mention at all of dehydrogenation, even although much lower pressures of hydrogen were used. Work on low-index faces of nickel,92 rhodium93,94 and iridium8,92 have also been reported, but are chiefly of interest through their observations on product selectivities (see later).
It is therefore possible to harmonise some of these observations in the following way. Isomerisation selectivity decreases as dispersion increases95,96 and as the concentration of low coordination number atoms increases:91 these latter will predominate at high dispersion. Isomerisation by bond-shift also appears to be favoured at high temperature and low hydrogen pressure;3,14,43 therefore, on platinum at least, the strength of hydrogen chemisorption should be greater at high dispersion.
In view of the possible connection between the effects of dispersion and hydrogen coverage, it is worth stressing that most of the conclusions concerning structure-sensitivity in alkane reactions stem from work performed at a single reactant ratio. Measurements or orders of reaction at different dispersions are rare, the effects where observed not being large. Activation energy values are more common (Table 13.7) and usually increase with dispersion.
13.4.SELECTIVITY OF PRODUCT FORMATION IN ALKANE HYDROGENOLYSIS
The reaction of propane with hydrogen affords methane + ethane; that of n-butane gives isobutane as well as methane, ethane and propane, while isobutane gives n-butane and the smaller alkanes from which ethane is largely absent in the initial products. The preferred method for quoting selectivities has been described in Section 13.1.4. This additional feature adds fascinating further insights into the mechanisms of alkane hydrogenolysis, and there is a rich and extensive literature describing how selectivities vary with reaction conditions, with metal, its physical form, its dispersion, and other variables. The problem of deciding the conceptual framework for this discussion has already been mentioned: instead of supposing that there are three, or even four, reactions proceeding in parallel, each with its own set of kinetic parameters, we take the line that after its initial dissociative chemisorption the alkane decides, perhaps depending on the local environment, what species to form next, and in what amounts, because this will determine the product mix.
The procedure to be adopted is that expounded by R.B. Anderson and his associates,37,42,97 initially for n-butane, but later for more complex alkanes.98 The

556 |
CHAPTER 13 |
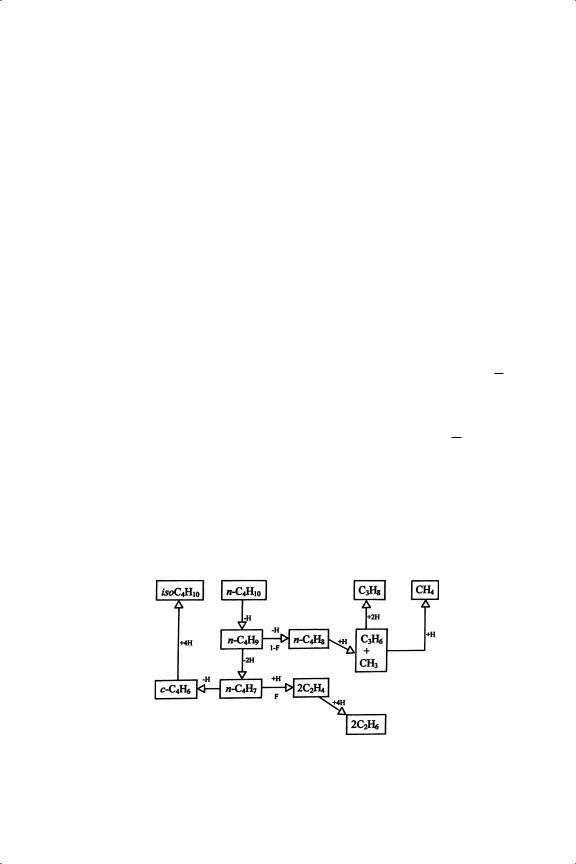
Scheme 13.1. The Anderson–Kempling scheme for the hydrogenation of n-butane.
reaction network to be used is set out in Scheme 13.1, and a typical plot product selectivities as a function of conversion is shown in Figure 13.17; conversion is measured as mol hydrogen consumed per mol n-butane, and isomerisation is ignored for the moment. Steady-state analysis of this reaction scheme leads to expressions for the variation of S2 and S3 with conversion, depending on values as signed to the component constants. At low conversions these expressions conveniently simplify to
S2/ T2 |
= 1 |
+ F − S3 |
(13.13) |
S3/ T3 |
= 1 |
− F |
(13.14) |
Figure 13.17. Hydrogenolysis of n-butane: manner of variation of product selectivities with conversion.97

REACTIONS OF THE LOWER ALKANES WITH HYDROGEN |
557 |
Scheme 13.2. Hydrogenolysis of propane.
where Tj ( j = 2 or 3) is defined by
Tj = k j/(k j + kj ) |
(13.15) |
Now unfortunately with the two observables S2 and S3 it is impossible to estimate the three unknowns, so one of two procedures has then been used. (1) Scheme 13.2, which is a simpler version of Scheme 13.1, starts with propane, so that T2 = S2, and this value of T2 can be determined and substituted for that in the above equations for n-butane, assuming the identity of the two quantities. (2) One can assume a value of unity for T2 which, based on the reaction of propane, is often a very good approximation (see below). The success of these procedures can be judged by the ways in which the parameter values vary smoothly and independently as conditions are changed; they must lie between zero and unity, and if, following the second option above, they do not it is probably because the propane T2 is less than unity. For isobutane there is only one mode of fission, i.e. F = 0, so (S2 + S3) should be unity; it often is about that,97 but not always.91 Selectivities are usually independent of conversion over a considerable distance (i.e. about 0–30%),97,99 so their values can be found quite precisely.14
The reviewer of the literature faces considerable difficulties. Quite often, those studying the reactions of propane and n-butane do not trouble to measure or report product selectivities, and when they are given it is most usually in graphical form, from which numbers of limited accuracy have to be extracted by tedious interpolation. Sometimes only ethane selectivities are quoted.90 Measurements made in UHV systems seem to be more scattered than those made in conventional equipment, and almost all values have to be converted into the Kempling-Anderson formalism (equations 13.13 and 13.14) to make them comparable. In the accompanying Tables 13.9 and 13.10, most values of F and T3 are obtained by method
(2) above. Although for n-butane products the values of S1 can easily be derived from S2 and S3,they are quoted in the tables to save the reader unnecessary labour.
Our task is now to try to summarise the ways in which product selectivities vary with temperature and reactant pressures, especially that of hydrogen.
558 |
CHAPTER 13 |
Following earlier arguments we may expect that rising temperature and falling hydrogen pressure will produce equivalent effects, as both will tend to encourage formation of more dehydrogenated species and more vacant surface sites. As expected, changing alkane pressure has comparatively little effect, because except at the highest alkane/hydrogen ratios the surface concentration of hydrocarbon radicals remains low. The response of selectivities to changes in the levels of temperature and of hydrogen pressure depends on the strength with which hydrogen is adsorbed; if it is strong, both effects are small, but if it is weak they are much more marked. It proves impossible however to divorce these effects from those produced by changing dispersion, which as we have seen may also alter the concentration of adsorbed hydrogen. Particularly marked effects have been seen with titaniasupported metals99−103 and with Ru/Al2O3;74−79 some of these are discussed in Sections 13.6 and 13.7.
The selectivity S2 with which ethane is formed from propane is indicative of the behaviour of the butanes. With platinum S2 was always close to unity (>0.985 for Pt/SiO2 EUROPT-114 and for Pt/Al2O3 EUROPT-33); it was also high (>0.96) for Rh/SiO2 and Rh/Al2O3,47 and for Ir/TiO2,102 irrespective of the mode of pretreatment. These values reflect the much greater difficulty of breaking the C C bond in a C2 species. Various values have been given for ruthenium on different supports; for Ru/TiO2,101 Ru/Al2O783 (and Os/TiO1022 ), it depended markedly on pre-treatment and operating conditions (see Section 13.6). The reaction of iso- butane is also quite straightforward. While the breaking of a single C C bond is the much preferred reaction at low conversions (i.e. S1 ≈ S3), ethane has often been an initial product, not being formed via propane that has re-adsorbed, but through an adsorbed C3 species. On Pt/Al2O3 at 700 K S2 was initially zero,98 but in another study43 both S2 and Si increased with temperature (see Scheme 13.3), and it was suggested that formation of ethane might be preceded by skeletal isomerisation to a linear species. On ruthenium catalysts, S2 was very small at 370–400 K, but
Scheme 13.3. Reactions of n-butane with hydrogen showing suggested intermediate species.

REACTIONS OF THE LOWER ALKANES WITH HYDROGEN |
559 |
TABLE 13.8. |
Hydrogenolysis of isoButane ( PH / PC 10): Product Selectivities |
||||||
Metal |
Form |
T /K |
S1 |
S2 |
S3 |
Si |
References |
Ru |
/SiO2 |
383 |
1.15 |
0.15 |
0.85 |
— |
97 |
Rh |
Black |
420 |
1.65 |
0.51 |
0.45 |
— |
38 |
Ir |
/SiO2 |
|
1.33 |
0.57 |
0.51 |
— |
9 |
Pt |
/A12 O3 |
460 |
1.15 |
0.12 |
0.87 |
— |
12 |
Pt |
/A12 O3 |
700 |
1.02 |
0 |
1.00 |
0.41 |
98 |
Pt |
/A12 O3 |
643 |
0.98 |
0.28 |
0.82 |
— |
17 |
Pt |
(100)a |
573 |
0.71 |
0.83 |
0.54 |
0.98 |
91 |
Pt |
(111)a |
573 |
1.23 |
0.25 |
0.76 |
0.90 |
91 |
a Results for stepped and kinked surfaces also given.
increased with temperature.97,100 Some values of selectivity parameters for other metals are given in Table 13.8.
Very many results for n-butane product selectivities have been published. Once again, the tabulation (Table 13.9) contains only a small selection, and the cited papers give many other product distributions, obtained by changing operating conditions and catalyst pre-treatment. On the whole, temperature coefficients tend to be quite small and dependence on reactant ratio is typically also not very significant. The range of temperature used is also small (e.g. for Rh, 440–476 K), and an excess of hydrogen (generally 10/1 or 20/1) is employed. The variations that appear for a given metal are therefore mainly due either to conversion where high values of S1 and low values of F suggest that product distributions are not close to initial, or to real differences in catalyst structure, for which certain significant trends are apparent.
The behaviour of single crystals and other forms of low dispersion (film, black) is quite different from that of the corresponding supported metal. For rhodium and iridium, very high values of S2 (1.35–1.7) have been shown, irrespective of the support used, while for the macroscopic forms they were less than unity. Very high values of S2 were for example recorded for Ir(110)(1 × 2) between 420 and 475 K at high hydrogen/n-butane ratios (100–400),8 but not for Ir(111)8 or iridium black;38 small particles inside NaY zeolite gave S2 ≈1.65, but larger particles on the surface showed much lower values.104 Central C C bond splitting increased progressively as particle size diminished,93,105 although it is not clear whether this decreased the proportion of the critical active centre or changed the strength of hydrogen chemisorption or altered electronic structure in a way that somehow influenced the mode of reaction. This feature, whatever it is, seemed to affect F more than T3, which was usually greater than 0.8 and was frequently close to unity: T3 is the analogue T2 in propane hydrogenolysis, and it again reflects the preference for intermediate species to vacate the surface rather than suffering further bond fission. Values of F were usually low on platinum (<0.3), and also on ruthenium except when the dispersion was very high (H/Ru > 1),106 when it

560 CHAPTER 13
TABLE 13.9. Hydrogenolysis of n-Butane: Product Selectivities
Metal |
Form |
T /K |
PH / PC |
S1 |
S2 |
S3 |
F |
T3 |
References |
Ru |
black |
443 |
32 |
1.48 |
0.66 |
0.40 |
0.06 |
0.64 |
38 |
|
/SiO2 |
431 |
10 |
1.01 |
0.75 |
0.49 |
0.24 |
0.64 |
171 |
|
/SiO2 |
363 |
|
0.73 |
0.73 |
0.60 |
0.33 |
0.86 |
97 |
|
/TiO2 |
403 |
10 |
0.88 |
0.75 |
0.54 |
0.29 |
0.77 |
99 |
|
/A12 O3 |
433 |
10 |
0.55 |
1.17 |
0.37 |
0.59 |
0.91 |
106 |
Rh |
black |
440 |
10 |
1.25 |
0.70 |
0.43 |
0.15 |
0.55 |
38 |
|
(110) |
455 |
20 |
0.89 |
0.71 |
0.56 |
0.27 |
0.77 |
94,217 |
|
(111) |
455 |
20 |
0.65 |
0.98 |
0.46 |
0.44 |
0.82 |
94,217 |
|
/SiO2 |
433 |
10 |
0.24 |
1.58 |
0.20 |
0.78 |
0.91 |
47 |
|
/SiO2 |
476 |
20 |
0.29 |
1.55 |
0.20 |
0.75 |
0.80 |
94,217 |
|
/A12 O3 |
433 |
10 |
0.37 |
1.35 |
0.31 |
0.66 |
0.91 |
47 |
|
/A12 O3 |
473 |
20 |
0.42 |
1.47 |
0.21 |
0.69 |
0.68 |
94,217 |
|
/TiO2 |
433 |
10 |
0.52 |
1.11 |
0.42 |
0.53 |
0.89 |
47 |
Pd |
/SiO2 |
627 |
10 |
0.94 |
0.09 |
0.96 |
0.05 |
1.01 |
73 |
|
Film |
530 |
10 |
0.91 |
0 |
1.03 |
0.03 |
1 |
166 |
Ir |
/SiO2 |
453 |
20 |
0.26 |
1.48 |
0.26 |
0.74 |
1 |
9 |
|
/SiO2 |
483 |
10 |
0.62 |
0.95 |
0.49 |
0.44 |
0.87 |
171 |
|
/A12 O3 |
460 |
20 |
0.15 |
1.71 |
0.15 |
0.86 |
>1 |
9 |
|
/TiO2 |
473 |
20 |
0.18 |
1.38 |
0.34 |
0.72 |
0.89 |
105 |
|
/TiO2 |
510 |
10 |
0.35 |
1.48 |
0.23 |
0.71 |
0.79 |
102 |
Pt |
(100) |
573 |
10 |
0.47 |
1.18 |
0.39 |
0.58 |
0.93 |
91 |
|
(111) |
573 |
10 |
0.84 |
0.63 |
0.63 |
0.26 |
0.70 |
91 |
|
/SiO2 |
573 |
10 |
0.66 |
0.77 |
0.60 |
0.37 |
0.96 |
14 |
|
/SiO2 |
573 |
5 |
0.85 |
0.86 |
0.47 |
0.34 |
0.71 |
125 |
|
/A12 O3 |
603 |
10 |
0.83 |
0.33 |
0.82 |
0.15 |
0.96 |
65,139 |
|
/A12 O3 |
693 |
4 |
0.73 |
0.56 |
0.72 |
0.28 |
1 |
17 |
|
/TiO2 |
600 |
20 |
0.90 |
0.20 |
0.90 |
0.10 |
1 |
19 |
|
/TiO2 |
573 |
5 |
0.82 |
0.32 |
0.86 |
0.18 |
1 |
125 |
|
/C |
603 |
10 |
0.72 |
0.56 |
0.72 |
0.28 |
1 |
95 |
|
/C |
583 |
10 |
1.55 |
0.26 |
0.64 |
— |
— |
96 |
|
/NaY |
625 |
10.7 |
0.80 |
0.51 |
0.72 |
0.23 |
0.93 |
178 |
|
|
|
|
|
|
|
|
|
|
Many of the cited publications give more results than those abstracted for this table, the purpose of which is to illustrate effects of metal, form, support, etc.
showed the high S2 characteristic of rhodium and iridium. The differences between macroscopic and microscopic are however much less marked than with the other metals.
Very little has been published on hydrogenolysis of the lower alkanes using either nickel20,107,108 or palladium73,109 catalysts, perhaps because both are liable to suffer rapid deactivation by carbon deposits, or to show unstable behaviour. With n-butane, both gave predominantly terminal C C bond fission at low conversion, but there are no detailed kinetic studies to report.
Table 13.10 tries to summarise a mass of experimental results for the dependence of n-butane product selectivities on temperature and hydrogen pressure,

REACTIONS OF THE LOWER ALKANES WITH HYDROGEN |
561 |
TABLE 13.10. |
Hydrogenolysis of n-Butane: Variation of Product Selectivities and |
|||||||||||||||||||
|
Anderson–Kempling Parameters with Increasing Temperature and |
|
||||||||||||||||||
|
|
|
|
|
Decreasing Hydrogen Pressure |
|
|
|
|
|
|
|||||||||
|
|
|
|
|
|
|
|
|
|
|
|
|||||||||
Metal |
Form |
|
T /K |
PH /Torr |
S1 |
S2 |
S3 |
Si |
F |
T3 |
References |
|||||||||
Rh |
black |
|
|
|
691 |
(+) |
|
+ |
|
(−) |
|
|
|
|
|
38 |
||||
|
(110) |
|
|
|
200 |
|
+ |
|
|
+ |
|
— |
|
|
|
|
|
93,94 |
||
|
|
|
|
500 |
|
|
+ |
|
— |
|
? |
|
|
|
|
|
|
|
||
|
/SiO2 |
|
|
|
623 |
( |
) |
( |
|
) |
( |
|
) |
|
— |
( |
|
) |
47 |
|
|
|
|
+ |
− |
+ |
|
− |
|||||||||||||
|
|
|
|
430 |
|
|
|
|
|
|
|
|
|
|
|
|
||||
|
|
|
|
|
|
|
|
|
|
|
|
|
|
|
|
|
|
|||
|
/A12 O3 |
|
|
|
623 |
(−) |
(−) |
|
|
|
|
— |
— |
47 |
||||||
|
|
|
|
430 |
|
|
+ |
|
— |
|
+ |
|
|
— |
|
|
|
|
||
Pd |
/A12 O3 |
|
|
|
|
|
|
— |
|
|
|
|
|
|
73 |
|||||
|
|
|
|
|
|
|
|
|
+ |
|
|
|
|
|||||||
Ir |
black |
|
|
608 |
|
|
|
|
+ |
|
— |
|
(+) |
|
|
|
38 |
|||
|
|
|
691 |
|
+ |
|
— |
— |
|
|
|
|
|
|||||||
|
(111) |
|
|
|
100 |
|
|
— |
— |
|
|
|
|
|
8 |
|||||
|
|
|
|
+ |
|
|
|
|
|
|
||||||||||
|
|
|
|
500 |
|
|
|
— |
— |
|
|
|
|
|
|
|||||
|
|
|
|
|
+ |
|
|
|
|
|
|
|
||||||||
|
(110)-(1 |
|
2) |
|
100 |
|
|
— |
— |
|
|
|
|
|
8 |
|||||
|
× |
|
+ |
|
|
|
|
|
|
|||||||||||
|
|
|
475 |
|
|
|
max |
max |
|
|
|
|
|
|
||||||
|
|
|
|
|
+ |
|
|
|
|
|
|
|
||||||||
|
/TiO2 |
|
|
|
543 |
min |
max |
min |
|
|
|
|
|
102 |
||||||
Pt |
(100) |
|
|
|
50 |
(+) |
|
|
|
— |
+ |
|
|
|
|
7 |
||||
|
|
|
|
575 |
|
— |
|
|
|
— |
|
|
|
|
|
|||||
|
(111) |
|
|
|
50 |
(+) |
min |
|
|
|
|
|
|
|
|
7 |
||||
|
|
|
|
583 |
|
— |
— |
max |
|
|
|
|
|
|
||||||
|
black |
|
|
735 |
|
|
+ |
|
|
|
|
— |
— |
|
|
|
|
32 |
||
|
/SiO2 |
|
|
539 |
|
|
+ |
|
max |
— |
|
|
|
|
|
16 |
||||
|
/SiO2 |
|
|
|
338 |
(+) |
(−) |
|
|
|
|
|
|
|
|
17 |
||||
|
/SiO2 a |
|
|
|
|
|
|
|
|
+ |
|
— |
+ |
|
|
|
|
41 |
||
|
/SiO2 a |
|
|
|
543 |
|
|
|
|
— |
|
(−) |
14 |
|||||||
|
|
|
|
|
|
|
+ |
|
+ |
+ |
||||||||||
|
/A12 O3 b |
|
|
533 |
|
— |
|
+ |
|
— |
+ |
|
|
|
|
|
||||
|
|
|
|
543 |
— |
|
+ |
|
— |
|
— |
( |
− |
) |
3,4,65 |
|||||
|
|
|
|
547 |
|
— |
|
|
— |
|
|
|
|
|
||||||
|
|
|
|
|
+ |
|
+ |
|
|
|
|
|
||||||||
|
|
|
|
|
|
|
|
|
|
|
|
|
|
|
|
|
|
|
||
Columns 3 and 4: signifies what was varied, the corresponding number gives the level. a EUROPT-1; b EUROPT-3.
with a view to seeing the extent to which similar effects have been shown, (i) by different forms of metal, and (ii) by altering the levels of these variables in the sense of decreasing hydrogen coverage. It is hard to discern any overall consensus: contributing factors are (i) that changes are often quite small within the range investigated, and (ii) that it is difficult to maintain low conversion while exploring a wide variation in the level of the variable. Two studies7,91 of platinum single crystals have given somewhat different results, but those for the macroscopic forms of iridium were reasonably consistent,8,38 and those for the reference platinum catalysts agreed well. Discrepancies between macroscopic and microscopic forms are again apparent, and the sense of the trends with iridium and platinum are quite different, suggesting that their mechanisms are not the same.9 A more quantitative analysis of the consequences of hydrogen pressure variation is attempted in the next section. One gets the general impression that the effect of increasing

562 |
CHAPTER 13 |
temperature is somewhat greater than that of decreasing hydrogen pressure, which is perhaps not surprising where its adsorption is strong.
13.5. MECHANISMS BASED ON PRODUCT SELECTIVITIES
The term ‘mechanisms’ is used in the plural, because it is unsafe to assume that a single ‘mechanism’, as defined by the type of essential intermediates, their prevalence and ways of interaction (Section 5.3), will suffice for all metals and all conditions: indeed there is clear evidence that such is not the case.9 This section is mainly concerned with what happens on rhodium and platinum, for which most information is available. Our task is to understand the significance of the markedly negative orders in hydrogen, and how they correlate with the variations of product selectivities with hydrogen pressure. Effects due to changing temperature are, as we have seen, most likely a consequence of change in hydrogen coverage. Orders of reaction become less negative with rise in temperature because hydrogen atom coverage becomes less and more vacant sites become available for alkane chemisorption, and in constant ranges of hydrogen pressure variation they become more positive with increasing alkane chain length as the alkane’s chemisorption strengthens.65 Changes in product selectivities will therefore vary because of the H:C ratio of the adsorbed intermediates and the coverage by hydrogen atoms, both of which decrease as hydrogen pressure falls, and the fraction of vacant cites, which naturally increases. Now the Kempling-Anderson scheme as set out in Scheme 13.1 does not specify the need for hydrogen atom acceptance or donation in each step. It has always been accepted (and is supported by kinetic analysis based on the ES5B equation, Section 13.23) that an alkane has to lose at least two, and very possibly three or even four hydrogen atoms in order to be activated for hydrogenolysis. Scheme 13.2 illustrates one possible formulation of the reaction of propane, defining needs for hydrogen atoms; it assumes adsorption by loss of only two hydrogen atoms, and the requirement for one to assist C C bond breaking. It follows that more (i.e. 2) are needed to secure formation of gaseous ethane than to break a C C bond and form two adsorbed C1 fragments. The difference is exacerbated if more than two atoms are lost in the chemisorption, and if none are needed to break C C bonds, as some claim.46 Ethane selectivity S2 therefore falls with decrease in hydrogen pressure and with increasing temperature. The greater the rates of these changes, the weaker is the hydrogen chemisorption. The high S2 values typically found mean however that the extent of these changes is often small, and they can only rarely be treated quantitatively to deduce the difference in the numbers of hydrogen atoms involved in the two routes.76,78
The argument can be extended to the more complex case of n-butane, for which there have been detailed studies of the effects of varying hydrogen pressure for platinum,4,65 palladium73 and rhodium47 on different supports (for ruthenium,

REACTIONS OF THE LOWER ALKANES WITH HYDROGEN |
563 |
Figure 13.18. Hydrogenolysis of n-butane on 0.3% Pt/Al2 O3 (EUROPT-3): selectivity parameters at 547 K as a function of hydrogen pressure.65
see Section 13.6). Inspection of the results shows that in the higher ranges of hydrogen pressure there were consistent changes. As the pressure was decreased,
(i) the isomerisation selectivity Si always increased (i.e. with Pt and Pd), (ii) S2 always rose, as did F, (iii) S1 and S3 decreased in parallel or remained constant, the difference between them often being small, and (iv) T3 was high and either constant, or decreased slightly (Figure 13.18). The variation in F arose because, at the point where the routes to ethane and to propane branched, the former went via a species that had lost one more hydrogen atom than that proceeding to propane, so that the ethane route was favoured by decreasing hydrogen atom concentration and increasing numbers of vacant sites to accommodate new C M bonds. These trends were observed even when the hydrogen was very strongly chemisorbed, as it was on rhodium catalysts at about 430 K, as indicated by the occurrence of rate maxima at hydrogen pressures below 0.02 atm.47 Only in the case of Rh/SiO2 after HTR1 when F and S2 were very large (respectively 0.8 and 1.5) were they independent of hydrogen pressure over most of the range. Also since on Pt/KL zeolite and on EUROPT-14 Si increased with falling hydrogen pressure more quickly than did S2, the former proceeded by the loss of two more hydrogen atoms than did the latter. The amplified Kempling-Anderson Scheme 13.3 shows how the relevant species might be composed.
The striking difference between platinum on the one hand and rhodium and iridium on the other lies in the former’s ability to isomerise alkanes even on large particles,95,96,110 whereas with the latter (and also with ruthenium99) it has only been observed at high temperatures with large particles that have been substantially deactivated. It might be thought that on these metals the high S2 values (Table 13.9) were a consequence of a frustration of the isomerisation route, because

564 |
CHAPTER 13 |
rhodium catalysts capable of isomerising showed much lower values of S2.90 It must be remembered that iridium and rhodium are much more active than platinum and have therefore been studied at much lower temperatures. The ‘frustration’ of isomerisation may simply arise from the use of moderate temperatures, at which, because of the greater activation energy needed to form the vital intermediate, hydrogenolysis is preferred. The reason why platinum (and palladium) are always less active than metals to their left is a more difficult question. It may be that they find greater difficulty in forming multiple C M bonds because their d-electron orbitals are more nearly filled.
Particle-size effects may also be addressed in terms of the model outlined in Schemes 13.2–5. In the case of the reference platinum catalysts, a decrease in size was accompanied by a marked decrease in S2 and in S1, and in F; this implies stronger hydrogen chemisorption on the Pt/Al2O3 reforming catalyst. On rhodium and iridium, however, the effect of size on S2 and F (Table 13.9) is more probably due to a change in the surface’s ability to accommodate multiple C M bonds.
The mechanism by which skeletal isomerisation occurs has been much debated (see Further Reading section). It assumes greater importance with higher alkanes, so the following short discussion will be amplified in the next chapter. Favoured mechanisms have assumed (i) that it begins with a species that has lost either one, two or three hydrogen atoms, but (ii) that it only needs one site (or forms only one C M bond). This last point was supported by the observations91 that the reaction proceeded on organometallic complexes having only one metal atom, and that isomerisation selectivity increased as ensemble size decreased when diluting an active metal with an inactive one (see Section 13.7). Arguments concerning the desirable H/C ratio based on kinetic observations were not used. The essential step of the isomerisation then took one of two forms: either (1) a C C bond was broken, and rotation of the alkene portion followed by re-assembly of the C4 unit took place; or (2) a cyclopropanoid structure was formed, where the more probable breaking of the bond between the least substituted
Scheme 13.4. Isomerisation of isobutene via a metallocyclic intermediate.