

Matta, Boyd. The quantum theory of atoms in molecules
.pdf302 11 Topological Analysis of Proteins as Derived from Medium and High-resolution Electron Density
Fig. 11.5 3D representations of the ten amino acid residues of the adenine binding site of the protein hAR (thin black sticks) and corresponding local maxima (black spheres) observed in experimental and promolecular XTAL ED distributions at resolutions d ¼ 2:85 and 3.5 A˚ . The NADPþ structure is displayed using thick black sticks. Two density iso-contour levels are displayed at a high and a low selected ED value, using triangulated and solid surfaces, respectively.
The evolution of the number of ED maxima as a function of t is shown in Fig. 11.6. This evolution is characterized by several well marked steps associated with the formation of specific fragments. The merging of the atoms to form fragments
first occurs between the |
H atoms and their chemically |
|
bonded neighbors at |
||
˚ |
2 |
. Then, as already shown [31], the C and O atoms of the backbone |
|||
t ¼ 0:014 A |
|
||||
carbonyl groups begin to |
˚ |
2 |
. Between 0.196 and |
||
merge starting at t ¼ 0:098 A |
|
||||
˚ 2 |
|
|
|
|
|
0.280 A , the atoms of the amino acid backbones merge until regular fragment |
|||||
structures, for example (CbO)aNaCa and (CbO)aNaCa aCb (for clarity, H atoms are not shown) are fully created at approximately t ¼ 0:350 A˚ 2. At this particular value of t the shortest rms deviation (0.458 A˚ ) is observed between the coordinates of the backbone peaks and their corresponding c.o.m.

11.4 Local Maxima in Experimental and Promolecular Medium-resolution ED Distributions 303
Table 11.5 Identification and density values of the peaks associated with the ten amino acid residues of the adenine binding site of the hAR structure as obtained by CP analysis of experimental and promolecular XTAL ED maps at resolution values of 2.85 and 3.5 A˚ . ‘‘bak’’ and ‘‘sid’’ stand for ‘‘backbone’’ and ‘‘side-chain’’, respectively.
Amino acid site |
|
˚C3 |
) |
|
|
|
|
|
|
r (e A |
|
|
|
|
|||
|
|
|
|
|
|
|
|
|
|
|
|
˚ |
|
|
|
˚ |
|
|
|
|
2.85 A |
|
|
|
3.5 A |
|
|
|
|
|
|
|
|
|
|
|
|
|
Experimental |
Promolecular |
Experimental |
Promolecular |
||
|
|
|
|
|
|
|
||
LEU212 |
bak |
1.385 |
|
1.737 |
1.784 |
1.496 |
||
LEU212 |
sid |
1.363 |
|
1.781, 0.890 |
2.103 |
1.786 |
||
PRO215 |
bak |
1.314 |
|
1.655 |
|
|
1.405 |
|
PRO215 |
sid |
1.779 |
|
1.768 |
1.833 |
|
||
ASP216 |
bak |
1.452, 1.247 |
1.823 |
1.787 |
1.397 |
|||
ASP216 |
sid |
1.133 |
|
1.618, 1.594 |
1.548, 1.075 |
1.376 |
||
LEU228 |
bak |
1.409 |
|
1.973 |
1.241 |
1.476 |
||
LEU228 |
sid |
1.199 |
|
1.880 |
1.830 |
1.711 |
||
ALA245 |
bak |
1.841 |
|
1.974 |
2.021 |
1.428 |
||
LYS262 |
bak |
1.681, 1.275 |
1.972 |
2.544 |
1.810 |
|||
LYS262 |
sid |
1.522 |
|
1.754, 1.539 |
1.551 |
1.286 |
||
SER263 |
bak |
1.599, 1.574 |
1.831, 1.722 |
1.789 |
1.400 |
|||
ARG268 |
bak |
1.700 |
|
2.121 |
1.745 |
1.462 |
||
ARG268 |
sid |
2.069, 1.524 |
2.152, 1.750, 1.734 |
2.099, 1.079 |
1.415 |
|||
GLU271 |
bak |
1.255, 1.209 |
1.547 |
1.718 |
1.341 |
|||
GLU271 |
sid |
0.888 |
|
1.546 |
1.328 |
1.428 |
||
ASN272 |
bak |
1.490 |
|
1.864 |
1.501 |
1.607 |
||
ASN272 |
sid |
1.086 |
|
1.726, 1.469 |
1.688 |
1.358 |
||
|
|
|
|
|
|
|
|
|
The numbers of fragments/peaks obtained at t ¼ 0:350 and 0.420 A˚ 2 are presented in Table 11.6. As already mentioned [31], t ¼ 0:420 A˚ 2 enables partitioning of the protein structure into parts located either on the backbone or on the sidechains. At that particular value of t most of the side-chains are represented by one maximum located at an average distance of 0.76 A˚ from the side-chain c.o.ms (Table 11.6). If the number of backbone peaks is close to the number of amino acid residues, the number of side-chain peaks is relatively smaller than in XTAL maps and the number of solvent peaks is greater. This is because, in XTAL maps, experimental values of B, which di er for each atom and are rather large for the solvent, are considered. In smoothed PASA maps only one value of B (that is equivalent to 2t) is valid for the whole set of atoms. Let us also mention that the lowest density value in any ED map is equal to 0.0 e A˚ 3, because of the specific parameterization scheme adopted by Amat et al. [29]. This scheme indeed forces the weight w of the Gaussian functions in the PASA representation (Eqs 7 and 9) to be positive.

304 11 Topological Analysis of Proteins as Derived from Medium and High-resolution Electron Density
Fig. 11.6 Total number of fragments/peaks (black squares) and numbers of peaks close to any backbone c.o.m. (black spheres) or side-chain c.o.m. (open squares) in the PASA ED distribution of hAR structure as a function of the smoothing term t.
Detailed analysis of the fragment content shows that at t ¼ 0:350 A˚ 2, 32% (108/
334)of the backbone fragments contain the (CbO)aNaCa atoms, and 37% (125/
334)contain the (CbO)aNaCa aCb atoms. With a smoothing value of 0.420 A˚ 2 these ratios change to 26 (86/331) and 37% (124/331), respectively. Residues are more regularly decomposed into one backbone and one side-chain fragment.
Table 11.6 Number of fragments/peaks in smoothed PASA ED maps of the hAR structure at t ¼ 0:350 and 0.420 A˚ 2, and mean distances in A˚ (in parentheses) between the peaks and their nearest amino acid site (main-chain or side-chain c.o.m.), or solvent atom site.
Number of peaks |
˚ 2 |
˚ 2 |
t F 0:350 A |
t F 0:420 A |
|
|
|
|
Backbone |
334; (0.316 G0.297) |
331; (0.283 G0.320) |
Side-chains |
290; (0.843 G0.543) |
224; (0.757 G0.532) |
Ligand |
6 |
6 |
NADPþ |
11 |
9 |
Citrate |
7 |
6 |
Water |
528; (0.214 G0.628) |
520; (0.232 G0.597) |
ED range (e A˚ 3) |
0.0–2.895 |
0.0–2.288 |

11.5 Calculation of Electrostatic Properties from Atomic and Fragment Representations 305
There are two exceptions – the TYR side-chain, which is represented by two fragments, [Cg aCd] and [(Ce)2Cz aO], and VAL, for which backbone and side-chain atoms form only one fragment. The other backbone of the amino acid residues leads either to two fragments, e.g. CbO and NaCa aCb in for 7.4% (23/311 and 23/308, at 0.350 and 0.420 A˚ 2, respectively) of the amino acid residues, or to larger fragments containing, for example, Cg.
As detailed further in this chapter, the atomic fragment content of the ten amino acid residues that constitute the adenine binding site of the protein will be used to determine fragment charges and calculate molecular electrostatic properties. For this particular set of amino acid residues it is apparent the fragment contents are identical, at both t ¼ 0:350 and t ¼ 0:420 A˚ 2 (Table 11.7). There are only two exceptions, LYS262 and GLU271, for which two fragments at t ¼ 0:350
˚ |
2 |
. GLU271 is also a particular example for which the |
are merged at t ¼ 0:420 A |
|
|
|
|
˚ 2 |
two sites occupied by the side-chain atoms lead to two fragments at t ¼ 0:350 A . |
||
For fragments close to a backbone c.o.m., the CbO group belongs to residue n; the other atoms belong to amino acid residue n þ 1. For example, LEU212_bak is composed of (CbO)212 and (NCa)213, and THR244_bak contains (CbO)244 and (NCaCb )245. In these two examples, residues 212 and 245 are part of the adenine site whereas 213 and 244 are not.
For a given value of t, all density values are very close to each other. Some fragments are, however, characterized by lower values under two conditions – either there are two fragments for a residue side-chain (LYS262 and GLU271) or the side-chain is composed of C and H atoms only (LEU212 and LEU228).
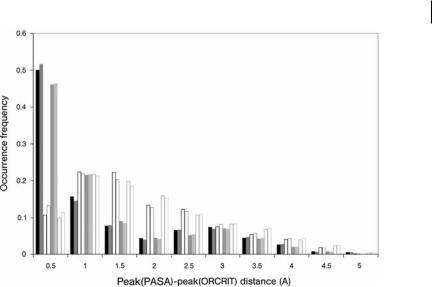
Comparison of the local density maxima observed in experimental and promolecular XTAL or smoothed ED maps is depicted in Fig. 11.7. It is readily apparent that the strongest similarity (shortest distances) between the two promolecular models and/or the experimental results occurs between the peaks observed in the smoothed PASA maps, at t ¼ 0:350 or 0.420 A˚ 2, and the XTAL/experimental maps at a resolution of 2.85 A˚ . Indeed, approximately two thirds of the calculated distances lie below 1 A˚ . For example, 50% and 15% of the distances calculated between the peaks in a map smoothed at t ¼ 0:350 A˚ 2 and the peaks in a promolecular XTAL map at 2.85 A˚ belong to [0, 0.5 A˚ [ and [0.5, 1.0 A˚ [, respectively.
11.5
Calculation of Electrostatic Properties from Atomic and Fragment Representations of Human Aldose Reductase
One of the most important applications of this topological analysis is to electrostatic potential properties, as shown, for example, by Muzet et al. [16]. Hence, understanding of electrostatic properties and interaction energies is of prime importance in the prediction of protein–protein, protein–DNA, and drug–receptor recognition and interactions. Systematic calculation of atomic charges by theoretical DFT methods [16] or by experimental electron density analysis [15] can be a
306 11 Topological Analysis of Proteins as Derived from Medium and High-resolution Electron Density
Table 11.7 Atomic content, density values r, and charges of the fragments that contain atoms of the hAR adenine binding site as obtained using a hierarchical merging/clustering algorithm applied to the PASA ED distribution. For clarity, bonded H atoms are not shown. ‘‘bak’’ and ‘‘sid’’ stand for ‘‘backbone’’ and ‘‘side-chain’’, respectively.
Nearest c.o.m. |
Fragment content |
|
˚C3 |
) |
|
|
Fragment charge (e), |
|||
|
r (e A |
|
|
|||||||
|
|
|
|
|
|
|
|
|
˚ 2 |
|
|
|
|
|
|
|
|
|
t F 0:420 A |
|
|
|
|
|
|
|
˚ 2 |
˚ 2 |
|
|
||
|
|
|
|
|
|
|
|
|
||
|
|
|
|
|
|
|
|
|
||
|
|
|
|
t F 0:350 A |
t F 0:420 A |
|
|
|
|
|
|
|
|
|
|
|
|
|
Unit |
QVAL |
QTAIMEXP |
|
|
|
|
|
|
|
|
charge |
|
|
|
|
|
|
|
|
|
|
|
|
|
PRO211 |
bak |
(CbO)aNaCa |
1.167 |
|
1.039 |
|
|
0.059 |
0.318 |
|
LEU212 |
bak |
(CbO)aNaCa |
1.174 |
|
1.039 |
|
|
0.206 |
0.111 |
|
LEU212 |
sid |
Cb aCg a(Cd)Cd |
0.999 |
|
0.891 |
|
|
0.258 |
0.448 |
|
SER214 |
bak |
NaCa aCb aCg aCd |
1.181 |
|
1.073 |
|
|
0.196 |
0.583 |
|
PRO215 |
bak |
(CbO)aNaCa aCb |
1.181 |
|
1.046 |
|
|
0.050 |
0.104 |
|
ASP216 |
bak |
(CbO)aNaCa aCb aCg |
1.188 |
|
1.053 |
1 |
0.206 |
0.111 |
||
ASP216 |
sid |
Cg a(Od)Od |
1.181 |
|
1.039 |
0.833 |
0.578 |
|||
LEU227 |
bak |
(CbO)aNaCa aCb |
1.188 |
|
1.059 |
|
|
0.155 |
0.216 |
|
LEU228 |
bak |
(CbO)aNaCa aCb aCg aCd a(Oe)Oe |
1.174 |
|
1.046 |
|
|
0.206 |
0.111 |
|
LEU228 |
sid |
Cg a(Cd)Cd |
0.999 |
|
0.891 |
|
|
0.162 |
0.346 |
|
THR244 |
bak |
(CbO)aNaCa aCb |
1.188 |
|
1.059 |
|
|
0.208 |
0.215 |
|
ALA245 |
bak |
(CbO)aNaCa aCb |
1.181 |
|
1.053 |
|
|
0.206 |
0.111 |
|
PRO261 |
bak |
(CbO)aNaCa aCb |
1.181 |
|
1.039 |
|
|
0.155 |
0.216 |
|
LYS262 |
bak |
(CbO)aNaCa |
1.174 |
|
1.046 |
|
|
0.050 |
0.104 |
|
LYS262 |
sid |
Cg |
0.918 |
|
|
|
||||
LYS262 |
sid |
Cd aCe aNz |
0.985 |
|
0.857 |
1 |
0.832 |
0.706 |
||
SER263 |
bak |
(CbO)aNaCa |
1.174 |
|
1.039 |
|
|
0.206 |
0.111 |
|
SER263 |
sid |
Cb aOg |
1.059 |
|
0.918 |
|
|
0.109 |
0.347 |
|
GLU267 |
bak |
(CbO)aNaCa aCb |
1.181 |
|
1.046 |
|
|
0.215 |
0.216 |
|
ARG268 |
bak |
(CbO)aNaCa |
1.181 |
|
1.053 |
|
|
0.206 |
0.111 |
|
ARG268 |
sid |
Cg aCd aNe aCz a(N)N |
1.181 |
|
1.039 |
1 |
0.853 |
1.169 |
||
ALA270 |
bak |
(CbO)aNaCa aCb a[Cg]chainB |
1.161 |
|
1.039 |
|
|
0.135 |
0.215 |
|
GLU271 |
bak |
(CbO)aNaCa |
1.147 |
|
1.033 |
|
|
0.157 |
0.206 |
|
GLU271 |
sid |
[Cg aCd aOe1Oe2]chainA a[Oe1]chainB |
0.992 |
|
0.857 |
1 |
0.737 |
0.477 |
||
GLU271 |
sid |
[Cd aOe2]chainB |
0.817 |
|
||||||
ASN272 |
bak |
(CbO)aNaCa aCb |
1.167 |
|
1.039 |
|
|
0.216 |
0.111 |
|
ASN272 |
sid |
Cb aCg a(Od)Nd |
1.167 |
|
1.019 |
|
|
0.158 |
0.345 |
|
|
|
|
|
|
|
|
|
|
|
|
limiting factor when rapid prediction of such interaction patterns is needed. Thus, database retrieval of interaction properties combined with reduced models enable acceleration of such calculations.
In this part of the chapter, adenine binding site high-resolution electrostatic potentials, computed using full multipolar database transferred data and the QTAIMEXP charge model, are compared. These properties are also compared to
11.5 Calculation of Electrostatic Properties from Atomic and Fragment Representations 307
Fig. 11.7 Frequency of occurrence of distances measured between the peaks observed in PASA ED maps of hAR smoothed at t ¼ 0:350 (t350) and 0.420 (t420) A˚ 2, and promolecular XTAL or experimental ED maps at resolution values of 2.85 (R285) and 3.5 (R35) A˚ . Histogram bars are displayed in the following comparison sequence: t350–R285, t420– R285, t350–R35, t420–R35, t350–R285exp, t420–R285exp, t350–R35exp, t420–R35exp. exp denotes ‘‘experimental’’.
the electrostatic potential calculated at medium resolution, using the fragment description of the adenine binding site associated with di erent point-charge models.
11.5.1
Mediumand High-resolution Approaches of Electrostatic Potential Computations
The high-resolution electrostatic potential generated in the adenine binding site by the protein environment has been computed by VMoPro [10] using, on one hand, the charge-density terms (k, k0, Pval, and Plm, Eq. 5) as transferred from the multipolar database (most accurate description) and, on the other hand, the QTAIMEXP charge model (Section 11.3) [23, 24, 36].
In both cases, to ensure fragment electroneutrality, the total charge of the adenine binding site was set equal to zero by initially correcting atomic charges using the following procedure. The sum of adenine binding site atomic valence populations for neutral and charged atoms are compared. The di erence, divided by the number of atoms (i.e. 160, including hydrogen atoms), is then subtracted for each atom in the adenine binding site. When using the multipolar database values (which includes QVAL charges), as already observed by transfer over the full hAR structure [16], the charge increment to be brought to each atom is

308 11 Topological Analysis of Proteins as Derived from Medium and High-resolution Electron Density
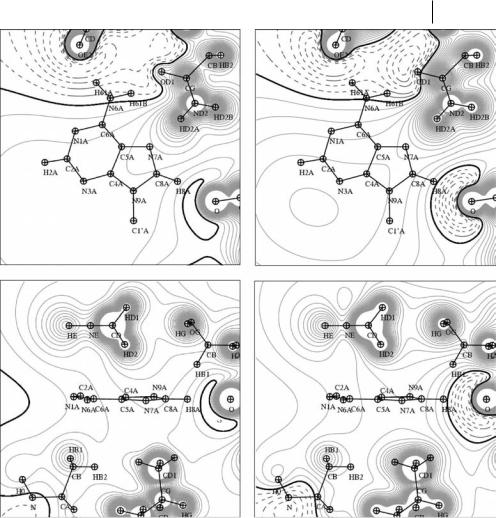
very small, þ0.008 e, and is thus acceptable as largely below the standard deviations of the database values and below the experimental standard uncertainties for valence populations observed in a charge-density refinement. For QTAIMEXP charges, the amount of charge needed to ensure electroneutrality of the adenine binding site fragment is slightly higher, þ0.018 e, but comparable with the multipolar database standard deviations. The resulting high-resolution electrostatic potentials are displayed Fig. 11.8 in two orthogonal planes.
To compute electrostatic potential in the medium-resolution approach, charges attributed to the adenine binding site fragments obtained by analysis of smoothed PASA ED distributions (with a selected smoothing degree of t ¼ 0:420 A˚ 2), were calculated by the following procedure.
First, each fragment that contained at least one atom of the adenine binding site was selected. Fragment charges were then calculated as summations over the atomic charges associated with their constituting atoms. Three di erent sets of atomic charges were considered – the QVAL charges (Section 11.3, page 298), the QTAIMEXP charges, and unit charges obtained by setting all fragment charges equal to zero, except for the side-chain fragments ARG (þ1), GLU ( 1), LYS (þ1), and ASP ( 1). The latter model was used by Becue to calculate an electrostatic scoring index for protein–protein and protein–DNA docking applications [51].
The adenine binding site fragment charges calculated from the three sets of atomic and unit charges described above are given in Table 11.7. This table shows that, except for ARG268, the QVAL charges of the charged amino acids ASP216, LYS262, and GLU271 are closer to the very simple unit-charge model than those using the QTAIMEXP charge model. For example, ASP216 side-chain fragment net charge is 0.83 e for QVAL but only 0.58 e for QTAIMEXP. The LYS262 QVAL charge is 0.83 e compared to 0.71 e for the QTAIMEXP charge. For ARG268, the situation is inverted, 1.17 e for QTAIMEXP charges compared with 0.85 e for the QVAL charges. Accumulation of charges on side-chain fragments is, however, always coherent with the formal charge currently used for such amino acids. For the neutral or polar amino acids present in the adenine binding site model, QVAL and QTAIMEXP fragment charges are not always consistent, because numerous sign di erences occur (Table 11.7). For example, when the backbone fragment obtained by the clustering procedure adopts a 0.21 e negative charge with QVAL charges, the corresponding QTAIMEXP charge is equal to þ0.11 e. Furthermore, the correlation between the signs of QVAL and QTAIMEXP pseudo atomic charges (without any clustering procedure) is only 63%. QTAIMEXP charges obtained by integration of the experimental multipolar database ED are usually found be more di erent than the QVAL charges – positive and negative charges have more pronounced absolute values.
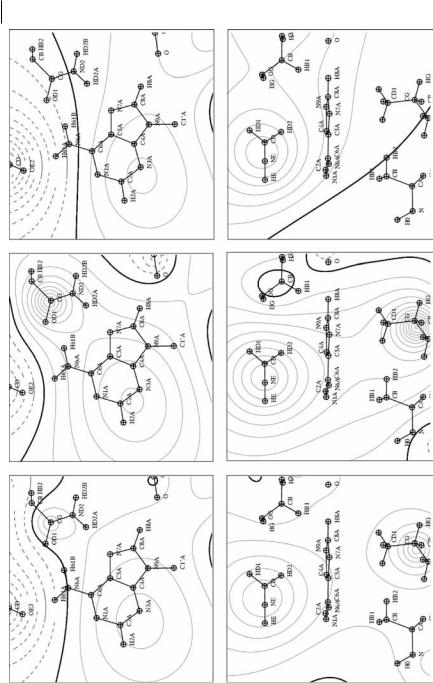
The adenine binding site fragment charges QVAL, QTAIMEXP, and unit charges, which we have located on ED maxima identifying each fragment in the clustering procedure, have been used to generate point-charge calculated electrostatic potentials based on medium-resolution ED topology. They are shown in Fig. 11.9 in the same orientations as defined for the high-resolution electrostatic potentials.

11.5 Calculation of Electrostatic Properties from Atomic and Fragment Representations 311
VMoPro (Fig. 11.8) reveals surprisingly good qualitative agreement for the adenine moiety binding regions. For example, the electronegative area generated by the group of oxygen atoms OD1_ASN272, OE2, and OE1_GLU271 close to the NH2 function of the adenine group is very well conserved (Fig. 11.8, top). This is consistent with the electrostatic complementarity expected between the adenine NH2 group, which has been found to be positively charged in chargedensity studies of other adenine-containing compounds [52, 53], and this electronegative region generated by the protein atoms. It is also seen that the adenine double ring is located in a slightly electropositive area in both instances, with atom H8A pointing toward a small region ranging from slightly electronegative (multipolar database values) to strongly electronegative (QTAIMEXP charges), because of the atom O_LYS262. This discrepancy in the area of the H8A adenine atom arises from the more pronounced negative QTAIMEXP charge for the backbone O atom. Very interestingly, however, the region of zero potential (isocontour 0.0 e A˚ 1) separating electronegative and electropositive regions is always very well conserved, indicating qualitative agreement between the two representations. The main discrepancies between multipolar database and QTAIMEXP descriptions are usually located close to the atoms, because electrostatic potential values computed from data transferred from multipolar database takes directly into account the nonspherical part of the ED in the form of high-order electrostatic moments [54] whose contributions have shorter spatial extent than zero order moments (point charges). Hence, the quantitative di erence between the two representations is 0.15 e A˚ 1 close to the O atoms that are hydrogen bonded to the NH2 adenine group whereas it is only 0.05 e A˚ 1 on its double ring position. When electrostatic potentials are compared in the plane perpendicular to the adenine moiety (Fig. 11.8 bottom), the di erence between the electronegative area magnitudes close to the H8A atom is still observed. Another di erence arises in the opposite region, where the zero potential iso-contour is shifted toward the protein surface in the QTAIMEXP charges instance, because of their high magnitudes when compared with the QVAL charges of the multipolar database values.
In the medium-resolution approaches, atomic details in the electrostatic maps are leveled out (Fig. 11.9). The main electrostatic potential features that were pointed out previously are, however, conserved, i.e. the two negative areas close to the aNH2 group and H8A, and a globally positive region at the level of the adenine rings. It is also observed that the position of the zero iso-contour is rather well preserved with the QVAL charge model whereas it is shifted slightly away from the aNH2 function for the QTAIMEXP charge model when t increases. In maps calculated in the plane perpendicular to the adenine rings, two positive regions appear on each side of the rings. This feature is observed both with the QVAL and QTAIMEXP charge models but is absent from the results calculated with the unit charge model. One thus concludes that if unit charges are su cient to globally model the charge distribution of a whole protein structure they are too limited to properly take into account fine details of a receptor site. The QVAL or QTAIMEXP models should therefore be used.