

Matta, Boyd. The quantum theory of atoms in molecules
.pdf1827 Solid State Applications of QTAIM and the Source Function
Table 7.5 Relationship between bond properties and depth from surface for hydrogen-covered and clean Si(111)(1 1) slabs compared with silicon bulk and SiH4.[a,b]
Bond |
˚ |
DBCP |
rbD100 |
‘ |
2 |
rbD100 |
(l3)bD100 |
e |
Re (A) |
|
|||||||
Si(111)(1 1)aH; Si(111)(1 1) clean |
|
|
|
|
|
|
||
SiaH |
1.487 |
4.1 |
11.40 |
|
38.2 |
76.6 |
0.0 |
|
Si1aSi2 |
2.362 |
1.4 |
8.83 |
13.3 |
2.1 |
0.02 |
||
Si2aSi3 |
2.362 |
0.1 |
8.35 |
11.2 |
2.7 |
0.05 |
||
2.378 |
0.8 |
8.53 |
12.1 |
2.2 |
0.0 |
|||
Si3aSi4 |
2.381 |
0.1 |
8.40 |
11.7 |
2.3 |
0.0 |
||
2.374 |
0.0 |
8.54 |
12.2 |
2.3 |
0.0 |
|||
Bulk Si |
2.375 |
0.0 |
8.53 |
12.1 |
2.3 |
0.0 |
||
|
|
|
12.1 |
|
|
|||
SiaSi |
2.375 |
0.0 |
8.53 |
2.3 |
0.0 |
|||
SiH4 |
|
|
|
|
|
|
|
|
SiaH |
1.476 |
3.8 |
11.9 |
|
37.3 |
80.1 |
0.0 |
|
|
|
|
|
|
|
|
|
|
a Ref. [42]; RHF/3-21G(d,p) periodic or molecular wavefunctions; slabs: totally relaxed geometrical/basis set model [42]. If not otherwise stated, all quantities in a.u.
b Data for the clean surface in italics; DBCP is the distance from the BCP to the XaY bond midpoint, expressed as a percentage of half the bond length. A positive DBCP value indicates that the BCP is closer to X.
tion the ‘‘surface layer’’, i.e. that portion of a crystal having nonbulk properties, is referred to as surface double layer. The ‘‘surface layer’’ of the hydrogen-covered system may be described as a double layer in which the internal layer is composed of Si1 and Si2 atoms. The H and Si1 atoms in the hydrogen-covered surface polarize in such a way as to oppose the electric field created by the CT within the surface double layer. In fact, the H and Si1 atomic dipole nonzero components mz are both directed away from the surface (Table 7.6). The hydrogen coverage has the e ect of reversing and greatly enhancing the magnitude of the Si1 polarization in the clean system, in which Si1 accumulates negative charge outwards. This agrees with the di erences between the Laplacian distribution for the two slabs (Fig. 7.4 bottom). Four-bonded charge concentrations (BCCs) along the corresponding SiaSi bonds are observed for all the Si atoms, except Si1, in both systems. Si1 in the hydrogen-covered surface lacks the BCC associated with the Si1aH bond, because of the large amount of electron transfer from Si1 to the H atom and the ensuing loss of an Si VSCC along this bond. Instead, in the clean surface, the dangling sp3 orbital per surface atom manifests itself as a nonbonded charge concentration (NBCC), characterized by a closer distance from the Si nucleus and half of the Laplacian value at a BCC in the bulk.
By analogy with the bonding properties, almost perfect convergence toward the bulk values are also observed for the integrated properties beyond the first two or
|
|
|
7.4 QTAIM Applied to Surfaces |
183 |
|||
Table 7.6 |
Relationship between atomic properties and depth from |
|
|
|
|
||
|
|
|
|
||||
surface of hydrogen-covered and clean Si(111)(1 1) slabs compared |
|
|
|
|
|||
with silicon bulk.[a,b] |
|
|
|
|
|
|
|
|
|
|
|
|
|
|
|
W |
q(W) |
mz(W) |
DE(W) |
DV1(W) |
D(W) |
||
|
|
|
|
|
|
|
|
Si(111)(1 1):H; Si(111)(1 1) clean |
þ0.43 |
|
|
|
|
|
|
H |
0.736 |
|
18.1 |
|
|
|
|
Si1 |
þ0.698 |
þ1.23 |
0.176 |
3.4 |
|
|
|
|
þ0.003 |
0.31 |
0.206 |
þ42.8 |
8.5 |
|
|
Si2 |
þ0.053 |
0.03 |
0.011 |
þ0.1 |
2.3 |
|
|
|
0.019 |
þ0.06 |
0.068 |
þ3.5 |
1.9 |
|
|
Si3 |
0.015 |
0.03 |
0.016 |
0.4 |
0.8 |
|
|
|
þ0.013 |
þ0.02 |
0.066 |
1.4 |
0.5 |
|
|
Si4 |
0.002 |
0.01 |
0.017 |
1.0 |
0.7 |
|
|
Bulk Si |
þ0.001 |
þ0.01 |
0.060 |
0.5 |
0.6 |
|
|
|
|
|
|
|
|
|
|
Si |
0 |
0 |
0 |
0 |
0.6 |
|
|
|
|
|
|
|
|
|
|
a Ref. [42]; wavefunctions and slabs model as for Table 7.5. All quantities in a.u.; data for the clean surface in italics.
b The only nonzero mz component of the atomic dipole normal to the surface is reported. The z axis is directed away from the surface. Energies DE and volumes DV1 are given relative to bulk silicon
(DX ¼ Xslab Xbulk; X ¼ E; V1Þ; di useness, D, is given by
D ¼ ½ðV1 V2Þ=V1& 100.
three atomic layers. The only exception is the atomic energies, which is not found to converge to bulk values in both slabs, because the electric field created by the surface double layer shifts the binding energies of electrons. This is, therefore, the result of a physical phenomenon known to occur in any finite crystal, i.e. a crystal having surfaces [45]. A more detailed explanation is given on page 895 of Ref. [42].
Figure 7.4 (middle) shows that in the clean slab both Si1 and Si2 atoms have infinite volume, whereas starting from the Si3 atoms inward the atoms have a fi- nite volume, as in the bulk. The surface nature, in particular that of the Si1 atoms, is made evident by their increased V1 volume, relative to that in the bulk (<30% for Si1). In contrast, in the hydrogen-covered slab the Si1 atoms have a finite volume, largely shrunk relative to that in the bulk, and are completely isolated from the outside because of their interaction with H atoms. In this slab the Si2 atoms become the only, nonfinite volume, surface Si atoms, an observation which explains why, experimentally, passivant substitution or oxidation are mediated by Si2 atoms and never occur directly at Si1 atoms [46].
An interesting measure of the ‘‘surface’’ character of an atom in a slab may be obtained by defining a di useness D of its electron distribution, given by D ¼ ½ðV1 V2Þ=V1& 100. As expected, the largest value of D is found for the

184 7 Solid State Applications of QTAIM and the Source Function
Si1 atom in the clean slab (Table 7.6). This atom is characterized by an electron density lower than 0.002 a.u. in more than 8% of the volume of its V1 basin, whereas the corresponding values for Si bulk or for atoms Si3 to Si5 in both slabs do not exceed 0.8%.
7.4.2
Si(111)(2D1) Reconstructed Surface
The Si(111) surface structure obtained after low-temperature (T < 600 K) ultrahigh vacuum cleavage, has a (2 1) reconstruction [39], with two buckled layers of chain-bonded surface atoms (Fig. 7.4). This surface is a prototype of clean semiconductor surfaces and, although apparently simple, has several intriguing features which have motivated almost 30 years of experimental and theoretical efforts [39, 41, 44]. The top layer is formed by threefold-coordinated atoms (Si1 and Si2) and the lower layer by fourfold-coordinated atoms (Si3 and Si4). (There are two unique atoms per layer in the reconstructed surface and one unique atom per layer in the non reconstructed surface. The unique atoms of the first layer (Si1, Si2) and second buckled layer (Si3, Si4) are, respectively, in ideal correspondence with the Si1 and Si2 unique atoms in the unreconstructed Si(111)(1 1) surface. A centrosymmetric slab, with a 2 1 unit cell and consisting of 14 layers, for a total of 28 Si atoms per cell was used [43] to model the (111)(2 1) surface (Fig. 7.4, top, right).) On reconstruction the surface dangling bonds become located on nearest-neighbor sites rather than on next-nearest neighbor sites as in the (111)(1 1) surface and the reconstructed surface structure is customarily interpreted in terms of the Pandey’s p-bonded chain model [47]. According to this model, the zigzag chain of adjacent pz orbitals can, in principle, p-bond as in organic materials, forming bonding and antibonding surface p states.
QTAIM is here used to quantify how close to reality is Pandey’s interpretation of the driving force under surface reconstruction [43]. Analysis of the Laplacian distribution (Fig. 7.4, bottom), shows that in the first buckled layer only Si1 and not Si2 atoms have an NBCC pointing away from the surface. The Si1 NBCC, moreover, has a magnitude which is approximately 20% less than that found for Si1 in Si(111)(1 1). After reconstruction, therefore, the single electrons associated with the nominal dangling bonds of the threefold-coordinated atoms either (Si2) take part entirely in bond reconstruction or (Si1) become at least partially involved in rebonding, compared with the first layer atoms in the Si(111)(1 1) surface. Inspection of bond ellipticity profiles along the bond paths of each pair of bonded atoms in the two outermost layers of the reconstructed surface adds further insight (Fig. 7.5). As expected, the highest p character is that of the Si1aSi2 bond in the first layer. The ellipticity profile along the bond path is indicative of a very asymmetric contribution to the p bond from the two atoms, in accordance with the large di erences found in their Laplacian distributions and atomic properties [43]. Interestingly, significant ellipticities are also observed for the bonds between the first and second layer (Si2aSi3, Si1aSi4) and those within the second layer (Si3aSi4). This reveals that the p conjugation extends over a 2D

7.4 QTAIM Applied to Surfaces 185
Fig. 7.5 Si(111)(2 1) surface. Bond ellipticity (e) profiles along the bond path of each unique pair of bonded atoms in the two outermost layers. Results refer to the LEED geometry for the surface [48]. Adapted, with permission, from Fig. 4 in Ref. [43], F. Cargnoni, C. Gatti, Theor. Chem. Acc. 2001, 105, 309–322 (Copyright 2001, Springer).
array of bonds, rather than being strictly localized along the topmost layer 1D chains, as hypothesized in the Pandey’s model. Adoption of a spin-polarized RHF solution, in place of a simple RHF picture, leads to a significant energy reduction for the reconstructed surface, accompanied by an increased atomic equalization within each pair of bonded atoms and by noticeable enhancement of the surface bonds p-delocalization (Fig. 7.5).
In general, the (2 1) reconstruction involves much larger surface-cell charge distortions than found in the (1 1) surface and noticeable changes in the atomic polarization of the surface layer atoms. The e ect of buckling is to largely di erentiate the properties of the two unique atoms of each surface layer. For example, the net charge of Si1 atom is þ0.138e and that of Si2 is 0.225e (UHF results, at LEED geometry), compared with the value of þ0.003 e for Si1 in the (111)(1 1) surface. These charge rearrangements, along with the onset of a 2D partially p- delocalized bond network, lead to SiaSi bonds in the first two layers that are, on average, as strong as in the crystal [43]. This contrasts with the non reconstructed

186 7 Solid State Applications of QTAIM and the Source Function
surface in which the corresponding Si1aSi2 bonds are, instead, weaker than in the bulk (Table 7.5).
Comparison of the Si1 and Si4 basins (middle, right) with the Si1 and Si2 basins (middle, center) in Fig. 7.4 shows that after the 2 1 reconstruction only the atoms of the topmost layer (Si1, Si2) have infinite volume whereas the atoms of the second layer (Si3, Si4) – di erently from those in the unreconstructed surface
– are already finite, as in the bulk. Convergence toward bulk values of both bond and atomic properties was found to start from the fifth layer inwards, i.e. at a greater depth from surface than in the clean and hydrogen-covered (111)(1 1) surfaces. The reader is referred to Ref. [43] for full details of this QTAIM study.
7.5
QTAIM Applied to Host–Guest Systems
Host–guest chemistry is a fundamental branch of supramolecular chemistry [49] and the guest@host concept has served to describe the structure of most supramolecular systems [50]. Typical questions of host–guest chemistry are the nature of bonding interactions between the guest and the host and the amount of electronic charge transferred to the host from the guest, or vice versa. These are not just academic issues, because the exciting functional properties of these systems, and their optimum tuning, may crucially depend on how the guest binds to the host and how this binding may be suitably chemically modified. Standard methods of bond analysis and charge partitioning may prove particularly inadequate in this area, because these supramolecular assemblies are usually held together by noncovalent interactions (HBs, van der Waals forces, p–p interactions, and/or electrostatic e ects), which are much weaker than covalent bonds and, except for HBs, usually nondirectional. QTAIM, being firmly rooted in physics and not based on any preconception of bonding, is once more the theory of choice.
QTAIM is applied here to two peculiar host–guest crystalline systems – the type I inorganic clathrates A8Ga16Ge30 (A ¼ Sr, Ba), which have promising thermoelectric properties [51], and sodium electrosodalite (SES), in which the guest, which explicitly requires QTAIM to be identified and localized, gives rise to an ordered bcc lattice of F-centers with concentration three order of magnitude higher than in the ionic solids [52].
7.5.1
Type I Inorganic Clathrates A8Ga16Ge30 (A FSr, Ba)
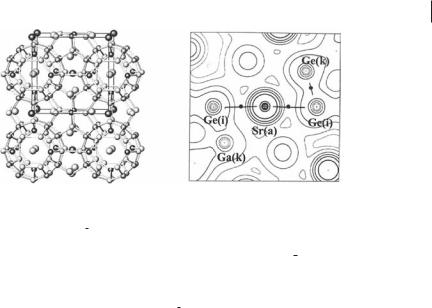
Type I clathrates consist of two type of cage, the twenty-atom dodecahedron and the twenty-four-atom tetrakaidecahedral cages (Fig. 7.6, left), which are usually formed by group 13 and Group 14 elements and which each encapsulate a guest metal atom A [53]. The metal atoms ‘‘rattle’’ in these oversized cages and are known to have localized, low-frequency phonon modes that reduce the thermal conductivity to values comparable to those of amorphous semiconductors, with-
7.5 QTAIM Applied to Host–Guest Systems 187
Fig. 7.6 A8Ga16Ge30 (A ¼ Sr, Ba) (a) The clathrate type I structure (fully symmetric ideal structure, Pm3n space group). The large dark atoms are A guests (2a site) hosted in the twenty-atom cages and the large gray atoms are A guests (6d site) hosted in the twenty-four-atom cages. The small dark gray and light gray atoms are the 6c, 16i and 24k framework sites, respectively. In the Pm3n structure Ga atoms are located at 16i positions. (b) Sr8Ga16Ge30 at minimum P1 geometry – contour map of the ab-initio periodic pseudo-potential (PP) density in a plane containing an Sr atom in a twenty-atom cage (a site) and two Ge atoms at positions i
and k at distances of 3.46 and 3.65 A˚ from the Sr atom. The nuclei on the left of the central Sr atom are less than 0.1 A˚ from the plane of the plot. Positions are labeled according to Pm3n space-group. The bond paths do not terminate at nuclei, because this is a PP density. The Ge and Ga atoms at k positions, with distances from Sr greater than 3.6 A˚ turn out to be nonbonded to the central Sr atom in the P1 geometry relaxed structure. Adapted, with permission, from Figs 1 and 4 of Ref. [59], C. Gatti, L. Bertini, N. P. Blake, B. B. Iversen, Chem. Eur. J. 2003, 9, 4556–4568 (Copyright 2003, Wiley).
out significantly a ecting the semiconductor-like properties of the host cages’ crystalline framework [51]. These systems thus have, potentially, the ideal thermoelectric properties of a phonon glass and an electron single crystal (PGEC) [54].
Structural chemists usually regard these clathrates as Zintl phases in which the guest atoms completely transfer/accept valence electrons to/from the framework [53]. This belief is firmly supported by the observation that all known clathrate type I structures have a common number of 184 valence electrons per unit cell, despite the large number of elemental compositions forming these structures.
Studies on the very promising A8Ga16Ge30 (A ¼ Sr, Ba) thermoelectrics based on theoretical EDD [55] or maximum entropy method (MEM) analysis of experimental EDD [56] have, however, called into question the ionic character of the guest atoms and rather propped up the idea of their almost neutrality. The guest atoms are usually found far from the cage center and with displacements and vibrational frequencies which di er from guest to guest and, for a given guest, from the large to the small cage [55, 56, 57]. This experimental observation gives some credibility to the idea of a not fully ionic metal guest, because a directional, not purely electrostatic guest–host interaction, with possible incomplete CT, seems to be operating. Analysis of the density of states (DOS) and bands features obtained from the same wavefunction from which the theoretical EDD was

1887 Solid State Applications of QTAIM and the Source Function
Table 7.7 A8Ga16Ge30 (A ¼ Sr; Ba): Atomic net charges of guest atoms A compared with corresponding charges in SrO and BaO.[a,b]
System/model |
W |
|
q(W)/e |
|
|
|
|
|
|
|
|
||
|
|
Small cages |
Large cages |
|||
|
|
|
|
|
|
|
Clathrate/ab initio |
Sr |
1.669 |
(0.001) |
1.687 |
(0.005) |
|
|
Ba |
1.743 |
(0.001) |
1.773 |
(0.003) |
|
Clathrate/IAM |
Sr |
0.096 |
|
0.126 |
|
|
|
Ba |
0.858 |
|
0.576 |
|
|
SrO/ab initio |
Sr |
1.717 |
|
|
|
|
BaO/ab initio |
Ba |
1.758 |
|
|
|
|
|
|
|
|
|
|
|
a Ref. [59], data for the most stable P1 clathrate structures [55] and for the SrO and BaO crystals, T2 wavefunction model [59]. There are 2 and 6 unique twenty-atom and twenty-four-atom cages in the P1 structure; average net charges (standard deviations) are listed.
b IAM computation at the Pm3n space group geometry.
derived strongly suggests, however, that the guest atoms are acting as electron donors [55, 58], which seems in sharp contrast [59, 60] with their claimed almost neutrality.
We used QTAIM to shed light on these conflicting views. Table 7.7 shows QTAIM net charges for the guest atoms A for the most stable P1 space groupoptimized structure of each clathrate [58]. Irrespective of whether they occupy the large or the small cage, guest atoms are almost completely ionized. Their net charges, averaged over the two and the six unique twenty-atom and twenty-four- atom cages in the crystal cell, are approximately 1.68e and 1.77e for the Sr and Ba clathrates, respectively. These values are to be compared with the corresponding charges of 1.72e and 1.76e in the SrO and BaO oxides, which are both well known examples of crystalline ionic compounds. Very similar net charges for A ¼ Sr, Ba are obtained for the second more stable clathrate structure and also for the idealized, fully symmetric Pm3n structure having all the Ga atoms in the 16i framework site (Fig. 7.6, left).
The question arises of why this clear-cut picture of the guest ion/neutral atom dilemma is so at odds with previous suggestions from theory [55] and experiment [56]. The main reason is that in these studies charge transfer (CT) was defined relative to a reference density, rather than using QTAIM to identify the actual shape of the atomic basins in the clathrate and then obtain their electron populations. The reference density was taken as the density of the interleaved, noninteracting A8 and Ga16Ge30 sublattices in the theoretical study [55], or as the nonuniform prior density in the MEM experimental analysis. In both studies the electron population on a guest atom, calculated by integrating the EDD within a sphere of given radius centered on the atom, was found to be basically constant whether

7.5 QTAIM Applied to Host–Guest Systems 189
computed from the true density of the clathrate or from the reference densities detailed above. Hence guest-to-host charge transfer was inferred not to occur in the clathrate. Such an empirical evaluation di ers substantially from the QTAIM result [59], because when the interaction among the host framework and the guest atoms is turned on, new attractive and repulsive physical forces come to the play and the EDD should no longer be geometrically apportioned among the host and the guest as when the interaction is turned o . Table 7.7 shows that QTAIM partitioning of the IAM density, as opposed to that of the crystal density, would predict much less ionized guest atoms – the Sr atoms becoming almost neutral and the Ba atoms having their net charge more than halved. The IAM density is not a quantum object, nor is there any physical need for the zero-flux recipe to predict the A atoms to be neutral for IAM densities. It is, however, worth noting that the claim of the presence of almost neutral guest atoms in A8Ga16Ge30 roughly corresponds to the outcome one would obtain if the QTAIM analysis, instead of being applied to the true density of the clathrate, were to be performed on a model density which neglects the charge rearrangement because of bonding.
By describing the guest atoms as highly ionized species, QTAIM analysis reconciles theory with the Zintl phase view structural chemists have of the inorganic class I clathrates. QTAIM results also agree with the negligible contributions provided by Sr and Ba to the valence states close to the Fermi level and with the dominant contributions Sr and Ba provide to the conduction states close to this level (see DOS analysis in Ref. [59]).
Geometry relaxation from the fully symmetric Pm3n clathrate structure to the most stable and second most stable P1 structures leads to noticeable displacement of Sr and Ba atoms from the centers of the twenty-atom and, particularly, the twenty-four-atom cages, for which the displacement is as large as 0.81 and 0.42 A˚ for Sr and Ba, respectively [56]. The force driving this guest atom disorder lies in the replacement of the many, very weak, guest–host bonds present in the fully symmetrical clathrate cages (twenty for the small cage and eight for the large cage) with the fewer, stronger and shorter chemical interactions characterizing the P1 geometry clathrates (Fig. 7.6 right) [59]. For example, only 2.8(8) and 4.0(11) guest–host BCPs are found on average for the Sr and Ba clathrates in the large cages, instead of the eight present in the fully symmetrical structure. These remaining bonds are, however, substantially stronger, as indicated by the 50% (Sr) and 16% (Ba) average increases of their rb values relative to those of the
corresponding bonds in the Pm3n clathrate structure. Di erences between the rattling frequencies in the Sr and Ba clathrates, and between their larger or smaller cages, have recently been related to, and found to comply with, the relative strength of the guest–host interactions, as ordered by the rb values [57]. On the whole, all the recovered bonds, including those significantly strengthened after clathrate geometry relaxation, retain properties typical of a closed-shell ionic interaction (low rb, low and positive ‘2rb; BCP location close to the positive ion), with the guest–host binding energy being essentially electrostatic in nature. Full details on this study may be found in the original papers [59, 60].
190 7 Solid State Applications of QTAIM and the Source Function
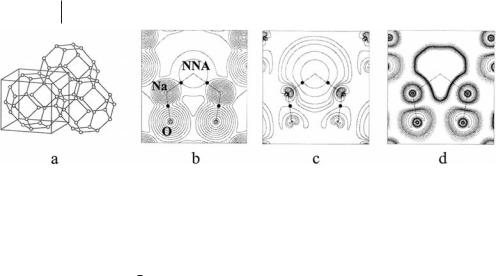
Fig. 7.7 F center in sodium electrosodalite (SES). (a) Schematic diagram of the sodalite framework formed by a bcc array of b cages consisting of regularly alternating SiO4 and AlO4 tetrahedrons. The circles in the figure correspond to regularly alternating Al and Si atoms bridged by an O atom. In the SES (space group P43n), the Na43þ tetrahedral clusters are located inside each b cage. There are two b cages and two unpaired electrons in each unit cell (ferromagnetic phase). The NNAs associated with the F centers are located at the center (2a site) of the Na43þ clusters and form a bcc lattice, with same cell parameter as SES. (b) Total electron density and (c) spin density in the sodalite cage, in the ð1; 1; 0Þ plane. Contour levels at 2, 4, and 8 10n a.u., with n ranging from 0
7.5.2
Sodium Electrosodalite
to 3 for the total density and from 0 to 4 for the spin density. In the spin density the first line is the zero contour. The contour level closest to the NNA has similar shapes and equal value (0.004 a.u.) in both maps, because the F center contains almost solely unpaired electron density. (d) ELFa in the
ð1; 1; 0Þ plane. The first dashed contour is the zero contour and the increase is 0.05 per contour up to 0.45. The first full contour has the value 0.5 and the increase is 0.05 per contour up to 1.00. (Adapted, with permission, from Figs. 1, 2, and 4 from Ref. [62] G. H. K. Madsen, C. Gatti, B. B. Iversen, L. Damjanovic, G. D. Stucky, V. I. Srdanov, Phys. Rev. 1999, B59, 12359–12369; Copyright 1999, American Physical Society).
The sodalite host framework, (SiAlO4)6, is a bcc array of b cages consisting of regularly alternating SiO4 and AlO4 tetrahedrons (Fig. 7.7a). To balance the formal negative charge of the host, each b cage contains three positive guest Na atoms. When exposed to sodium vapor the sodalite gradually turns blue, then purple, and eventually black [61]. The color change has been ascribed to formation of F centers in the tetrahedral Na43þ clusters containing the three existing Na ions and the excess Na atom absorbed in each b cage. The resulting sodalite structure, named sodium electrosodalite (SES) has cubic symmetry with each unit cell containing two b cages and two perfect tetrahedral arrangements of sodium atoms inside each b cage [Na8(SiAlO4)6]. The unit cell thus contains two unpaired electrons and SES undergoes an antiferromagnetic transition at 48 K [52]. The unpaired electrons are thought to have predominantly s character, because of the spherical symmetry of the sodalite cage, and this material has been identified as the first example of an s-electron antiferromagnet. Electron density distributions for the ferromagnetic and the antiferromagnetic phase are very much alike, with
|
|
|
7.5 QTAIM Applied to Host–Guest Systems |
191 |
||
Table 7.8 |
Atomic and nonnuclear attractor (NNA) properties in the |
|
|
|
||
|
|
|
||||
ferromagnetic phase of sodium electrosodalite Na8(AlSiO4)6.[a] |
|
|
|
|||
|
|
|
|
|
|
|
W |
N(W) |
NaCb (W) |
VT(W) |
G(W)/N(W) |
||
|
|
|
|
|
|
|
NNA |
0.730 |
0.692 |
316.3 |
0.09 |
|
|
O |
9.757 |
0.012 |
135.5 |
7.69 |
|
|
Na |
10.095 |
0.041 |
71.9 |
15.93 |
|
|
Si |
10.572 |
0.000 |
18.2 |
27.31 |
|
|
Al |
10.369 |
0.000 |
23.3 |
23.13 |
|
|
|
|
|
|
|
|
|
a Ref. [62]; all quantities in a.u.; Na b is (Na Nb ), the excess number of electron of spin a in the atomic basin and GðWÞ=NðWÞ is the basin kinetic energy G per electron.
alternating ordering of the spin density being the only di erence between the two phases [62]. (For this reason, we report here only the QTAIM analysis for the ferromagnetic phase.)
When the guest Na atom is added to the sodalite host, we know exactly, from structural analysis, where the Na cation goes. It becomes totally indistinguishable from the pre-existing Na cations. The question remains, however, of where the extra electron added to each sodalite cage ‘‘locates’’. Is it primarily delocalized over each Na ion clusters or is it (well) localized somewhere? And, supposing we can physically ‘‘identify’’ this electron as another ‘‘atomic’’ constituent of the lattice, can this new constituent be related to the formation of the bcc lattice of F centers in SES?
As shown in Fig. 7.7b, QTAIM analysis of the SES periodic UHF electron density distribution finds an NNA, located at the center (2a site) of each Na43þ cluster and bonded to its neighboring four Na atoms [62]. Spatial distribution of NNAs gives rise to a bcc lattice with the same cell parameter as SES and with the same spatial distribution of the F centers determined from spectroscopy. The unpaired electron therefore has a separate identity – it behaves as a quantum mechanical open system and has its own set of properties (Table 7.8). In the real space, the F center manifests itself as the union of a maximum in the electron density at the nonnuclear position 2a and of the basin associated with this NNA. As shown in Table 7.8, the F center has an electron population of 0.730e and contains almost solely unpaired electron density, with over 97% of the electrons being spin a electrons. This explains why the electron density and the spin density distribution in the sodalite cage look very much the same in a large region surrounding the NNA (Figs. 7.7b and 7.7c). Over 69% of the unpaired density in the unit cell is contained in the two F center basins, the remaining 31% being shared between the eight Na (16.4%) and the twenty-four O basins (14.4%).
We now use the ELF distribution for the a-spin orbitals, ELFa [21, 62], to demonstrate that the unpaired electron density in the F-center basin is to a large extent associated with a localized a-spin orbital. Indeed, the Na–NNA BCP lies close