

Matta, Boyd. The quantum theory of atoms in molecules
.pdf192 7 Solid State Applications of QTAIM and the Source Function
to the 0.5 ELFa contour (Fig. 7.7d) and, by moving toward the center of the Na tetrahedron, i.e. toward the NNA, ELFa rapidly increases regularly up to the value of unity. If the density is dominated by a single, localized a-spin orbital in the NNA basin, the local curvature of the spherically averaged same-spin conditional pair density has to vanish or nearly vanish [10] and, as a consequence, the ELF value must approach unity. As expected, complementary behavior is observed for the corresponding map for ELFb [21, 62], with most of the volume of the NNA basin being characterized by an ELFb value close to zero.
The NNA basin has the largest basin volume (316 a.u.) and a very low and flat electron density, yielding an average volume per electron of 433 a.u., approximately 31 times than that of the oxygen anions, the second most ‘‘diluted’’ atoms. The 1.46e of the two F-center basins in the unit cell occupy 13.4% of the crystal volume, even though they represent only 0.32% of the total electronic charge. The electron density is very loosely bound in the F-center basins, as indicated by the very low kinetic energy per electron, GðWÞ=NðWÞ value of 0.09 a.u. (Table 7.8). Such a value can be compared with those of other NNA basins associated with ‘‘free electrons’’ in the alkali metal clusters (0.06–0.08 a.u.) [17, 62, 63], in the Be metal (0.282 a.u.) [62, 64], and in a cluster model of an F-center in an ionic solid (0.184 a.u.) [65].
7.6
The Source Function: Theory
Few years ago, Richard Bader and I showed [14] how the electron density at any point r within a molecule may be viewed as consisting of contributions from a local source LSðr; r0Þ operating at all other points of the space where the local source has the expression:
rðrÞ ¼ ð LSðr; rOÞ drO ¼ ðW LSðr; rOÞ drO þ W 0W ðW LSðr; rOÞ drO |
ð3Þ |
||||||||
|
|
|
|
|
X0 |
|
|
|
|
LS |
r; rO |
|
1=4p |
‘2rðrOÞ |
|
ð |
4 |
Þ |
|
Þ ¼ ð |
Þ jr rOj |
||||||||
ð |
|
|
|
||||||
In Eq. (4), the Green’s function ð4pjr rOjÞ 1 is an influence function [66], which represents the e ectiveness of the cause ‘2rðr0Þ to give rise to the e ect r(r). The e ectiveness depends on the reciprocal of the distance between the element
of Laplacian of the density ‘2rðr0Þ dr0 |
|
and the point of interest given by r. (By |
||||
ð |
|
Þ ¼ ð |
|
Þ |
Ð jr ðrOj |
|
combining Eqs. (3) and (4), one gets r |
r |
|
1=4p |
|
‘2r rOÞ |
drO. This expression |
|
|
|
||||
is formally equivalent to that for W(r), the electrostatic potential generated at r by the system’s electron distribution rðrÞ. One may envisage rðrÞ as the potential generated at r by the system’s Laplacian density distribution [14].)

7.6 The Source Function: Theory 193
Calling the integral of LSðr; r0Þ over the basin of an atom or group of atoms the source function (SF) contribution, Sðr; WÞ, from that atom or group of atoms to rðrÞ:
ð
LSðr; rOÞ drO 1Sðr; WÞ |
ð5Þ |
W
one can envisage the electron density at a point within an atom as determined solely by an internal SF self-contribution and by SF contributions from the remaining atoms or groups of atoms within a molecule:
rðrÞ ¼ Sðr; WÞ þ |
X0 |
ð6Þ |
Sðr; W0Þ |
||
|
W 0W |
|
The SF is thus a measure of the relative importance of an atom’s or group’s contribution to the density at any point [14]. The decomposition a orded by Eq.
(6) enables one to view the properties of the density from a new perspective and establishes the SF as a novel tool for providing chemical insight [14, 67]. (Modified versions of the PROMEGA/PROAIMV and TOPOND-98 software enable one to evaluate the atomic SF contributions to the density at a selected list of points. This software is available from the author upon request.)
At this point one may ask oneself which is the physical meaning behind the local source LSðr; r0Þ. Several interpretations are possible [14, 66, 68], the more insightful being probably that which links LSðr; r0Þ with the local expression of the virial theorem [6]:
LS |
r; rO |
|
1 |
|
2GðrÞ þ VðrÞ |
|
7 |
|
||||
Þ ¼ p |
|
Þ |
||||||||||
ð |
|
j |
r |
|
rO |
j |
ð |
|||||
|
|
|
|
|
|
|
|
|
||||
The local source is thus related to the failure to locally satisfy the virial relationship between twice the integrated kinetic energy and virial field densities. Molecular regions where the electron density is concentrated ð‘2rðr0Þ < 0Þ and where the potential energy dominates the kinetic energy are a source for the electron density at a point r. Conversely, regions where the electron density is depleted ð‘2rðr0Þ > 0Þ and where the kinetic energy dominates potential energy act as a sink, removing electron density at r. The e ectiveness of the electron density at r0 to be a source or a sink for the electron density at another point r is then related to the magnitude of its charge concentration or depletion at r0, weighted by the inverse of the distance between the two points.
The SF may be investigated using as a reference point any point r in a system, including the nuclei and the NNAs [67]. The BCPs have usually been taken as the least biased choice for points representative of bonding interactions [14, 67]. For an isolated atom, the SF contribution to any point r is always positive, because rðrÞ is b0 everywhere. For systems with more than one atom, it is found that, in

194 7 Solid State Applications of QTAIM and the Source Function
general, the positive LS contributions from an atomic basin to the density at system’s BCPs dominate its negative contributions. In some special circumstances, however, it may happen that an atom acts as a sink rather than as a source for the density at a given system’s BCPs [67]. The relevance of such instances will be discussed in Sections 7.6.2 and 7.6.3.
Analysis of LSðBCP; r0Þ profiles with r0 running along a bond path have been discussed for the series of second-row diatomic hydrides and for several hydro- gen-bonded systems in the gas and crystalline phases [68]. With respect to the integral form of the SF function, the study of its local form, LSðBCP; r0Þ, along a bond path, introduces further detail. It enables discovery of which regions in the basins of the two linked atoms accumulate or remove charge at the BCP, as a function of the nature of the bond and of the external perturbations (substituent e ects, crystal field, etc.) acting on this bond. The local form of the SF is discussed no further in this chapter. It does, however, represent an interesting fingerprint of a given bonding interaction and the reader is referred to the original paper [68] for further details.
7.6.1
The Source Function and Chemical Transferability
The SF has been used in several examples [14, 67] as a very sensitive measure of an atom’s or chemical group’s transferability and of the consequences thereof. Indeed, the ‘‘perfect’’ transferability of a group property from one molecule to another not only implies a corresponding transferability of the group’s electron density but also that the sum of contributions to this density from the remaining atoms or group of atoms in the system remain constant.
After ethane the terminal methyl group in n-alkanes is known to have transferable atomic properties, for example energy, electron population, volume, and spectroscopic properties, irrespective of the length of the chain [6]. The transferability of the electron distribution in the methyl group is good enough also to yield a constant value of rb at its unique CaH bond. The SF group contributions to this rb value are displayed in Table 7.9 for ethane, propane, butane, and pentane [14]. The contribution from the atoms in the methyl group to rb are constant at 0.270 a.u. throughout this series, with the contribution from the two equivalent hydrogen atoms of the methyl group to this amount equaling 0.0210 a.u. for all four molecules. The contribution from the neighboring methylene group seems to be constant after ethane. The constancy in the rb value (0.283 a.u.) for the terminal CaH bond is because there is a constancy in the sum of the source contributions to rb from groups external to the methyl group, the quantity Sðrb; extÞ, irrespective of the length of the chain. Thus extending the propane chain by removing a hydrogen atom from the external methyl group and replacing it with another methyl group yields an ethyl group, whose SF in butane contributes 0.0036 a.u. to rb compared with 0.0035 a.u. from the external methyl group in propane. When this ethyl group is further extended by a methylene group to ob-
|
|
|
|
|
7.6 |
The Source Function: Theory |
195 |
||
Table 7.9 |
Source function contributions to HaCH2 BCP in methyl group.[a] |
|
|
|
|||||
|
|
|
|||||||
|
|
|
|
|
|
||||
Molecule |
Atomic group source function contributions |
rb(HxCH2) |
S(rb; ext) |
||||||
|
|
|
|
|
|
|
|
|
|
Ethane |
HaCH2 |
CH2 |
H |
|
|
0.2830 |
0.0126 |
|
|
|
0.2704 |
0.0100 |
0.0026 |
|
|
|
|
|
|
Propane |
HaCH2 |
CH2 |
CH3 |
|
|
0.2827 |
0.0126 |
|
|
|
0.2701 |
0.0091 |
0.0035 |
|
|
|
|
|
|
Butane |
HaCH2 |
CH2 |
CH2 |
CH3 |
|
0.2827 |
0.0127 |
|
|
|
0.2701 |
0.0091 |
0.0020 |
0.0016 |
|
|
|
|
|
Pentane |
HaCH2 |
CH2 |
CH2 |
CH2 |
CH3 |
0.2827 |
0.0127 |
|
|
|
0.2702 |
0.0090 |
0.0019 |
0.0008 |
0.0009 |
|
|
|
|
|
|
|
|
|
|
|
|
|
|
a Ref. [14]; all quantities in a.u.; Sðrb; extÞ is the sum of source contributions to rb from groups external to the methyl group. It is given by the sum (except HaCH2) of the atomic group source contributions listed in the second column for each molecule.
tain the propyl group in pentane, the SF contribution remains unchanged at 0.0036 a.u. Thus the ethyl group in propane contributes the same as the butyl group in pentane, with the result that the H and C atoms of the methyl have their characteristic properties in hydrocarbons.
The series LiaX (X ¼ F, O, N, Cl, H) is another interesting example of the use of the SF as a very sensitive tool to test the extent of chemical transferability [67]. The Li atom in this series is known to have nearly constant and transferable properties, including its net charge and atomic energy [6]. In the limit of perfect transferability, the SF contribution from Li at the BCP should remain constant along the series and changes in rb values, as a function of X, should only be determined by correspondingly equal changes in Sðrb; XÞ. As shown in Ref. [67], the rb value decreases by almost a factor of two along the series and similar behavior is found for Sðrb; LiÞ. The change of Sðrb; LiÞ along the series indicates that this quantity is a more sensitive index of a departure from perfect transferability than are the integral averages yielding the atomic population and energy. Interestingly, the profiles of Sðr; LiÞ along the LiaX axis, show that the Li atom makes a constant contribution to rðrÞ for any X, up to a distance of 0.58 A˚ from the Li nucleus (Fig. 3 in Ref. [67]). This is near the distance of the BCP closest to the Li nucleus in the series. The observed changes in Sðrb; LiÞ are merely a consequence of the progressive shift towards the X nucleus along the series.
The most important result is that the contributions from Li to rb remain almost constant throughout the series, at approximately 40%, however. The constant cationic nature of Li in the LiX series seems to be mirrored in a constant percentage SF contribution from Li to rb rather than in a constant source. The shift in the BCP location along the series serves to maintain constant this relative contribution of Li to rb.

1967 Solid State Applications of QTAIM and the Source Function
7.6.2
Chemical Information from the Source Function: Long and Short-range Bonding E ects in Molecular Complexes
This section shows how the SF may be used as a tool to disclose the extent of local/nonlocal character of a bonding interaction, using only information contained in the system’s electron distribution. Hydrogen-bonded molecular complexes [67] are discussed at length and very recent results [69] on the ‘‘metal– metal’’ bond in polynuclear metallic complexes are discussed briefly.
Energies of hydrogen-bonds, which extend from approximately 15 to 50 kcal mol 1 for strong bonds down to 1 to 4 kcal mol 1 for weak bonds, are evidence of a wider range of atomic interactions than is observed for covalent or ionic bonds or van der Waals forces [70]. The dominating energy contributions depend on the nature of the H-donor (D) and H-acceptor (A) atoms and of the distance, dD A between them.
The reaction path for approach of two water molecules, within the linear Cs constraint, is first introduced as a guide to understanding how the SF contribu-
tions to the hydrogen bond rb value change with changes in the nature of the HB. Table 7.10 reports percentage atomic sources, SðW0 þ W00 þ Þ%, from dD A distances typical of a weak isolated HB to those occurring in very strong HBs, the dD A equilibrium distance being 3.020 A˚ , at the RHF/6-311G(2d,2p) level. As shown in the table and in Fig. 7.8a, the atomic percentage contributions change dramatically along the reaction path. It is only the percentage global contribution from either the H-donor or the H-acceptor molecule which remains almost constant, and not dissimilar from each other, at values of approximately 44–48% and 56–52%, respectively. Also stable enough, and approximately 30– 40%, is the value of S(HþD)%, the percentage contribution from the H involved in the HB and the oxygen donor D. Its relative constancy indicates that, besides the donor and acceptor molecules, DaH also behaves to a some extent as an atomic ‘‘transferable’’ group. Conversely, the percentage source contribution from the H, S(H)% seems to be the most distinctive marker of the change of the nature of the hydrogen-bond along the reaction path. S(H)% is very small and positive only for very short dD A distances and rapidly becomes negative and even highly negative at distances larger than 2.5 A˚ . At equilibrium distance, S(H)% is as negative as 72.3%. Why is this so? In weak and moderate strength HBs, the shape of the H basin and of the Laplacian distribution along the OH O axis are highly asymmetric, with regions of negative Laplacian surrounding the OaH BCP and with the HB critical point being, instead, located in a region of pronounced positive Laplacian (Fig. 6, Ref. [67]) and, hence, of negative local source contributions, LSðBCP; r0Þ. As the dH O distance increases, the HB critical point moves progressively away from the OaH negative Laplacian region and becomes surrounded by regions of positive Laplacian of increasing size and located within the H basin. Accordingly, the SF contributions from the H to the HB critical point become increasingly negative the larger the oxygen donor to oxygen acceptor separation.
|
|
|
|
|
|
7.6 |
The Source Function: Theory |
197 |
||
Table 7.10 Source contributions at the hydrogen-bond CP along the |
|
|
|
|
||||||
|
|
|
|
|||||||
reaction path for the approach of two water molecules and in a number |
|
|
|
|||||||
of prototypical hydrogen-bonded complexes.[a,b,c] |
|
|
|
|
|
|||||
|
|
|
|
|
|
|
|
|
|
|
˚ |
rb |
‘ |
2 |
rb |
S(H)% |
S(HBD)% |
S(HBDBA)% |
SMolD% |
||
dD A, A, system, |
|
|||||||||
hydrogen-bond class |
|
|
|
|
|
|
|
|
|
|
|
|
|
|
|
|
|||||
Reaction path for the approach of two water molecules |
|
|
|
|
|
|||||
3.25 |
0.010 |
|
0.041 |
116.0 |
28.6 |
31.6 |
47.7 |
|
|
|
3.02, 1, IHB |
0.016 |
|
0.067 |
72.3 |
34.3 |
53.0 |
47.6 |
|
|
|
2.75 |
0.031 |
|
0.124 |
35.5 |
38.7 |
71.0 |
48.4 |
|
|
|
2.50 |
0.056 |
|
0.216 |
12.5 |
42.9 |
83.9 |
46.4 |
|
|
|
2.25 |
0.106 |
|
0.333 |
þ2.8 |
42.5 |
88.7 |
46.2 |
|
|
|
2.00 |
0.199 |
|
0.208 |
þ13.1 |
42.7 |
93.5 |
44.7 |
|
|
|
Prototypical hydrogen-bond complexes |
|
72.3 |
|
|
|
|
|
|||
3.02, 1, IHB |
0.016 |
|
0.067 |
34.3 |
53.0 |
47.6 |
|
|
||
2.75, 2, PAHB |
0.035 |
|
0.092 |
14.4 |
38.7 |
69.7 |
– |
|||
2.54, 3, RAHB |
0.056 |
|
0.148 |
þ2.1 |
36.8 |
70.8 |
– |
|||
2.37, 30, RAHB* |
0.177 |
|
|
32.2 |
40.7 |
89.5 |
– |
|||
|
0.425 |
|||||||||
2.43, 4, (CAHB) |
0.167 |
0.392 |
32.1 |
40.4 |
90.3 |
43.8 |
|
|
||
2.41, 5, þ(CAHB) |
0.167 |
0.415 |
31.4 |
41.0 |
92.7 |
43.5 |
|
|
||
a Ref. [67]; All quantities in a.u. if not otherwise stated.
b The hydrogen bond (HB) systems are labeled as in the text and in Fig. 7.8 and are classified according to the HB class they belong [71]. H, D, A are, respectively, the H directly involved in the HB, the hydrogen-donor and the hydrogen-acceptor O atoms. For system 2 only one HB is reported, the other two being very much alike.
SðW0; W00; . . .Þ expresses the sum of percentage source contributions from atoms ðW0; W00; . . .Þ. SMolD% is the percentage source contribution from the hydrogen-donor molecule, for those systems for which this molecule can be identified.
c System 30 is classified as RAHB*, because it does not correspond to the energy minimum equilibrium configuration but to the TS for H atom migration.
At variance with the situation for typical covalent bonds, for which the sum of SF contributions from the two bonded atoms to their BCP rb value is usually at least as large as 90% [67], the percentage contributions from the H and the donor oxygen, S(HþD)%, or from the H and the acceptor oxygen, S(HþA)%, are usually much smaller, if not even negative. This is the result of the hydrogen-atom behaving as a sink for most of the D A distances and as a scarce source at very short distances. Percentage values close to 85–90% are obtained only when the sum of percentage contributions from all the three atoms directly involved in the HB, S(HþDþA)%, is considered, and only for dH O distances below 2.5 A˚ . This confirms the at least three-center nature of HBs [71]. As shown in Table 7.10, however, the sum of SF contributions from the remaining atoms in the molecular
198 7 Solid State Applications of QTAIM and the Source Function
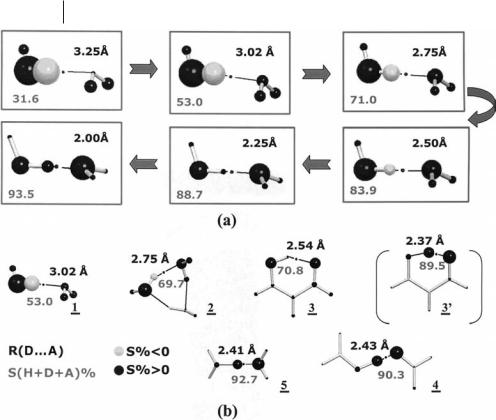
Fig. 7.8 Hydrogen-bonded molecular complexes – percentage atomic source contributions to the electron density at the HB critical point. (a) Changes of percentage atomic source contributions along the reaction path for the approach of two water molecules, within the linear Cs dimer constraint; (b) Typical hydrogen-bonded systems: 1 water dimer at equilibrium geometry; 2 cyclic homodromic water trimer; 3 malonaldeyde, Cs equilibrium form, and 30, C2v transition state for hydrogen migration; 4 open form of the formic acid–formate anion complex; 5 H5O2þ. Source contributions are displayed as balls whose volume is proportional to the percentage contribution from each atom, with positive sources dark shaded and negative sources light shaded.
The black dot denotes the HB critical point for which atomic source contributions are evaluated. The source contribution from the H atom directly involved in the HB is a distinctive marker of the nature of the HB. S(HþDþA)% values are shown for each system and represent the sum of percentage sources from the H atom directly involved in the HB and from the hydrogen-donor and hydrogen-acceptor oxygen atoms. The sum of sources from the remaining atoms are as large as 47% in 1, an HB dominated by electrostatic interactions, and become less than 10% in the essentially covalent HBs 4 and 5. (Adapted, with permission, from Figs. 5 and 7 of Ref. [67], C. Gatti, F. Cargnoni, L. Bertini, J. Comput. Chem. 2003, 24, 422–436, Copyright 2003, Wiley).

7.6 The Source Function: Theory 199
complex becomes large past 2.5 A˚ and, for instance, is as large as 47% at equilibrium. With the exception of short dH O distances, the description of the OH O bond as a three-center interaction seems far from reality. As the donor-to-acceptor distance increases, other atoms in the complex become progressively involved in the hydrogen-bond (Fig. 7.8a), in accord with the increasing electrostatic character of the interaction.
The trend of SF contributions at the HB critical point occurring in real, prototypical hydrogen-bonded systems can now be easily appreciated. Following the Gilli and Gilli HB classification [71], Table 7.10 report data for:
1. the water dimer at equilibrium geometry, an isolated HB (IHB);
2. the cyclic homodromic water trimer, a polarization-assisted HB, (PAHB);
3. malonaldeyde, in its Cs equilibrium form, a resonanceassisted HB (RAHB);
4. the open form of the formic acid–formate anion complex, a negative charge-assisted HB, ( )CAHB; and
5. the symmetrical [H2O H OH2]þ dimer, a positive charge assisted HB, (þ)CAHB.
Also listed in the table are the data for the C2v malonaldehyde TS (30) for hydrogen-atom transfer between the two oxygen atoms. The percentage source from the H is corroborated as a characteristic, ideal marker of the nature of the hydrogen-bond, with changes in value as a function of the nature of HB that are even more pronounced than for the water dimer at di erent distances (Table 7.10 and Fig. 7.8b). This same behavior is observed for changes of percentage sources from other atoms and groups of atoms. The role of atoms other than the triad of atoms directly involved in the hydrogen-bond is clearly confirmed. The sum of the contributions from their sources is large for the IHB (47.0%), intermediate for the PAHB (30.3%) and the RAHB, and, indeed, small for the GCAHB complexes, consistent with the increased HB covalence along the series. Interesting are the values for malonaldeyde, the RAHB model system. The percentage contribution from the HþDþA triad of atoms is as low as in the water trimer PAHB, which has a donor-to-acceptor distance approximately 0.2 A˚ larger. It seems that the RAHB molecule 3 is characterized by an enhanced source contribution from atoms other than the HþDþA triad and by local character of the DaH and DaA interactions less than expected on the basis of the donor–acceptor separation only. Similar features occur in the transition state 30, which has more delocalized sources than the CAHB system 4, despite a smaller dD A distance than 4. Further details on the classification of HBs according to the SF are reported in the original paper [67], with an interesting parallel between such a classification and that a orded [72] using the ELF.
We move now to the metal–metal bond. Since its discovery back in the 1960s, the metal–metal bond has kept challenging theory to enable detailed understanding of its nature in many transition metal molecular complexes. The advent and

200 7 Solid State Applications of QTAIM and the Source Function
increasing acceptance of topological analysis of the chemical bond have made it manifest that many traditional ideas of bonding are not applicable to these atypical bonds [73, 74]. Yet, even within the realm of topological approaches, well established bond classification schemes must be critically reconsidered and revised when applied to metal–metal bonds [21, 75]. For example, bond classification based on the sign of ‘2rb has proved to be largely inadequate [75] for bonds that usually involve atoms missing the outermost regions of charge depletion and concentration in their atomic Laplacian distributions and that have very low j‘2rbj values, which makes the sign of ‘2rb quite indeterminate and the use of ‘2rb, as the only classification index deceiving. Other quantities, for example the QTAIM delocalization indices, the jVb=Gbj ratio [76], the energy density Hb, the bond degree, Hb=rb [76], the synaptic order, and the population of ELF valence basins [77, 78] have all been proposed as more informative topological indices in these instances [75, 79, 80]. Their application to an X-ray charge density study is in practice precluded, however, because evaluation of these indices requires the knowledge of the first (and second) density matrices which are, in general, not directly amenable to experiment. We have thus tested [69] SF analysis for several first transition row saturated and unsaturated binuclear homoleptic metal carbonyls, some of which have been seriously investigated both by theory and experiment [74, 81–83], and for the M2(formamidinate)4 complexes for which a comparative QTAIM and ELF study has already appeared [73].
The SF percentage contributions in Mn2(CO)10, a system with a formal metal– metal bond order of unity and whose bonding is still a matter of debate, are presented in Fig. 7.9 [74, 82, 83]. The Mn atoms act as a sink for the electron density
Fig. 7.9 Percentage atomic source contributions in Mn2(CO)10. Percentage sources at the MnaMn BCP (left), MnaCeq BCP (middle) and (CaO)eq BCP (right) are shown (Ceq 1equatorial C). The percentage sources are portrayed with the same convention as in Fig. 7.8. Numerical values for the dominant positive and negative percentage sources are also displayed.
Sources from the two atoms connected by the bond path are as high as 98.2% for the strong covalent–polar (CaO)eq bond, 63.8% for the MnaCeq dative bond, and highly negative ( 50%) for MnaMn bond, where the carbonyl O atoms overbalance the electronic charge subtracted at BCP from the two Mn atoms.

7.6 The Source Function: Theory 201
at the metal–metal BCP and the carbonyl groups, essentially the carbonyl oxygen atoms, provide a positive contribution to rb, so outweighing the negative source from the two Mn atoms. The SF views the MnaMn bond in Mn2(CO)10 as strongly nonlocalized, with the ligands inducing a noticeable polarization of the Laplacian distribution of the Mn basins so that they remove electronic charge from the bond midpoint. Conversely, a very di erent distribution of sources is observed for the dative MnaCeq bonds and, in particular, for the (CaO)eq bonds, with the sum of percentage sources from the two linked atoms being 63.8% and 98.2%, respectively. Similar behavior is observed for the axial MnaC and CaO bonds, with small changes in the percentage source values relative to the equatorial bonds, paralleling the corresponding small changes in the bond lengths. Although the contribution from Mn and C to the MnaCeq BCP is positive and almost equally distributed between the two atoms, it is smaller than that of polar or nonpolar covalent bonds. The most important ‘‘external’’ contribution comes from the neighboring oxygen atom (14%), the other atoms in the molecule contributing the remaining 22.2%. For (CaO)eq the percentage sources comply with the supposedly covalent/polar nature of this bond, despite the positive, close to zero, Laplacian value found at the BCP. The polar character of the bond results in the O atom percentage source being significantly higher (57.8%) than that of the C atom (40.4%).
In the Co2(CO)x (x ¼ 8–5) series [84], source contributions from the Co atoms increase and become positive with decreasing net positive charge on the Co atom and with increasing formal CoaCo bond order, from one to four [69]. Trends of source contributions from Co atoms parallel the corresponding trends of d(CoaCo) delocalization indices. Other proposed bond indices, such as ‘2rb, the bond degree, Hb/rb, and jVjb=Gb, all fail to reproduce the trends in the d(CoaCo) delocalization indices. In contrast, agreement between the source contributions and the delocalization indices persists even when the CoaCo BCP is lacking and the CoaCo mid-point is used to replace the CoaCo BCP as a reference point for evaluating the source contributions. The presence (Co2(CO)8, D3d) or not (Co2(CO)8, C2v) of a CoaCo BCP is, however, mirrored in characteristic different local source profiles along the CoaCo internuclear axis in the two cases. Although this analysis [69] has been performed on theoretically derived electron densities, it may be easily extended with no approximations to charge densities obtained from experiment, if available.
7.6.3
The Source Function: Latest Developments
The SF may be used to introduce an unambiguous full-electron population analysis [67]. By integrating Eq. (6) over a basin W, Eq. (8) is obtained:
NðWÞ ¼ |
ðW rðrÞ dr ¼ |
ðW Sðr; WÞ dr þ W 0W ðW Sðr; W0Þ dr |
ð8Þ |
|
|
X0 |
|