242 9 Atoms in Molecules Theory for Exploring the Nature of the Active Sites on Surfaces
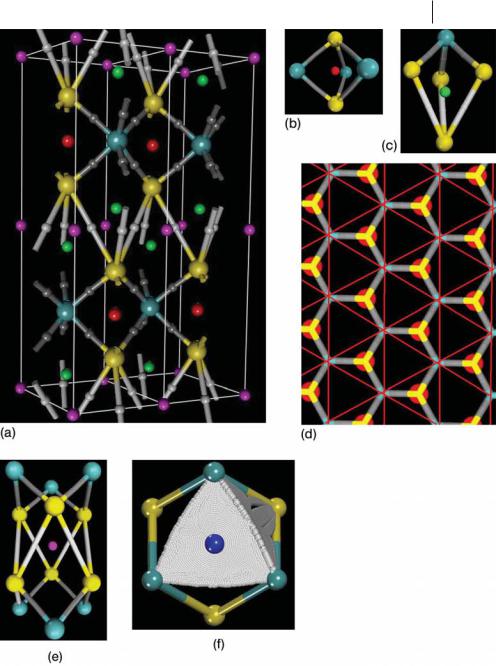
Fig. 9.5 (a) Bond (dark gray spheres) and cage (red spheres) r(r) critical points located inside the bulk MoS2 sheets. Large light blue and yellow balls denote the Mo and S atoms, respectively. (b) Representation of the ring surface (white faces) defined by the gradient paths that originate at the ring CPs (blue spheres) and end at the nuclei. Three of these ring surfaces define the faces of the red cages.
This cage is defined by just three nonplanar curved faces (Fig. 9.5b) with a ring CP at the center of each face. A set of four MoaS bond paths delineates each of those ring structures. The set of gradient paths which originates at each of those ring CPs and terminate at the nucleus defines the so called ring surface (Fig. 9.5b). A set of three of those ring surfaces defines the cages located at b.
An additional set of six SaS bond CPs was also found at position g (white spheres in Fig. 9.6a) in the middle of each pair of neighboring MoS2 sheets. These bond CPs are weaker interactions than the MoaS bonds, as evidenced by the values of r (rMoaS ¼ 0:0908 au and rSaS ¼ 0:0112 au) at rc and are characteristic of van der Waals interactions [1, 10, 58–60]. Similar results have been published for many hydrogen-bonded systems [59, 60] and van der Waals molecules [58]. The presence of these SaS bond CPs creates additional sets of ring and cage points between the MoS2 sheets (Figs. 9.6a and 9.6c). Four distorted trigonal prism cages (green spheres) at f positions, two fourteen-faced cages at a positions (pink spheres), twelve four-membered rings at k and two six-membered ring CPs at d have also been determined. Each cage at f is formed by three curved faces (Fig. 9.6c) defined by two MoaS and two SaS bond paths with a ring CP at the center of each face. The cages located at a positions are defined by fourteen curved faces (Figs. 9.6d and 9.6e): six four-membered faces shared
9.3 An Application to Nanocatalyts 243

244 9 Atoms in Molecules Theory for Exploring the Nature of the Active Sites on Surfaces
with the cages at f (green spheres), two three-membered faces defined by a ring surface bonding three Mo atoms at the top and at the bottom of the cage, and six three-membered faces shared ( just the half of the face) with the cages at b (Fig. 9.6f ).
The entire set of critical points defines specific bonding polyhedra, the packing of which gives rise to the MoS2 bulk structure. The topology of these polyhedra is determined solely by the number of corners, edges, and faces. Convenient notation for these polyhedra [5] is {corner number, edge number, face number}. The network of bond paths (Figs. 9.6a and 9.6d) describing the atomic connectivity shows that the crystal graph of MoS2 results from packing of three types of polyhedron – two {5, 6, 3} such as that shown in Figs. 9.6b and 9.6c and one {12, 18, 8} (Fig. 9.6e), with each face of the distorted trigonal prisms located at f shared with a {12, 18, 8}. The volume spanned by the paths ending at a given nucleus defines the basin of the atom. A 3D view of the IAS and the atom basin are given in Fig. 9.7. There are eleven cage critical points defining an Mo atom and a set of eight cages defines the S atoms. The paths that originate at four cages and terminate at a b CP define each inter-atomic surface. There is a set of six MoaS surfaces bounding the Mo atomic basin and a set of three MoaS and three SaS surfaces bounding the S atoms. Consequently, the Mo and S atoms have D3h and C3v symmetry, respectively. Along the MoaS bond paths, both atoms have curved faces corresponding to MoaS bonds – concave in the basin of the molybdenum and convex in that of the sulfur. This result agrees with a transfer of electronic density from the Mo atom to the sulfur atom [1, 31]. These basins display the full local point-group symmetry at the nuclear sites and fill the space without overlapping each other.
________________________________________________________________________________
H
Fig. 9.6 (a) Ball-and-cylinder model illustrating the bond and cages r(r) critical points of the MoS2 bulk. Large light blue and
yellow balls denote the Mo and S atoms, respectively. Dark gray and red spheres denote the MoaS bond and cage CPs, respectively, inside the sheets. White, gray, and pink spheres denote the SaS bond and cage CPs locate between the sheets. (b) Five nuclei (three Mo and two S), six MoaS bond paths, and three four-membered curved faces define each {5, 6, 3} red cage. (c) Green cages located at f Wycko positions define a layer of {5, 6, 3} polyhedra just below the red cages. (d) Top view (just the 001 Miller plane) of the cell shown in (a) illustrating the space (red triangle with a red sphere at the
center) occupied by the {5, 6, 3} polyhedra defined by the red cages. The empty triangles (without red spheres at the center) are filled for {12, 18, 14} polyhedra defined by the pink cages. (e) Twelve nuclei (six Mo and six S), twelve MoaS and six SaS bond paths, and fourteen faces define each {12, 18, 14} pink cage. (f ) Representation of the threemembered ring surface (white faces) defined by the gradient paths that originate at the ring CPs (dark blue spheres) and end at the Mo nuclei. Three lateral three-membered ring surfaces (gray cylinders) complete the top of the cage. Right: half of the ring surfaces shared with the red cages define these lateral three-membered faces.
9.3 An Application to Nanocatalyts 245
Fig. 9.7 (a) Side and (b) top view of the region of space (the basin) bounded by six concave interatomic surface that defines an Mo atom. Each interatomic surface is defined by the paths that originate at four cages CP (red spheres) and terminate at MoaS bond CPs (gray spheres). (c) Side view of the S
9.3.3
The r(r) Topology of the MoS2 Edges
atom basin. Three convex (at the top) and three planar (at the bottom) interatomic surfaces are defined by the paths that terminate at three MoaS and three SaS bond CPs, respectively. Dark blue spheres denote ring CPs that bound each pair of cage CPs.
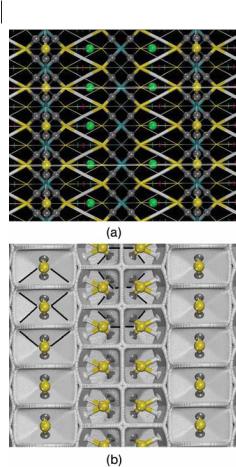
The r(r) topology of the MoS2 edge model (Fig. 9.8) has shown the presence of almost the same type of CP as that of the bulk case – MoaS (gray spheres) and SaS bond critical points (white cylinders), four-membered ring CPs, trigonal prism-like cages (small red spheres), distorted trigonal prism cages (green spheres), and fourteen-faced cages (pink spheres). A new kind of cage (big red spheres) capped by the outermost sulfur atoms on the metal edge (big yellow spheres) is the main di erence from the bulk CPs. These cages are built with four curved faces and describe {6, 8, 4} polyhedra (Fig. 9.8b). Thus, the graph of the exposed structure for the MoS2 surface results from the packing of these {6, 8, 4} and {5, 6, 3} polyhedra similar to the bulk one with a green cage at the
246 9 Atoms in Molecules Theory for Exploring the Nature of the Active Sites on Surfaces
Fig. 9.8 (a) Side view of a ball-and-cylinder model illustrating the bond and cages r(r) critical points of the MoS2 edge. Large light blue and yellow balls denote the Mo and S atoms, respectively. Dark gray spheres and white cylinders denote the MoaS and SaS bond CPs, respectively. Red, green, and pink
spheres denote the cage CPs in the same sense of Fig. 9.6. Big spheres emphasize the outermost cage CPs. (b) {6, 8, 4} polyhedron defined for the outermost S atoms on the metal edge. (c) Most external {5, 6, 3} polyhedra bonded to the exposed Mo atoms of the sulfur edge.
middle (Fig. 9.8c). Each {6, 8, 4} polyhedron is defined by eight MoaS bond paths with an average rb value (Table 9.3) of 0.0926 au, and contains a cage CP with a rc value of 0.0297 au, and the {5, 6, 3} polyhedra are defined by three MoaS bond paths with an average rb value of 0.0916 au and three SaS bond with rb value of 0.0087 au and contain a cage with rc value of 0.0054 au. The former polyhedra whose nuclei are bonded by a much bigger electron density should therefore be more stable than the {5, 6, 3} polyhedra.
The basin for the outermost Mo atoms is bordered by six MoaS inter-atomic surfaces. A set of seven cages (the paths that originate at the cages and terminate at the Mo nuclei outline its associated basin) defines these Mo atoms. In a similar way to the bulk example, the internal IAS are generated by the paths that originate at four cages while the outermost IAS are defined by two cages only and by the paths from the infinite (the open space) and terminate at the bond CPs.
|
|
|
9.3 An Application to Nanocatalyts |
247 |
|
|
|
Table 9.3 |
Topological properties (au) of r(r) at the outermost critical points for MoS2 edges. |
|
|
|
|
|
|
|
|
Edge |
Critical point |
l1 |
l2 |
l3 |
rb |
|
Sulfur |
MoaS b |
0.1011 |
0.0943 |
0.3054 |
0.0916 |
|
Sulfur |
Four-membered |
0.0068 |
0.0216 |
0.0496 |
0.0323 |
|
|
2Mo–2S r |
|
|
|
|
|
|
|
Three-membered r |
|
|
|
|
|
|
Sulfur |
Four-membered |
0.0023 |
0.0072 |
0.0127 |
0.0061 |
|
|
|
1Mo–3S r |
|
|
|
|
|
|
Sulfur |
Red c (Fig. 9.8) |
0.0066 |
0.0122 |
0.0733 |
0.0311 |
|
|
Both |
Green c (Fig. 9.8) |
0.0015 |
0.0051 |
0.0087 |
0.0054 |
|
|
Both |
Pink c (Fig. 9.8) |
0.0012 |
0.0026 |
0.0026 |
0.0029 |
|
Both |
SaS b |
0.0047 |
0.0043 |
0.0307 |
0.0087 |
|
Mo |
MoaS b new |
0.1010 |
0.0962 |
0.3215 |
0.0926 |
|
Mo |
c new (Fig. 9.8) |
0.0050 |
0.0117 |
0.0690 |
0.0297 |
|
|
|
|
|
|
|
|
|
|
The basin for the outermost S atoms on the Mo edge and on the sulfur edge is bordered by two and four MoaS IAS, respectively. Figure 9.9 shows a top view of several of those S basins.
It is apparent the Mo atoms are totally covered by the sulfur atoms, which obstruct access of incoming molecules, for example dibenzothiophene that contains polluting sulfur atoms [47, 50, 52, 54]. This result agrees with the known inactivity of this kind of site, similar the basal plane that only exposes sulfur atoms. We must therefore create vacancies or CUS on this surface by a reduction process to generate available Lewis acidic sites. Usually, H2 reacts with surface sulfur atoms to create a vacancy and produce H2S [50]. The energy to create a sulfur vacancy can therefore be calculated by using the equilibrium: Surface-S þ H2 , Surface- k þ H2S (where ‘k’ denotes a vacancy). Thus the creation energy, CE, of a sulfur vacancy is given by the expression:
CE ¼ EðSurface-@Þ þ EðH2SÞ EðSurface-SÞ EðH2Þ |
ð10Þ |
The energy for each sulfur removal has been reported and the stability of each surface has been deduced using a DFT methodology based in pseudo potentials and plane wave basis sets [51]. The CE and the Lewis acidity strength of sulfur vacancies or coordinative unsaturated sites on the MoS2 edges were recently studied using density-functional theory for periodic systems and an electrostatic potential based method [61]. On the sulfur edge, the gradual removal of the six
248 9 Atoms in Molecules Theory for Exploring the Nature of the Active Sites on Surfaces
Fig. 9.9 (a) Top view of a ball-and-cylinder model illustrating the bond and cages r(r) critical points of the MoS2 edge. (b) Top view of the MoS2 edge surface showing the IAS defining the exposed basin of the outermost S atoms. Black lines emphasize the basin of some Mo atoms, showing that these atoms are encapsulated by the external S atoms.
S atoms of the cell (Fig. 9.4b) was studied and for each case geometrical optimization was conducted for the most stable configuration reported. For the Mo edge, gradual removal of the three S atoms (Fig. 9.4b) ending with complete exposure of the underlying Mo atoms was also studied. The Lewis acidity strength of these specific sites can be explored by use of the electrostatic potential, V(r), which enables us to determine directly where the electron-rich sites in a molecule or crystal are located [61–72].
V(r) at a point r generated by a molecule or crystal is given by:
VðrÞ ¼ VNðrÞ þ VEðrÞ |
ð11Þ |
9.3 An Application to Nanocatalyts 249
where the two terms VN(r) and VE(r) represent the bare nuclear and electronic contributions, respectively, to the total electrostatic potential. The sign of V(r) at a given point indicates either the nuclear (positive) or the electronic (negative) effects are dominant. The electrostatic potential at r generated by the total charge distribution, rtot, of a periodic system is given by:
ð
X
VðrÞ ¼ rtotðr0 RnÞjr r0j 1 dr0 ð12Þ
n
The summation extends to all direct lattice vectors, the prime on the integral sign indicating that an infinitesimal region about r ¼ r0 is excluded from the domain of integration to avoid divergent nuclear self-interaction terms that would otherwise arise in the electrostatic energy per cell. rtot may be decomposed into electronic and nuclear components, as follows:
X
rnuc ðrÞ ¼ qadðra; rÞ ð13Þ
a
where the summation extends to all the reference cell nuclei, with atomic numbers and position vectors denoted qa and ra, respectively.
Xij |
X |
ð14Þ |
relðrÞ ¼ |
PmRinRj wmðr RiÞwn ðr RiÞ |
mn
where P is the density matrix and wmðr RiÞ is the mth reference cell basis function translated by the direct lattice vector Ri. The summations over i and j extend to all direct lattice vectors, while those over m and n include all the basis functions of the reference cell. Substitution of Eq. (13) and Eq. (14) into Eq. (12) gives the nuclear and electronic V(r) contributions.
For the region nearest to the nucleus VN dominates and the topology of V(r) is similar to that of the electron density [73, 74], r(r), i.e. positive maxima at the nuclear site and a positive saddle point between every pair of bonded atoms. The existence of maxima is, nevertheless, ruled out by an established result that, except for the nuclear position, there cannot be any strict local maxima in the V(r) map [65, 66]. For the region where VE dominates, V(r) is negative and the V(r) topography can be more complex. It is, however, well known that lone pairs of electrons and double p bonds (CbC, CbN, etc) are usually characterized as negative minima [64, 66]. In summary, the region nearest the nucleus is always positive whereas the region where the potential is negative contains the minima that characterize the atom lone pairs. The minima of the negative region denote the zones to which an approaching electrophile may be attracted. In contrast, the positive regions do not have maxima that might indicate sites for nucleophilic attack. Politzer and Sjoberg have, nevertheless, shown that by computing V(r) on the
2509 Atoms in Molecules Theory for Exploring the Nature of the Active Sites on Surfaces
Table 9.4 Creation energy, CE (Eq. 10), and maximum positive value of V(r) for the sites studied on the Mo and S edges of molybdenum sulfide [61].
Site |
Edge |
Number of sulfur |
CE |
V(r) maximum |
|
|
atoms removed |
(kJ molC1) |
(kJ molC1) |
|
|
|
|
|
2 |
S |
2 |
34.581 |
15.491 |
3 |
S |
3 |
72.579 |
51.982 |
4 |
S |
4 |
260.579 |
54.085 |
5 |
S |
5 |
515.409 |
131.695 |
6 |
Mo |
1 |
153.345 |
44.371 |
7 |
Mo |
2 |
271.810 |
142.040 |
8 |
Mo |
3 |
458.538 |
142.877 |
|
|
|
|
|

9.3 An Application to Nanocatalyts 251
0.002-electron A˚ 3 contour isosurface [75] of the molecular electronic density r(r), the susceptibility of molecules to nucleophilic attack can be quantified. They demonstrated that the relative magnitudes of the positive electrostatic potential in di erent regions on this surface do reveal the sites most susceptible to nucleophilic attack. This contour isosurface for a group of diatomic molecules and for methane encompasses at least 95% of the electronic charge and yields physically reasonable molecular dimensions [75]. A similar approach, mapping the V(r) values on this isosurface on to colors to identify the host sites in which nucleophiles (most positive zone) and electrophiles (most negative zone) should bind, was used to explore the Lewis acid sites on the MoS2 edges. In addition, to quantify the susceptibility of the active sites, the minimum and maximum V(r) values at the determined host zones were also determined using the Newton– Raphson technique described in Section 9.3. The reported CEs and V(r) maximum values [61] that characterize the Lewis acid strength of the studied sites are listed in Table 9.4. These values suggest that the energetically more favorable sites are located on the sulfur edges; their Lewis acidity strength is, however, much smaller than the site acidity at the molybdenum edges. As a compromise of Lewis acidity strength and energy site 3 with 50% sulfur coverage is suggested as the most hydrodesulfurization-active site. Sites 5, 7, and 8 are very acid sites but at a cost of a huge CE, as is apparent from Table 9.4. These CE results confirm the previously suggested greater stability of the {6, 8, 4} polyhedra on the Mo edges than the {5, 6, 3} polyhedra on the S edges. Because removal of each S atom of the S edge destroys two {5, 6, 3} polyhedra, destruction of six these last polyhedra to create site 3 costs half the energy necessary to destroy just one {6, 8, 4} polyhedron to create site 6 (Table 9.4).
The r(r) topology for site 3 is shown in Fig. 9.10a. This site is obtained by removing three S atoms from the cell, just on the S edge; the remaining three S atoms again occupy bridging positions between the Mo sites. In contrast with the Mo edge, however, the S atoms are tilted to conform as far as possible to the bonding MoaS network present in the solid. The MoaS distances at the S edge vary between 2.29 and 2.32 and are shorter than the MoaS distances (2.40) of the surface without vacancies. The S atoms with the shortest MoaS distances (two by cell) have only one SaS bond (Fig. 9.10a) completing tricoordinated S atoms whereas the other S atom of the cell preserves the two SaS bonds located
________________________________________________________________________________
H
Fig. 9.10 (a) Top view of a ball-and-cylinder model illustrating the bond and cage r(r) critical points of site 3. Large light blue and yellow balls denote the Mo and S atoms, respectively. Dark gray spheres and white cylinders denote the MoaS and SaS bond CPs, respectively. Pink spheres denote cage CPs in the same sense as in Fig. 9.8. Note that holes (emphasized by white rectangle and circles) have appeared in the bond path
network. (b) Top view of site 3 showing the IAS defining the exposed basin of the
outermost S atoms. Holes in the interatomic surfaces (emphasized by white rectangle and black circles) suggest the site where the Mo atoms are most accessible to the incoming molecules. Dotted black lines show the basin of the Mo atoms on the sulfur edges just encapsulated by the external S atoms.