

6 Drag
Methods of Reducing Induced Drag
Induced drag is low at high speeds, but at low speeds it comprises over half the total drag. Induced drag depends on the strength of the trailing vortices, and it has been shown that a high aspect ratio wing reduces the strength of the vortices for a given lift force. However, very high aspect ratios increase the wing root bending moment, reduce the rate of roll and give reduced ground clearance in roll during take-off and landing; therefore, aspect ratio has to be kept within practical limits. The following list itemizes other methods used to minimize induced drag by weakening the wing tip vortices.
6
Drag
•Wing end Plates: A flat plate placed at the wing tip will restrict the tip vortices and have a similar effect to an increased aspect ratio but without the extra bending loads. However, the plate itself will cause parasite drag, and at higher speeds there may be no overall saving in drag.
•Tip tanks: Fuel tanks placed at the wing tips will have a similar beneficial effect to an end plate, will reduce the induced drag and will also reduce the wing root bending moment.
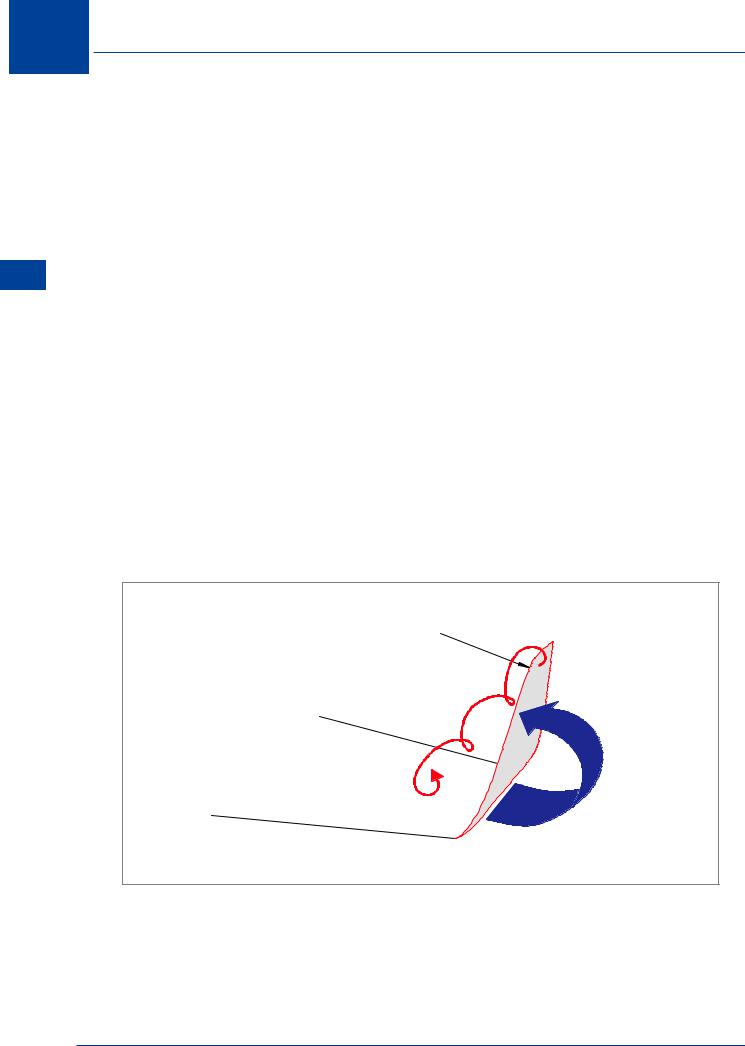
•Winglets: These are small vertical aerofoils which form part of the wing tip (Figure 6.13). Shaped and angled to the induced airflow, they generate a small forward force (i.e. “negative drag”, or thrust). Winglets partly block the air flowing from the bottom to the top surface of the wing, reducing the strength of the tip vortex. In addition, the small vortex generated by the winglet interacts with and further reduces the strength of the main wing tip vortex.
•Wing tip shape: The shape of the wing tip can affect the strength of the tip vortices, and designs such as turned down or turned up wing tips have been used to reduce induced drag.
Winglet
Figure 6.13
122

Drag 6
Effect of Lift on Parasite Drag
The sum of drag due to form, friction and interference is termed “parasite” drag because it is not directly associated with the development of lift. While parasite drag is not directly associated with the production of lift, in reality it does vary with lift. The variation of parasite drag coefficient, CDp , with lift coefficient, CL , is shown for a typical aeroplane in Figure 6.14.
|
1.4 |
|
CDp |
|
|
|
|
CL |
1.2 |
|
|
|
|
|
|
1.0 |
|
|
CD |
|
|
CL2 |
|
|
0.8 |
|
|
i |
= |
||
|
|
|
|
AR |
|||
|
|
|
|
|
|
|
|
|
0.6 |
|
|
|
|
|
|
|
0.4 |
|
|
|
|
|
|
|
0.2 |
|
CDpmin |
|
|
|
|
|
0 |
0 |
0.05 |
0.10 |
|
|
0.15 |
|
|
|
|
|
|
CD |
|
1.4 |
|
|
6 |
CDpmin |
|
|
|
1.2 |
|
Drag |
|
|
|
||
CL 1.0 |
|
|
|
|
|
|
|
0.8 |
|
|
|
0.6 |
|
|
|
0.4 |
CD = CDpmin |
+ CDi |
|
|
|||
0.2 |
|
|
|
0 |
|
|
|
0 |
0.05 |
0.10 |
0.15 |
|
|
CD |
|
Figure 6.14 |
Figure 6.15 |
However, the part of parasite drag above the minimum at zero lift is included with the induced drag coefficient. Figure 6.15.
Effect of Configuration
Parasite drag, Dp , is unaffected by lift, but is variable with dynamic pressure and area. If all other factors are held constant, parasite drag varies significantly with frontal area. As an example, lowering the landing gear and flaps might increase the parasite area by as much as 80%. At any given IAS this aeroplane would experience an 80% increase in parasite drag.
Effect of Altitude
In most phases of flight the aircraft will be flown at a constant IAS, the dynamic pressure and, thus, parasite drag will not vary. The TAS would be higher at altitude to provide the same IAS.
Effect of Speed
The effect of speed alone on parasite drag is the most important. If all other factors are held constant, doubling the speed will give four times the dynamic pressure and, hence, four times the parasite drag, (or one quarter as much parasite drag at half the original speed). This variation of parasite drag with speed points out that parasite drag will be of greatest importance at high IAS and of much lower significance at low dynamic pressures. To illustrate this fact, an aeroplane in flight just above the stall speed could have a parasite drag which is only 25% of the total drag. However, this same aeroplane at maximum level flight speed would have a parasite drag which is very nearly 100% of the total drag. The predominance of parasite drag at high flight speeds emphasizes the necessity for great aerodynamic cleanliness (streamlining) to obtain high speed performance.
123

6 Drag
Aeroplane Total Drag
The total drag of an aeroplane in flight is the sum of induced drag and parasite drag. Figure 6.16 illustrates the variation of total drag with IAS for a given aeroplane in level flight at a particular weight and configuration.
6 |
|
|
|
Drag |
DRAG |
|
TOTAL DRAG |
|
|
|
|
|
|
L DMAX |
|
|
|
|
Parasite Drag |
|
|
|
Induced Drag |
|
|
VMD |
IAS |
|
|
|
Figure 6.16
Figure 6.16 shows the predominance of induced drag at low speed and parasite drag at high speed. Because of the particular manner in which parasite and induced drags vary with speed, the speed at which total drag is a minimum (VMD) occurs when the induced and parasite drags are equal. The speed for minimum drag is an important reference for many items of aeroplane performance. Range, endurance, climb, glide, manoeuvre, landing and take-off performance are all based on some relationship involving the aeroplane total drag curve. Since flying at VMD incurs the least total drag for lift-equal-weight flight, the aeroplane will also be at L/DMAX angle of attack (approximately 4°).
It is important to remember that L/DMAX is obtained at a specific angle of attack and also that the maximum Lift/Drag ratio is a measure of aerodynamic efficiency.
NOTE: If an aircraft is operated at the L/DMAX angle of attack, drag will be a minimum while generating the required lift force. Any angle of attack lower or higher than that for L/DMAX increases the drag for a given lift force; greater drag requires more thrust, which would be inefficient, and expensive. It must also be noted that if IAS is varied, L/D will vary.
124
Drag 6
Figure 5.7 illustrated L/D ratio plotted against angle of attack. An alternative presentation of L/D is a polar diagram in which CL is plotted against CD, as illustrated in Figure 6.17.
CL |
6 |
|
Drag |
|
L D |
|
MAX |
|
CD |
|
Figure 6.17 |
The CL / CD , whole aeroplane polar diagram in Figure 6.17 shows CL increasing initially much more rapidly than CD but that ultimately CD increases more rapidly. The condition for maximum Lift/Drag ratio may be found from the drag polar by drawing the tangent to the curve from the origin.
NOTE: This is a very common method of displaying L/D ratio, so the display in Figure 6.17 should become well known.
125