

- •Textbook Series
- •Contents
- •1 Overview and Definitions
- •Overview
- •General Definitions
- •Glossary
- •List of Symbols
- •Greek Symbols
- •Others
- •Self-assessment Questions
- •Answers
- •2 The Atmosphere
- •Introduction
- •The Physical Properties of Air
- •Static Pressure
- •Temperature
- •Air Density
- •International Standard Atmosphere (ISA)
- •Dynamic Pressure
- •Key Facts
- •Measuring Dynamic Pressure
- •Relationships between Airspeeds
- •Airspeed
- •Errors and Corrections
- •V Speeds
- •Summary
- •Questions
- •Answers
- •3 Basic Aerodynamic Theory
- •The Principle of Continuity
- •Bernoulli’s Theorem
- •Streamlines and the Streamtube
- •Summary
- •Questions
- •Answers
- •4 Subsonic Airflow
- •Aerofoil Terminology
- •Basics about Airflow
- •Two Dimensional Airflow
- •Summary
- •Questions
- •Answers
- •5 Lift
- •Aerodynamic Force Coefficient
- •The Basic Lift Equation
- •Review:
- •The Lift Curve
- •Interpretation of the Lift Curve
- •Density Altitude
- •Aerofoil Section Lift Characteristics
- •Introduction to Drag Characteristics
- •Lift/Drag Ratio
- •Effect of Aircraft Weight on Minimum Flight Speed
- •Condition of the Surface
- •Flight at High Lift Conditions
- •Three Dimensional Airflow
- •Wing Terminology
- •Wing Tip Vortices
- •Wake Turbulence: (Ref: AIC P 072/2010)
- •Ground Effect
- •Conclusion
- •Summary
- •Answers from page 77
- •Answers from page 78
- •Questions
- •Answers
- •6 Drag
- •Introduction
- •Parasite Drag
- •Induced Drag
- •Methods of Reducing Induced Drag
- •Effect of Lift on Parasite Drag
- •Aeroplane Total Drag
- •The Effect of Aircraft Gross Weight on Total Drag
- •The Effect of Altitude on Total Drag
- •The Effect of Configuration on Total Drag
- •Speed Stability
- •Power Required (Introduction)
- •Summary
- •Questions
- •Annex C
- •Answers
- •7 Stalling
- •Introduction
- •Cause of the Stall
- •The Lift Curve
- •Stall Recovery
- •Aircraft Behaviour Close to the Stall
- •Use of Flight Controls Close to the Stall
- •Stall Recognition
- •Stall Speed
- •Stall Warning
- •Artificial Stall Warning Devices
- •Basic Stall Requirements (EASA and FAR)
- •Wing Design Characteristics
- •The Effect of Aerofoil Section
- •The Effect of Wing Planform
- •Key Facts 1
- •Super Stall (Deep Stall)
- •Factors that Affect Stall Speed
- •1g Stall Speed
- •Effect of Weight Change on Stall Speed
- •Composition and Resolution of Forces
- •Using Trigonometry to Resolve Forces
- •Lift Increase in a Level Turn
- •Effect of Load Factor on Stall Speed
- •Effect of High Lift Devices on Stall Speed
- •Effect of CG Position on Stall Speed
- •Effect of Landing Gear on the Stall Speed
- •Effect of Engine Power on Stall Speed
- •Effect of Mach Number (Compressibility) on Stall Speed
- •Effect of Wing Contamination on Stall Speed
- •Warning to the Pilot of Icing-induced Stalls
- •Stabilizer Stall Due to Ice
- •Effect of Heavy Rain on Stall Speed
- •Stall and Recovery Characteristics of Canards
- •Spinning
- •Primary Causes of a Spin
- •Phases of a Spin
- •The Effect of Mass and Balance on Spins
- •Spin Recovery
- •Special Phenomena of Stall
- •High Speed Buffet (Shock Stall)
- •Answers to Questions on Page 173
- •Key Facts 2
- •Questions
- •Key Facts 1 (Completed)
- •Key Facts 2 (Completed)
- •Answers
- •8 High Lift Devices
- •Purpose of High Lift Devices
- •Take-off and Landing Speeds
- •Augmentation
- •Flaps
- •Trailing Edge Flaps
- •Plain Flap
- •Split Flap
- •Slotted and Multiple Slotted Flaps
- •The Fowler Flap
- •Comparison of Trailing Edge Flaps
- •and Stalling Angle
- •Drag
- •Lift / Drag Ratio
- •Pitching Moment
- •Centre of Pressure Movement
- •Change of Downwash
- •Overall Pitch Change
- •Aircraft Attitude with Flaps Lowered
- •Leading Edge High Lift Devices
- •Leading Edge Flaps
- •Effect of Leading Edge Flaps on Lift
- •Leading Edge Slots
- •Leading Edge Slat
- •Automatic Slots
- •Disadvantages of the Slot
- •Drag and Pitching Moment of Leading Edge Devices
- •Trailing Edge Plus Leading Edge Devices
- •Sequence of Operation
- •Asymmetry of High Lift Devices
- •Flap Load Relief System
- •Choice of Flap Setting for Take-off, Climb and Landing
- •Management of High Lift Devices
- •Flap Extension Prior to Landing
- •Questions
- •Annexes
- •Answers
- •9 Airframe Contamination
- •Introduction
- •Types of Contamination
- •Effect of Frost and Ice on the Aircraft
- •Effect on Instruments
- •Effect on Controls
- •Water Contamination
- •Airframe Aging
- •Questions
- •Answers
- •10 Stability and Control
- •Introduction
- •Static Stability
- •Aeroplane Reference Axes
- •Static Longitudinal Stability
- •Neutral Point
- •Static Margin
- •Trim and Controllability
- •Key Facts 1
- •Graphic Presentation of Static Longitudinal Stability
- •Contribution of the Component Surfaces
- •Power-off Stability
- •Effect of CG Position
- •Power Effects
- •High Lift Devices
- •Control Force Stability
- •Manoeuvre Stability
- •Stick Force Per ‘g’
- •Tailoring Control Forces
- •Longitudinal Control
- •Manoeuvring Control Requirement
- •Take-off Control Requirement
- •Landing Control Requirement
- •Dynamic Stability
- •Longitudinal Dynamic Stability
- •Long Period Oscillation (Phugoid)
- •Short Period Oscillation
- •Directional Stability and Control
- •Sideslip Angle
- •Static Directional Stability
- •Contribution of the Aeroplane Components.
- •Lateral Stability and Control
- •Static Lateral Stability
- •Contribution of the Aeroplane Components
- •Lateral Dynamic Effects
- •Spiral Divergence
- •Dutch Roll
- •Pilot Induced Oscillation (PIO)
- •High Mach Numbers
- •Mach Trim
- •Key Facts 2
- •Summary
- •Questions
- •Key Facts 1 (Completed)
- •Key Facts 2 (Completed)
- •Answers
- •11 Controls
- •Introduction
- •Hinge Moments
- •Control Balancing
- •Mass Balance
- •Longitudinal Control
- •Lateral Control
- •Speed Brakes
- •Directional Control
- •Secondary Effects of Controls
- •Trimming
- •Questions
- •Answers
- •12 Flight Mechanics
- •Introduction
- •Straight Horizontal Steady Flight
- •Tailplane and Elevator
- •Balance of Forces
- •Straight Steady Climb
- •Climb Angle
- •Effect of Weight, Altitude and Temperature.
- •Power-on Descent
- •Emergency Descent
- •Glide
- •Rate of Descent in the Glide
- •Turning
- •Flight with Asymmetric Thrust
- •Summary of Minimum Control Speeds
- •Questions
- •Answers
- •13 High Speed Flight
- •Introduction
- •Speed of Sound
- •Mach Number
- •Effect on Mach Number of Climbing at a Constant IAS
- •Variation of TAS with Altitude at a Constant Mach Number
- •Influence of Temperature on Mach Number at a Constant Flight Level and IAS
- •Subdivisions of Aerodynamic Flow
- •Propagation of Pressure Waves
- •Normal Shock Waves
- •Critical Mach Number
- •Pressure Distribution at Transonic Mach Numbers
- •Properties of a Normal Shock Wave
- •Oblique Shock Waves
- •Effects of Shock Wave Formation
- •Buffet
- •Factors Which Affect the Buffet Boundaries
- •The Buffet Margin
- •Use of the Buffet Onset Chart
- •Delaying or Reducing the Effects of Compressibility
- •Aerodynamic Heating
- •Mach Angle
- •Mach Cone
- •Area (Zone) of Influence
- •Bow Wave
- •Expansion Waves
- •Sonic Bang
- •Methods of Improving Control at Transonic Speeds
- •Questions
- •Answers
- •14 Limitations
- •Operating Limit Speeds
- •Loads and Safety Factors
- •Loads on the Structure
- •Load Factor
- •Boundary
- •Design Manoeuvring Speed, V
- •Effect of Altitude on V
- •Effect of Aircraft Weight on V
- •Design Cruising Speed V
- •Design Dive Speed V
- •Negative Load Factors
- •The Negative Stall
- •Manoeuvre Boundaries
- •Operational Speed Limits
- •Gust Loads
- •Effect of a Vertical Gust on the Load Factor
- •Effect of the Gust on Stalling
- •Operational Rough-air Speed (V
- •Landing Gear Speed Limitations
- •Flap Speed Limit
- •Aeroelasticity (Aeroelastic Coupling)
- •Flutter
- •Control Surface Flutter
- •Aileron Reversal
- •Questions
- •Answers
- •15 Windshear
- •Introduction (Ref: AIC 84/2008)
- •Microburst
- •Windshear Encounter during Approach
- •Effects of Windshear
- •“Typical” Recovery from Windshear
- •Windshear Reporting
- •Visual Clues
- •Conclusions
- •Questions
- •Answers
- •16 Propellers
- •Introduction
- •Definitions
- •Aerodynamic Forces on the Propeller
- •Thrust
- •Centrifugal Twisting Moment (CTM)
- •Propeller Efficiency
- •Variable Pitch Propellers
- •Power Absorption
- •Moments and Forces Generated by a Propeller
- •Effect of Atmospheric Conditions
- •Questions
- •Answers
- •17 Revision Questions
- •Questions
- •Answers
- •Explanations to Specimen Questions
- •Specimen Examination Paper
- •Answers to Specimen Exam Paper
- •Explanations to Specimen Exam Paper
- •18 Index

13 High Speed Flight
Properties of a Normal Shock Wave
|
NORMAL |
|
SHOCK WAVE |
SUBSONIC |
SUPERSONIC |
|
SUBSONIC |
Figure 13.9 Normal shock wave formation
Flight Speed High 13
C
STRONG OBLIQUE
SHOCK WAVE
 A
A 
NORMAL SHOCK WAVE  B
B
WEAK OBLIQUE
SHOCK WAVE
MACH LINE 
Figure 13.10 Normal & oblique shock waves
When a shock wave is perpendicular (normal) to the upstream flow, streamlines pass through the shock wave with no change of direction. A supersonic airstream passing through a normal shock wave will also experience the following changes:
•The airstream is slowed to subsonic; the local Mach number behind the wave is approximately equal to the reciprocal of the Mach number ahead of the wave e.g. if the Mach number ahead of the wave is 1.25, the Mach number of the flow behind the wave will be approximately 0.80. (The greater the Mach number above M 1.0 ahead of the wave, the greater the reduction in velocity).
•Static pressure increases.
•Temperature increases.
•Density increases.
•The energy of the airstream [total pressure (dynamic plus static)] is greatly reduced.
Minimum energy loss through a normal shock wave will occur when the Mach number of the airflow in front of the shock wave is small but supersonic.
418

High Speed Flight 13
Oblique Shock Waves
An oblique shock wave is a slightly different type of shock wave.
Referring to Figure 13.10, at ‘A’ the air is travelling at supersonic speed, completely unaware of the approaching object.
The air at ‘B’ has piled up and is subsonic, trying to slip around the front of the object and merge with the airflow.
Through the shock wave supersonic air from ‘A’ slows immediately, increasing in pressure and density as it does so. As previously pointed out, a rise in temperature also occurs. The centre part of the shock wave, lying perpendicular or normal to the direction of the airstream, is the strong normal shock wave.
Notice that ‘above’ and ‘below’ the normal shock wave, the shock wave is no longer perpendicular to the upstream flow, but is at an oblique angle; the airstream strikes the oblique shock wave and is deflected.
Like the normal shock wave, the oblique shock wave in this region is strong. The airflow will be slowed down; the velocity and Mach number of the airflow behind the wave are reduced, but the flow is still supersonic. The primary difference is that the airstream passing though the oblique shock wave changes direction. (The component of airstream velocity normal to the shock wave will always be subsonic downstream, otherwise no shock wave).
The black dashed lines in Figure 13.10 outline the area of subsonic flow created behind the strong shock wave.
Particles passing through the wave at ‘C’ do not slow to subsonic speed. They decrease somewhat in speed and emerge at a slower but still supersonic velocity. At ‘C’ the shock wave is a weak oblique shock wave. Further out from this point the effects of the shock wave decrease until the air is able to pass the object without being affected. Thus the effects of the shock wave disappear, and the line cannot be properly called a shock wave at all; it is called a ‘Mach line’.
ShockWave Summary
•The change from supersonic to subsonic flow is always sudden and accompanied by rapid and large increases in pressure, temperature and density across the shock wave that is formed. A normal shock wave marks the change from supersonic to subsonic flow.
•If the shock wave is oblique, that is, at an angle to the upstream flow, the airflow is deflected as it passes through the shock and may remain supersonic downstream of the shock wave. However, the component of velocity normal to the shock wave will always be subsonic downstream of the shock.
High Speed Flight 13
419

13 High Speed Flight
Effects of Shock Wave Formation
The formation and development of shock waves on the wing have effects on lift, drag, stability and control. Many of these effects are caused by shock induced separation. As the air flows through the shock wave, the sudden rise in pressure causes the boundary layer to thicken and often to separate. This increases the depth of the turbulent wake behind the wing.
Effect of ShockWaves on Lift
At low subsonic speeds the lift coefficient CL is assumed to be constant at a given angle of attack. With increasing Mach number, however, it will vary as shown in Figure 13.11.
|
C L |
M 0 81 |
|
|
|
|
|
|
|
||
|
|
M 0 75 |
|
|
|
|
|
|
M 0 98 |
|
|
13 |
|
|
M 0 89 |
|
|
|
|
|
|
||
High |
0 4 |
MCRIT |
1 2 |
1 4 |
|
Speed |
|||||
|
SHOCK |
MACH NUMBER |
|||
Flight |
|
STALL |
|
|
|
|
|
|
|
||
Figure 13.11 Variation of CL with Mach number at Constant α
At high subsonic speed CL increases. This is the result of the changing pattern of streamlines. At low speeds the streamlines begin to diverge well ahead of the aerofoil, Figure 13.3 and Figure 13.12. At high subsonic speeds they do not begin to deflect until closer to the leading edge, causing greater acceleration and pressure drop around the leading edge. It will be remembered from Chapter 7 that this phenomena causes the stall speed to increase at high altitudes.
420

High Speed Flight 13
HIGH SPEED |
LOW SPEED |
Figure 13.12 Streamlines at low & high subsonic speeds
At speeds above MCRIT a shock wave will have formed on the upper surface. This may cause boundary layer separation aft of the shock wave, causing loss of lift (above M 0.81, as shown
in Figure 13.8 and Figure 13.11).
SHOCK WAVE
SEPARATED AIRFLOW
Figure 13.13 Shock stall
This is known as the shock stall because it results from a separated boundary layer just as the low speed stall does. Shock stall occurs when the lift coefficient, as a function of Mach number, reaches its maximum value (for a given angle of attack). The severity of the loss of lift depends on the shape of the wing sections. Wings not designed for high speeds may have a severe loss of lift at speeds above MCRIT (Figure 13.11), but wings designed specifically for high speed flight, with sweepback, thinner sections and less camber will have much less variation of lift through the transonic region.
Separated airflow caused by a shock stall can cause severe damage to the airframe, particularly the empennage. This will be fully discussed on page 427.
The lower end of the transonic region is where most modern high speed jet transport aircraft operate and a small shock wave will exist on the top surface of the wing in the cruise.
High Speed Flight 13
421

13 High Speed Flight
Effect of ShockWaves on Lift Curve Slope and CLMAX
At a constant angle of attack, the increase of CL as speed increases from about M 0.4 into the low end of the transonic region gives a steeper lift curve slope, i.e. the change of CL per degree angle of attack will increase. However, because of earlier separation resulting from the formation of the shock wave, CLMAX and the stalling angle will be reduced. Figure 13.14 and Figure 13.15 illustrate these changes.
Flight Speed High 13
|
HIGH |
CL |
SUBSONIC SPEEDS |
|
|
|
INCOMPRESSIBLE |
|
FLOW |
ANGLE OF ATTACK
Figure 13.14 Effects of Mach number on lift curve
CLMAX
0 4 |
1 0 |
MFS |
|
Figure 13.15 Effect of Mach number on CLMAX.
422

High Speed Flight
Effect of ShockWaves on Drag
As speed increases above MCRIT shock waves begin to form and drag increases more rapidly than it would have done without the shock waves. The additional drag is called wave drag and is due to energy drag and boundary layer separation.
The Mach number at which the aerodynamic drag begins to increase rapidly is called THE DRAG DIVERGENCE MACH NUMBER. The Drag Divergence Mach Number is usually close to, and always greater than, the Critical Mach Number, as shown in Figure 13.16.
Energy Drag
Energy drag stems from the irreversible nature of the changes which occur as an airflow crosses a shock wave. Energy has to be used to provide the temperature rise across the shock wave and this energy loss is drag on the aircraft. The more oblique the shock waves are, the less energy they absorb, but because they become more extensive laterally and affect more air, the energy drag rises progressively as MFS increases.
Boundary Layer Separation
In certain stages of shock wave movement there is a considerable flow separation, as shown in Figure 13.8 and Figure 13.13. This turbulence represents energy lost to the flow and contributes to the drag. As M FS increases through the transonic range, the shock waves move to the trailing edge and the separation decreases; hence, the drag coefficient decreases.
M 0 98
CD
M 0 89
M 0 75 |
M 0 81 |
|
|
|
|
MCRIT |
|
|
1 2 |
|
|||
DRAGDIVERGENCE |
MACH NUMBER |
||
MACHNUMBER |
|
||
Figure 13.16 Variation of CD with Mach number
The change in drag characteristics is shown by the CD curve for a basic section at a constant angle of attack in Figure 13.16. The ‘hump’ in the curve from M 0.89 to M 1.2 is caused by:
•The drag directly associated with the trailing edge shock waves (energy loss).
•Separation of the boundary layer.
•The formation of the bow shock wave above M 1.0.
13
High Speed Flight 13
423

13 High Speed Flight
Effect of ShockWaves on the CL/ CD Drag Polar Curve
Although the curve of CL / CD is unique at low speeds, at transonic speeds when compressibility becomes significant, the curve will change. Figure 13.16 shows the variation of CL / CD with Mach number. The point at which the tangent from the origin touches the curve corresponds to the maximum CL / CD or maximum L / D. In the transonic region, the L/D ratio is reduced.
Flight Speed High 13
CL |
LOW MACH NUMBERS |
HIGH MACH NUMBERS |
L DMAX |
CD |
Figure 13.17 Effects of Mach number on CL / CD polar
Effect of ShockWaves on the Centre of Pressure
The centre of pressure of an aerofoil is determined by the pressure distribution around it. As the speed increases through the transonic region, the pressure distribution changes and the
centre of pressure will move. It was shown in Figure 13.8 that above MCRIT the upper surface pressure continues to drop on the wing until the shock wave is reached. This means that a
greater proportion of the ‘suction’ pressure will come from the rear of the wing, and the centre of pressure is further aft. The rearward movement of the CP, however, is irregular as the pressure distribution on the lower surface also changes. The shock wave on the lower surface usually forms at a higher free stream Mach number than the upper surface shock, but it reaches the trailing edge first. The overall effect on the CP is shown in Figure 13.18. As the aircraft accelerates to supersonic speed, the overall movement of the CP is aft to the 50% chord position.
424
High Speed Flight 13
1 4 |
|
1 0 |
|
MCRIT |
|
50% |
100% |
PERCENTAGE CHORD
Figure 13.18 CP movement in the transonic region
The wing root usually has a thicker section than the wing tip so will have a lower MCRIT and shock induced separation will occur at the root first. The CP will move towards the tip, and
if the wing is swept, this CP movement will also be rearward. This effect will be discussed in detail later.
High Speed Flight 13
Figure 13.19 Low pressure area in front of shock wave
425
13
Flight Speed High 13
High Speed Flight
Effect of ShockWaves on CP Movement
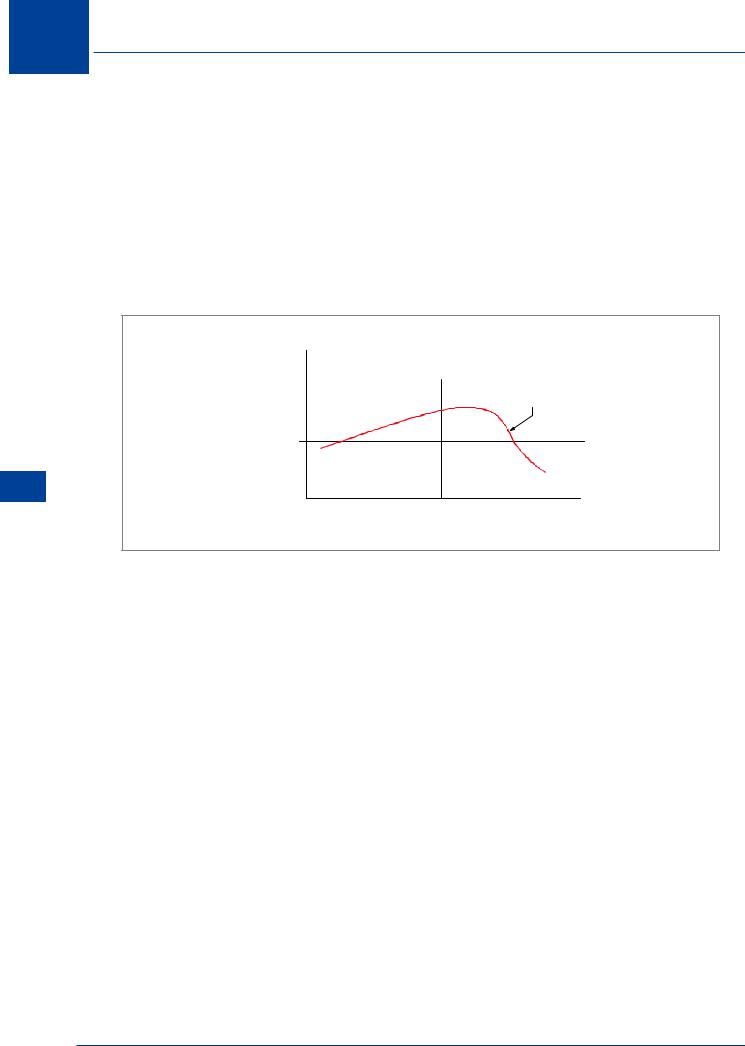
Rearward CP movement with increasing Mach number in the transonic region produces a nosedown pitching moment. This is known as ‘Mach Tuck’, ‘High Speed Tuck’ or ‘Tuck Under’.
A further factor contributing to the nose-down pitching moment is decreased downwash at the tail resulting from reduced lift at the wing root. If the tailplane is situated in the downwash, its effective angle of attack is increased, giving an increase in the nose-down pitching moment.
For a stable aircraft a push force is required on the stick to produce an increase in speed, but as a result of Mach tuck, the push force required may decrease with speed above MCRIT giving an unstable stick force gradient, Figure 13.20.
PUSH |
|
|
UNSTABLE STICK |
STICK |
FORCE GRADIENT |
|
|
FORCE |
|
0 |
|
PULL |
|
MCRIT |
MACH NUMBER |
Figure 13.20 Reduction in stick force with increasing Mach number
The Effect of ShockWaves on Flying Controls
A conventional trailing edge control surface works by changing the camber of the aerofoil to increase or decrease its lift. Deflecting a control surface down will reduce MCRIT. If the control is moved down at high subsonic speed and a shock wave forms on the aerofoil ahead of the control surface, shock induced separation could occur ahead of the control, reducing its effectiveness. At low speed, movement of a control surface modifies the pressure distribution over the whole aerofoil. If there is a shock wave ahead of the control surface, movement of the control cannot affect any part of the aerofoil ahead of the shock wave, and this will also reduce control effectiveness.
Conventional trailing edge control surfaces may suffer from greatly reduced effectiveness in the transonic speed region and may not be adequate to control the changes of moment affecting the aircraft at these speeds. This can be overcome by incorporating some or all of the following into the design: an all moving (slab) tailplane (Figure 11.2), roll control spoilers, making the artificial feel unit in a powered flying control system sensitive to Mach number or by fitting vortex generators.
426