

vk.com/id446425943
INTERNATIONAL ENERGY AGENCY - OIL MARKET REPORT STOCKS
Revisions versus February 2019 Oil Market Report
(million barrels)
|
Americas |
Europe |
Asia Oceania |
OECD |
||||
|
Nov-18 |
Dec-18 |
Nov-18 |
Dec-18 |
Nov-18 |
Dec-18 |
Nov-18 |
Dec-18 |
Crude Oil |
-0.4 |
-2.0 |
-2.2 |
-5.2 |
-0.3 |
2.5 |
-3.0 |
-4.7 |
Gasoline |
0.0 |
2.7 |
0.6 |
1.1 |
0.0 |
0.3 |
0.6 |
4.2 |
Middle Distillates |
0.0 |
11.0 |
-0.6 |
5.4 |
0.0 |
2.7 |
-0.6 |
19.2 |
Residual Fuel Oil |
0.0 |
-0.5 |
-0.8 |
-1.0 |
0.0 |
-0.2 |
-0.8 |
-1.7 |
Other Products |
0.0 |
4.6 |
-0.7 |
-2.4 |
0.0 |
-0.4 |
-0.7 |
1.8 |
Total Products |
0.0 |
17.8 |
-1.4 |
3.2 |
0.0 |
2.4 |
-1.4 |
23.4 |
Other Oils1 |
0.0 |
-3.7 |
0.0 |
0.4 |
0.0 |
-0.3 |
0.0 |
-3.6 |
Total Oil |
-0.4 |
12.2 |
-3.6 |
-1.7 |
-0.3 |
4.6 |
-4.3 |
15.1 |
1 Other oils includes NGLs, feedstocks and other hydrocarbons.
Recent OECD industry stock changes
OECD Americas
Commercial stocks in the OECD Americas climbed 8.3 mb m-o-m in January to 1 552 mb, a 17-month high. This was in line with the five-year average increase for the month but means the region’s stocks were 71.2 mb higher year-on-year. Most of the increase over the last year has occurred in crude (+32.9 mb) and NGLs (+14.4 mb) and can be attributed to higher US LTO and Canadian output. Gasoline (+11.5 mb) and other product inventories (+10.9 mb) also increased as refiners processed increasing volumes of crude. Inventory gains for NGLs and other products, which encompass LPG and naphtha, would have been greater without the large increase in petrochemical production (and thus product demand) seen in the US during 2018.
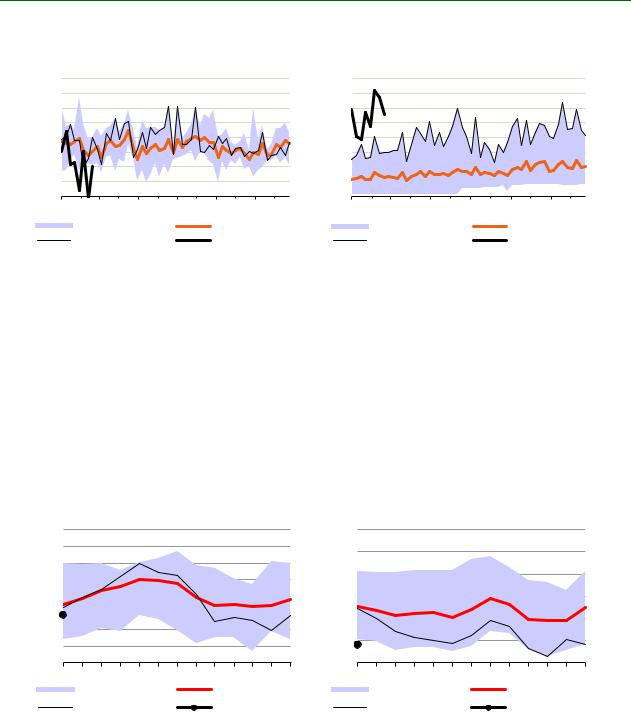
mb |
OECD Americas Crude Oil Industry |
mb |
OECD Americas NGLs & Feedstocks |
||
750 |
|
Stocks |
215 |
Industry Stocks |
|
|
|
205 |
|||
700 |
|
|
|
|
|
|
|
195 |
|
|
|
650 |
|
|
|
|
|
|
|
185 |
|
|
|
|
|
|
|
|
|
600 |
|
|
175 |
|
|
550 |
|
|
165 |
|
|
|
|
155 |
|
|
|
500 |
|
|
|
|
|
|
|
145 |
|
|
|
|
|
|
|
|
|
450 |
|
|
135 |
|
|
Jan |
Mar May |
Jul Sep Nov Jan |
Jan |
Mar May Jul |
Sep Nov Jan |
|
Range 2014-2018 |
Avg 2014-2018 |
|
Range 2014-2018 |
Avg 2014-2018 |
|
2018 |
2019 |
|
2018 |
2019 |
In January, crude stocks increased 7.7 mb m-o-m to 614 mb, their highest since October 2017, as some refineries in the US and Canada entered seasonal maintenance and reduced their crude intake. Crude imports also gained slightly on the month, whereas crude exports fell. Oil product inventories behaved seasonally, falling by 2.7 mb. Gasoline stocks went up 10.9 mb to 289 mb, middle distillates rose 3.7 mb to 221 mb, and fuel oil increased 1.5 mb to 36 mb. Other product stocks (largely US LPG) drew 18.8 mb to 200 mb. This was largely in keeping with the five-year average draw, despite the very cold temperatures recorded in Canada and the US late in the month.
Preliminary February data from the Energy Information Administration show US stocks declining due to further refinery maintenance. Oil product stocks fell by a combined 19.6 mb m-o-m with draws seen in gasoline (-6.5 mb) for the first time in several months as well as diesel (-3 mb) and propane (-6.2 mb). By contrast, crude stocks increased by 4.9 mb. US crude imports fell significantly by around 800 kb/d to 6.7 mb/d, whereas crude exports climbed nearly 600 kb/d to a new all-time record of 3 mb/d. In the week ended 15 February, crude exports peaked at 3.6 mb/d.
15 MARCH 2019 |
31 |
vk.com/id446425943 |
|
|
|
|
|
|
|
|
|
|
|
STOCKS |
|
|
|
|
|
|
INTERNATIONAL ENERGY AGENCY - OIL MARKET REPORT |
||||
mb/d |
US Imports of Crude Oil |
|
mb/d |
US Exports of Crude Oil |
|
||||||
|
|
|
|
|
|
|
|
|
|
||
10.0 |
|
|
|
Source: EIA |
4.0 |
|
|
|
Source: EIA |
||
9.5 |
|
|
|
3.5 |
|
|
|
||||
|
|
|
|
|
|
|
|
|
|
||
9.0 |
|
|
|
|
|
3.0 |
|
|
|
|
|
8.5 |
|
|
|
|
|
2.5 |
|
|
|
|
|
8.0 |
|
|
|
|
|
2.0 |
|
|
|
|
|
7.5 |
|
|
|
|
|
1.5 |
|
|
|
|
|
7.0 |
|
|
|
|
|
1.0 |
|
|
|
|
|
6.5 |
|
|
|
|
|
0.5 |
|
|
|
|
|
6.0 |
|
|
|
|
|
0.0 |
|
|
|
|
|
Jan |
Mar |
May |
Jul |
Sep |
Nov |
Jan |
Mar |
May |
Jul |
Sep |
Nov |
|
Range 2014-2018 |
|
5-yr Average |
|
Range 2014-2018 |
|
Avg 2012-2016 |
||||
|
2018 |
|
|
2019 |
|
|
2018 |
|
|
2019 |
|
OECD Europe
Commercial stocks in OECD Europe increased 10.2 mb m-o-m to 939 mb at the end of January. This was about one third of the average increase for the last five years. On an annual basis, stocks were down 45.3 mb versus January 2018 following the steep draws in oil products recorded during the year on the back of lower refining output.
In January, oil product inventories rose a mere 0.8 mb on the month versus an average of 28 mb and were thus responsible for the lower-than-expected overall build. Clean product imports were their highest in at least 18 months and refinery runs were down only a little on the month, suggesting that higher end-user demand (particularly for diesel and gasoil) helped to deplete stocks. Gasoline stocks increased 3.6 mb m-o-m to 99 mb and middle distillate holdings fell counter-seasonally by 5.1 mb to 257 mb. Meanwhile, crude stocks increased 9 mb to reach 329 mb at the end of the month.
mb |
OECD Europe Crude Oil Industry |
mb |
OECD Europe Middle Distillates |
||
380 |
Stocks |
|
360 |
Industry Stocks |
|
370 |
|
|
|||
|
|
340 |
|
|
|
360 |
|
|
|
|
|
|
|
320 |
|
|
|
350 |
|
|
|
|
|
|
|
|
|
|
|
340 |
|
|
300 |
|
|
330 |
|
|
280 |
|
|
320 |
|
|
|
|
|
|
|
260 |
|
|
|
310 |
|
|
|
|
|
|
|
|
|
|
|
300 |
|
|
240 |
|
|
Jan |
Mar May Jul |
Sep Nov Jan |
Jan |
Mar May Jul |
Sep Nov Jan |
|
Range 2014-2018 |
Avg 2014-2018 |
|
Range 2014-2018 |
Avg 2014-2018 |
|
2018 |
2019 |
|
2018 |
2019 |
Preliminary data for February from Euroilstock showed European oil stocks falling counter-seasonally by 3.9 mb thanks to steep draws in gasoline (-2.7 mb), fuel oil (-1 mb), naphtha (-0.9 mb) and crude (-0.9 mb). Middle distillate (+1.6 mb) was the only category to show an increase.
OECD Asia Oceania
Commercial holdings in Asia Oceania declined sharply in January, by 10 mb m-o-m to 390 mb, their lowest level since September 2018. By far the largest decrease was seen in middle distillates stocks, which declined 8.7 mb to 64 mb owing to decreases in Korea (-5.3 mb) and Japan (-3.4 mb) amid colder temperatures and seasonal gains in kerosene consumption. Lower refinery output in Japan also played a part. Other product inventories (-3.8 mb) and NGL stocks (-1.9 mb) also fell, whereas crude (+3.6 mb), gasoline (+0.4 mb) and fuel oil (+0.5 mb) gained.
32 |
15 MARCH 2019 |