

vk.com/id446425943
DEMAND INTERNATIONAL ENERGY AGENCY - OIL MARKET REPORT
DEMAND
Summary
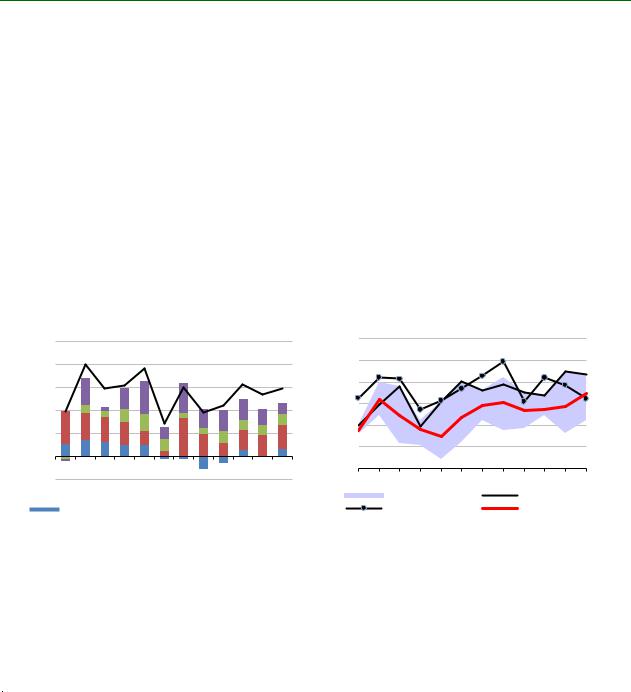
World oil demand growth slowed sharply to 0.95 mb/d in 4Q18 from 1.5 mb/d in 3Q18. Feeble growth in OECD countries was responsible. Total OECD demand declined by 0.3 mb/d year-on-year in 4Q18 with sharp drops seen in Europe and Asia. North America demand rose by only 0.3 mb/d, a big fall from the 0.7 mb/d seen in 3Q18.
Our forecasts for oil demand growth in 2018 and 2019 are nevertheless unchanged, at 1.3 mb/d and 1.4 mb/d, respectively. December data were weaker than expected and November numbers were revised down in the OECD Americas. Demand in the Middle East and parts of Asia, however, was revised slightly upwards. The economic growth assumptions underpinning our forecasts are largely unchanged, although we see further weakness emerging in Europe.
mb/d Global Oil Demand Growth, y-o-y
2.5
2.0
1.5
1.0
0.5
0.0
-0.5
1Q2017 3Q2017 1Q2018 3Q2018 1Q2019 3Q2019
Europe |
|
China |
|
India |
|
US |
|
Total |
|
|
|
|
mb/d OECD: Total Products Demand
50 |
|
|
|
49 |
|
|
|
48 |
|
|
|
47 |
|
|
|
46 |
|
|
|
45 |
|
|
|
44 |
|
|
OCT |
JAN |
APR |
JUL |
|
|
Range 13-17 |
|
2017 |
|
2018 |
|
5-year avg |
For 2018, overall, total OECD demand increased by 310 kb/d and we expect growth to be broadly similar in 2019 at 335 kb/d. Complete data for 2018 show that the US was the largest contributor to growth in 2018. Non-OECD growth accelerated from 1.1 mb/d in 3Q18 to 1.3 mb/d in 4Q18. Within non-OECD, Asia demand increased by 870 kb/d in 2018 and will be slightly lower in 2019 at 830 kb/d. Total non-OECD demand increased by 965 kb/d in 2018, and growth is projected to accelerate to 1.05 mb/d in 2019.
Global Oil Demand (2017-2019)
(million barrels per day)*
|
1Q17 |
2Q17 |
3Q17 |
4Q17 |
2017 |
1Q18 |
2Q18 |
3Q18 |
4Q18 |
2018 |
1Q19 |
2Q19 |
3Q19 |
4Q19 |
2019 |
Africa |
4.4 |
4.3 |
4.2 |
4.3 |
4.3 |
4.3 |
4.3 |
4.2 |
4.4 |
4.3 |
4.5 |
4.4 |
4.3 |
4.4 |
4.4 |
Americas |
30.9 |
31.6 |
31.7 |
31.8 |
31.5 |
31.6 |
31.7 |
32.3 |
32.1 |
31.9 |
32.0 |
32.2 |
32.6 |
32.3 |
32.3 |
Asia/Pacific |
34.2 |
34.1 |
33.5 |
34.7 |
34.1 |
35.1 |
34.7 |
34.3 |
35.2 |
34.8 |
35.7 |
35.3 |
35.0 |
36.1 |
35.5 |
Europe |
14.5 |
15.0 |
15.5 |
15.2 |
15.0 |
14.8 |
15.0 |
15.4 |
14.9 |
15.0 |
14.7 |
15.1 |
15.5 |
15.1 |
15.1 |
FSU |
4.3 |
4.5 |
4.7 |
4.6 |
4.5 |
4.5 |
4.6 |
4.9 |
4.8 |
4.7 |
4.6 |
4.7 |
5.0 |
5.0 |
4.8 |
Middle East |
8.2 |
8.7 |
8.9 |
8.2 |
8.5 |
8.2 |
8.5 |
8.8 |
8.2 |
8.4 |
8.1 |
8.6 |
8.9 |
8.2 |
8.5 |
World |
96.6 |
98.1 |
98.4 |
98.7 |
97.9 |
98.5 |
98.8 |
99.9 |
99.6 |
99.2 |
99.6 |
100.4 |
101.3 |
101.1 |
100.6 |
Annual Chg (%) |
1.0 |
2.1 |
1.5 |
1.6 |
1.6 |
2.0 |
0.7 |
1.5 |
1.0 |
1.3 |
1.1 |
1.6 |
1.3 |
1.5 |
1.4 |
Annual Chg (mb/d) |
1.0 |
2.0 |
1.5 |
1.5 |
1.5 |
1.9 |
0.7 |
1.5 |
0.9 |
1.3 |
1.1 |
1.6 |
1.3 |
1.5 |
1.4 |
Changes from last OMR (mb/d) |
0.0 |
0.0 |
0.0 |
0.0 |
0.0 |
0.1 |
0.1 |
0.1 |
-0.5 |
0.0 |
0.1 |
0.1 |
0.1 |
-0.3 |
0.0 |
* Including biofuels
Growth in the Americas in 2019 will continue to be supported by petrochemical demand in the US and should rise by 0.4 mb/d. Asia Pacific growth will continue at 0.7 mb/d. Middle East oil demand will reverse its 2018 decline and post a modest increase of 0.1 mb/d.
4 |
15 MARCH 2019 |
vk.com/id446425943
INTERNATIONAL ENERGY AGENCY - OIL MARKET REPORT DEMAND
Global Demand by Product
(thousand barrels per day)
|
|
Demand |
|
Annual Chg (kb/d) |
Annual Chg (%) |
||
|
2Q18 |
3Q18 |
4Q18 |
3Q18 |
4Q18 |
3Q18 |
4Q18 |
LPG & Ethane |
11,968 |
12,112 |
12,453 |
762 |
336 |
6.7 |
2.8 |
Naphtha |
6,168 |
6,254 |
6,391 |
-10 |
-200 |
-0.2 |
-3.0 |
Motor Gasoline |
26,186 |
26,637 |
26,333 |
219 |
480 |
0.8 |
1.9 |
Jet Fuel & Kerosene |
7,682 |
8,012 |
7,744 |
362 |
97 |
4.7 |
1.3 |
Gas/Diesel Oil |
28,609 |
28,369 |
28,943 |
170 |
293 |
0.6 |
1.0 |
Residual Fuel Oil |
6,896 |
6,972 |
6,740 |
-14 |
-154 |
-0.2 |
-2.2 |
Other Products |
11,304 |
11,566 |
11,029 |
25 |
98 |
0.2 |
0.9 |
Total Products |
98,814 |
99,923 |
99,633 |
1,513 |
949 |
1.5 |
1.0 |
Fundamentals
Our economic assumptions are based on the January World Economic Outlook Update published by the International Monetary Fund (IMF). The IMF’s projection for 2019 global GDP growth was revised down by 0.2 percentage points to 3.5%. However, for emerging economies – the source of most oil demand growth – there was no change to the outlook.
Projections for Europe were revised down. The IMF reported several concerns: the introduction of revised automobile emissions tests affecting car manufacturers (the automobile industry accounts for 14% of GDP in Europe’s largest economy Germany); concerns about sovereign and financial risks in Italy; and the negative impact of street protests in France. In addition, a “no-deal” Brexit could disrupt European trade. The projected growth for the Euro Area in 2019 was revised down by 0.3 percentage points to 1.6%.
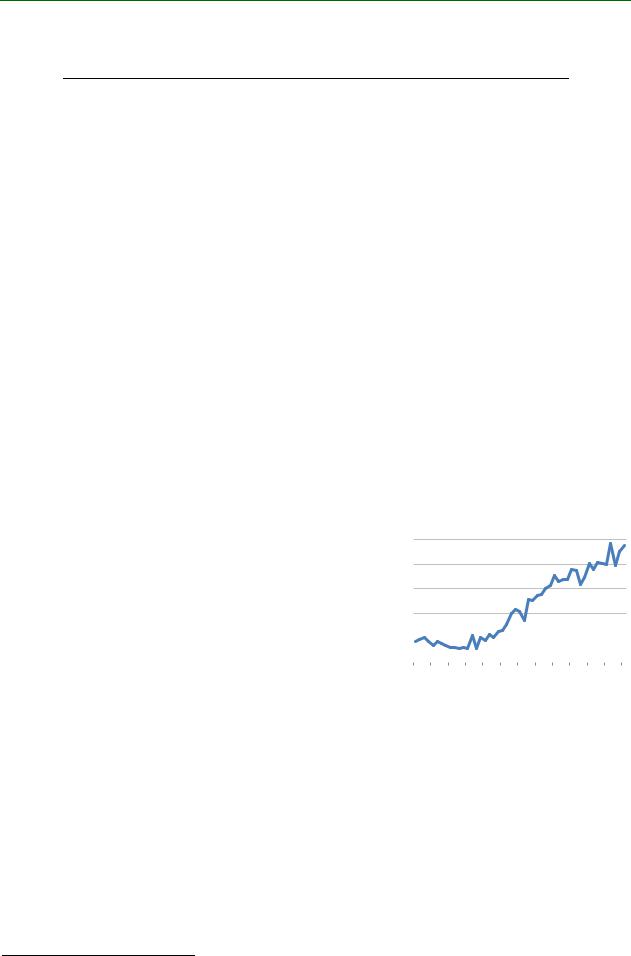
Data from China’s National Bureau of Statistics showed that GDP growth in 2018 was 6.6%, the lowest rate seen in 30 years. The IMF projects an even lower growth rate of 6.2% for both 2019 and 2020. A Chinese slowdown affects growth and trade prospects around the world, even if this is not yet visible in all economic indicators. While Chinese and German exports slowed sharply at the start of this year, the RWI/ISL1 Container Throughput Index continues to show strong growth in trade. Current trade tensions could also start to impact container trade in the next few months, however.
RWI/ISL-Container Index
140
135
130
125
120 |
|
|
|
|
|
Source: ISL |
|||
115 |
|
|||
|
|
|
||
Jan-15 May-15 Sep-15 Jan-16 May-16 Sep-16 Jan-17 May-17 Sep-17 Jan-18 May-18 Sep-18 Jan-19 |
||||
|
||||
Not all recent economic news is negative, as there have been some upwards revisions to data in some economies. Brazil’s growth estimate for 2019 was raised to 2.5%. India also saw a modest upgrade with growth in 2018 now thought to have been slightly stronger at 7.3% and with a revised outlook for 2019 of 7.5%.
Our oil price assumption, based on the Brent forward curve, is up to $65/bbl compared with the $62/bbl used in the previous Report. However, annual Brent prices still show a decline of around 9% from 2018 levels, which should be supportive overall for oil consumers.
Temperatures in the northern hemisphere during winter tend to have a strong impact on heating oil demand. In January, temperatures were slightly higher than normal in the US with heating degree-days (HDDs) 0.7% below the 10-year average. In Europe, they were mixed: 3% more HDDs in France and 6%
1 The RWI – Leibniz Institute for Economic Research and the ISL - Institute of Shipping Economics and Logistics
15 MARCH 2019 |
5 |