

vk.com/id446425943
INTERNATIONAL ENERGY AGENCY - OIL MARKET REPORT REFINING
implementation of the new IMO rules. In this regard, supply adjustments, both voluntary and accidental, have come ahead of demand changes. By voluntary adjustments, we mean upgrading units, such as cokers, vacuum distillation units, and solvent de-asphalting that have come online in recent months and reduced fuel oil yields. Accidental fuel oil supply decreases relate to the cuts in production of global medium-heavy crude grades (see Supply). The estimated 1.4 mb/d reduction in the output of these grades since November could have led to almost 500 kb/d less primary distillation output of fuel oil.
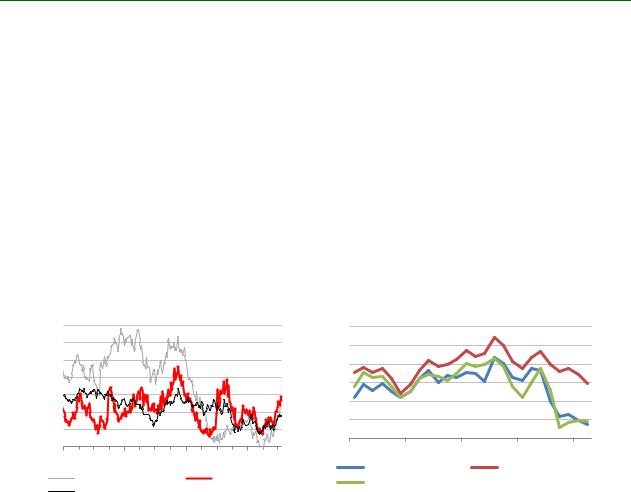
Most straight-run residual oil is used as feedstock for secondary units to produce lighter products. Typically, less than a quarter of fuel oil ends up in final product markets. Still, the volume loss is large enough to make a difference in fuel oil cracks, which have gained strength in the last five months. This has had an interesting effect on refining margins, by shrinking the upgrading differential. The difference between simple and complex margins for the same crude type narrowed sharply last November and has not recovered since.
$/bbl |
Regional Refining Margins |
$/bbl |
Upgrading Differential |
|
|||||
14 |
|
|
|
7 |
|
|
|
|
|
12 |
|
|
|
6 |
|
|
|
|
|
10 |
|
|
|
5 |
|
|
|
|
|
8 |
|
|
|
|
|
|
|
||
|
|
|
4 |
|
|
|
|
||
6 |
|
|
|
|
|
|
|
||
|
|
|
3 |
|
|
|
|
||
4 |
|
|
|
|
|
|
|
||
|
|
|
2 |
|
|
|
|
||
2 |
|
|
|
|
|
|
|
||
|
|
|
1 |
|
|
|
|
||
0 |
|
|
|
|
|
|
|
||
|
|
|
Jan-17 |
Jul-17 |
Jan-18 |
Jul-18 |
Jan-19 |
||
Jan 18 |
May 18 |
Sep 18 |
Jan 19 |
||||||
NWE Brent |
|
Med Urals |
|
||||||
USGC coking |
|
Brent Cracking |
|
|
|||||
|
Singapore Dubai |
|
|
||||||
Dubai Cracking |
|
|
|
|
|||||
|
|
|
|
|
|
|
|||
When taking into account expected developments in crude oil markets and refining this year it is difficult to envisage a reversal of the situation. Supply of medium-heavy grades will likely remain constrained due to a combination of geopolitical and operational factors (Venezuela, OPEC+ agreement, Iran, etc). Refining capacity coming online this year is complex, with some sites boasting zero yields of marketable fuel oil. In this context, the recent announcement by Rosneft of a delay in commissioning its fleet of hydrocrackers and cokers from 2019 to late 2020-early 2021 may make commercial sense. On the other hand, the company is a traditional laggard in Russia’s long-running refinery modernisation programme, having mostly focused on upstream projects.
The margin premium that complex refineries have enjoyed for many years is slowly disappearing as increasing complexity is confronted by a lightening of the global average crude barrel. As we noted in Oil 2019, we might be seeing the beginning of the reversal of the historical trend, with the emphasis moving from more complex to simpler refining operations.
OECD refinery throughput
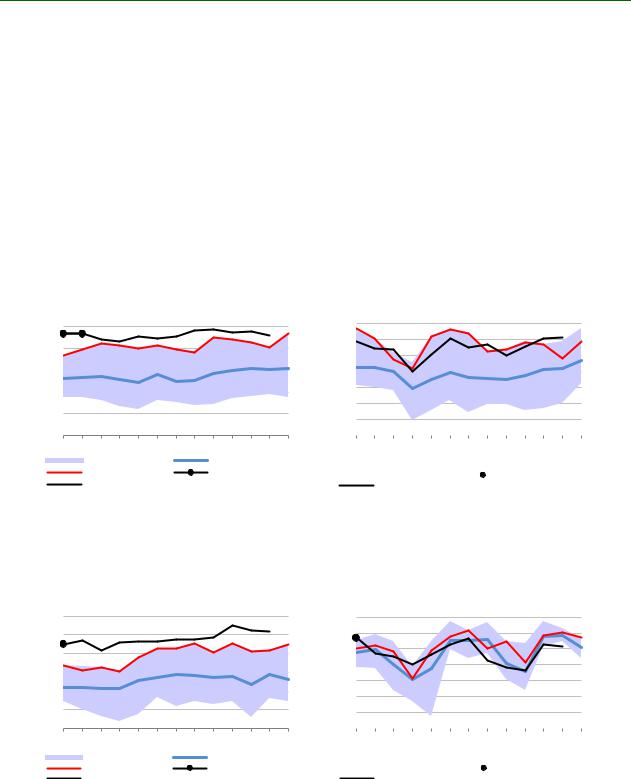
OECD refining throughput in January fell 0.9 mb/d m-o-m, 0.5 mb/d down y-o-y. The monthly change was mostly due to a seasonal slowdown in the US in January, but the annual decrease came from the two large refining centres of OECD Asia: Japan and Korea. After a 250 kb/d y-o-y decline in 2018, 2019 throughput is expected to increase by 430 kb/d, mostly thanks to US and European growth.
US February throughput was much more subdued than expected, some 330 kb/d lower than our forecast. Runs declined by 1.1 mb/d m-o-m to 15.9 mb/d and were 70 kb/d below a year earlier, the first annual decline since May 2018. Since December 2018, US runs have fallen by 1.5 mb/d, but they are expected to recover from March towards the summer peak in July-August, adding 1.7 mb/d.
|
|
|
15 MARCH 2019 |
25 |
|

vk.com/id446425943
REFINING INTERNATIONAL ENERGY AGENCY - OIL MARKET REPORT
PADD 2 (US Midwest) and PADD 3 (Gulf Coast) accounted for most of the monthly decline in February. Nevertheless, PADD 3 throughput remained robust, up 200 kb/d y-o-y and at a new seasonal record at 8.5 mb/d. The underperformance was mostly due to PADD 1 (down 170 kb/d) and PADD 2 (down by 120 kb/d).
mb/d |
US |
mb/d |
|
Weekly Crude Throughput |
||||||||||||||||||||||||||||||||||||||||||||
|
|
|
|
Crude Throughput |
|
|||||||||||||||||||||||||||||||||||||||||||
18 |
|
|
|
|
|
|
|
|
|
|
|
|
|
|
(y-o-y change) |
|
|
|
|
|
|
|
|
|
|
|
||||||||||||||||||||||
|
|
|
|
|
|
|
0.7 |
|
|
|
|
|
|
|
|
|
|
|
|
|
|
|
|
|
|
|
|
|
|
|||||||||||||||||||
|
|
|
|
|
|
|
|
|
|
|
|
|
|
|
|
|
|
|
|
|
|
|
|
|
|
|
|
|
|
|
|
|
|
|
|
|
|
|
|
|
|
|
|
|
|
|||
|
|
|
|
|
|
|
|
|
|
|
|
|
|
|
|
|
|
|
|
|
|
|
|
|
|
|
|
|
|
|
|
|
|
|
|
|
|
|
|
|
|
|||||||
17 |
|
|
|
|
|
|
|
0.5 |
|
|
|
|
|
|
|
|
|
|
|
|
|
|
|
|
|
|
|
|
|
|
|
|
|
|
|
|
|
|
|
|
|
|
|
|
|
|
|
|
|
|
|
|
|
|
|
|
|
|
|
|
|
|
|
|
|
|
|
|
|
|
|
|
|
|
|
|
|
|
|
|
|
|
|
|
|
|
|
|
|
|
|
|
|
||||
16 |
|
|
|
|
|
|
|
0.3 |
|
|
|
|
|
|
|
|
|
|
|
|
|
|
|
|
|
|
|
|
|
|
|
|
|
|
|
|
|
|
|
|
|
|
|
|
|
|
|
|
|
|
|
|
|
|
|
|
|
|
|
|
|
|
|
|
|
|
|
|
|
|
|
|
|
|
|
|
|
|
|
|
|
|
|
|
|
|
|
|
|
|
|
|
|
||||
|
|
|
|
|
|
|
0.1 |
|
|
|
|
|
|
|
|
|
|
|
|
|
|
|
|
|
|
|
|
|
|
|
|
|
|
|
|
|
|
|
|
|
|
|
|
|
|
|
||
15 |
|
|
|
|
|
|
|
|
|
|
|
|
|
|
|
|
|
|
|
|
|
|
|
|
|
|
|
|
|
|
|
|
|
|
|
|
|
|
|
|
|
|
|
|
|
|
||
|
|
|
|
|
|
|
|
|
|
|
|
|
|
|
|
|
|
|
|
|
|
|
|
|
|
|
|
|
|
|
|
|
|
|
|
|
|
|
|
|
|
|
|
|
||||
|
|
|
|
|
|
|
-0.1 |
|
|
|
|
|
|
|
|
|
|
|
|
|
|
|
|
|
|
|
|
|
|
|
|
|
|
|
|
|
|
|
|
|
|
|
|
|
|
|
||
14 |
|
|
|
|
|
|
|
|
|
|
|
|
|
|
|
|
|
|
|
|
|
|
|
|
|
|
|
|
|
|
|
|
|
|
|
|
|
|
|
|
|
|
|
|
|
|
||
|
|
|
|
|
|
|
|
|
|
|
|
|
|
|
|
|
|
|
|
|
|
|
|
|
|
|
|
|
|
|
|
|
|
|
|
|
|
|
|
|
|
|
|
|
||||
|
|
|
|
|
|
|
-0.3 |
|
|
|
|
|
|
|
|
|
|
|
|
|
|
|
|
|
|
|
|
|
|
|
|
|
|
|
|
|
|
|
|
|
|
|
|
|
|
|
||
|
|
|
|
|
|
|
|
|
|
|
|
|
|
|
|
|
|
|
|
|
|
|
|
|
|
|
|
|
|
|
|
|
|
|
|
|
|
|
|
|
|
|
|
|
||||
13 |
|
|
|
|
|
|
|
|
|
|
|
|
|
|
|
|
|
|
|
|
|
|
|
|
|
|
|
|
|
|
|
|
|
|
|
|
|
|
|
|
|
|
|
|
|
|
||
|
|
|
|
|
|
|
-0.5 |
|
|
|
|
|
|
|
|
|
|
|
|
|
|
|
|
|
|
|
|
|
|
|
|
|
|
|
|
|
|
|
|
|
|
|
|
|
|
|
||
|
|
|
Jul Sep Nov Jan |
|
|
|
|
|
|
|
|
|
|
|
|
|
|
|
|
|
|
|
|
|
|
|
|
|
|
|
|
|
|
|
|
|
|
|
|
|
|
|
||||||
|
|
|
|
|
|
|
|
|
|
|
|
|
|
|
|
|
|
|
|
|
|
|
|
|
|
|
|
|
|
|
|
|
|
|
|
|
|
|||||||||||
|
Jan Mar May |
Nov-18 |
|
|
|
Dec-18 |
|
|
|
|
Jan-19 |
|
|
|
Feb-19 |
|||||||||||||||||||||||||||||||||
|
|
|
|
Range 13-18 |
|
|
Average 13-18 |
|
|
|
|
PADD 1 |
|
PADD 2 |
|
|
|
PADD 3 |
||||||||||||||||||||||||||||||
|
|
|
|
|
|
|
|
|
|
|
|
|
|
|||||||||||||||||||||||||||||||||||
|
|
2018 |
|
|
2019 |
|
|
|
|
|
PADD 4 |
|
PADD 5 |
|
|
|
|
|
|
|
|
|
|
|
||||||||||||||||||||||||
|
|
|
|
|
|
|
|
|
|
|
|
|
|
|
|
|
|
|
||||||||||||||||||||||||||||||
|
|
|
|
2019 forecast |
|
|
|
|
|
|
|
|
|
|
|
|
|
|
|
|
|
|
|
|
||||||||||||||||||||||||
|
|
|
|
|
|
|
|
|
|
|
|
|
|
|
|
|
|
|
|
|||||||||||||||||||||||||||||
|
|
|
|
|
|
|
|
|
|
|
|
|
|
|
|
|
|
|
|
|||||||||||||||||||||||||||||
Canadian throughput in January was at the lowest seasonal level in our monthly records. This follows a generally lacklustre 2018 when runs were down 110 kb/d y-o-y. The largest declines were due to extensive refinery maintenance in the Eastern Canada/Quebec and Western Canada regions. We expect a recovery this year, with runs up 110 kb/d y-o-y.
mb/d |
Canada |
mb/d |
Mexico |
2.0 |
Crude Throughput |
1.4 |
Crude Throughput |
|
|
||
1.8 |
|
1.2 |
|
1.6 |
|
1.0 |
|
1.4 |
|
0.8 |
|
1.2 |
|
0.6 |
|
1.0 |
|
0.4 |
|
Jan Mar May Jul |
Sep Nov Jan |
|
Jan Mar May Jul |
Sep Nov Jan |
||||||||
|
|
Range 13-18 |
|
|
Average 13-18 |
|
|
|
Range 13-18 |
|
|
Average 13-18 |
|
2018 |
|
|
2019 |
|
|
2018 |
|
|
2019 |
||
|
|
|
|
|
|
|||||||
|
|
2019 forecast |
|
|
|
|
|
2019 forecast |
|
|
||
Mexican throughput in January also failed to recover, and, at 485 kb/d was only slightly higher than the lowest monthly number in our records. We have revised down our 2019 forecast by 100 kb/d to just 560 kb/d.
mb/d |
North West Europe |
mb/d |
Mediterranean Europe |
||
9.0 |
Crude Throughput |
4.2 |
Crude Throughput |
||
|
|
|
|
||
8.5 |
|
|
4.0 |
|
|
|
|
3.8 |
|
|
|
8.0 |
|
|
|
|
|
|
|
3.6 |
|
|
|
7.5 |
|
|
3.4 |
|
|
7.0 |
|
|
3.2 |
|
|
|
|
3.0 |
|
|
|
|
|
|
|
|
|
6.5 |
|
|
2.8 |
|
|
Jan |
Mar May Jul |
Sep Nov Jan |
Jan |
Mar May Jul |
Sep Nov Jan |
|
Range 13-18 |
Average 13-18 |
|
Range 13-18 |
Average 13-18 |
|
2018 |
2019 |
|
2018 |
2019 |
|
2019 forecast |
|
|
2019 forecast |
|
26 |
15 MARCH 2019 |

vk.com/id446425943
INTERNATIONAL ENERGY AGENCY - OIL MARKET REPORT REFINING
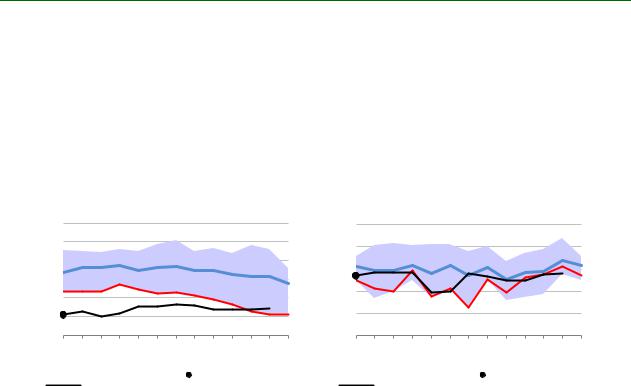
OECD Europe’s December throughput was finalised 50 kb/d higher and preliminary data for January came in 70 kb/d below our expectations. The maintenance season started in February and is expected to peak in May. Overall, regional refinery intake in 2018 was down 260 kb/d y-o-y, and is expected to recover partially, by 195 kb/d, in 2019. The growth will come mostly from the Mediterranean region as a new refinery in Turkey reaches full operating rates this year. Shell has reportedly reached a deal with HES tank terminal firm to partially restart the Wilhelmshaven refinery in Germany, previously operated by ConocoPhilips. One of the vacuum distillation units could be run on heavy sweet crude feedstock to produce marine bunker material to meet the new IMO 2020 specifications.
Refinery Crude Throughput and Utilisation in OECD Countries
(million barrels per day)
|
|
|
|
|
|
|
Change from |
Utilisation rate1 |
||
|
Aug 18 |
Sep 18 |
Oct 18 |
Nov 18 |
Dec 18 |
Jan 19 |
Dec 18 |
Jan 18 |
Jan 19 |
Jan 18 |
US2 |
17.61 |
16.99 |
16.41 |
17.15 |
17.41 |
16.91 |
-0.50 |
0.31 |
89% |
88% |
Canada |
1.78 |
1.76 |
1.64 |
1.70 |
1.73 |
1.66 |
-0.07 |
-0.09 |
83% |
87% |
Chile |
0.19 |
0.19 |
0.19 |
0.19 |
0.20 |
0.19 |
-0.01 |
0.00 |
84% |
86% |
Mexico |
0.68 |
0.61 |
0.48 |
0.51 |
0.50 |
0.49 |
-0.01 |
-0.11 |
29% |
36% |
OECD Americas3 |
20.27 |
19.54 |
18.72 |
19.55 |
19.83 |
19.25 |
-0.58 |
0.11 |
84% |
84% |
France |
1.22 |
1.24 |
1.22 |
1.09 |
1.13 |
1.16 |
0.03 |
-0.01 |
93% |
94% |
Germany |
1.89 |
1.56 |
1.53 |
1.69 |
1.75 |
1.79 |
0.04 |
-0.16 |
88% |
96% |
Italy |
1.44 |
1.35 |
1.29 |
1.38 |
1.38 |
1.28 |
-0.10 |
-0.08 |
74% |
79% |
Netherlands |
1.13 |
1.00 |
0.98 |
1.02 |
1.17 |
1.15 |
-0.03 |
-0.04 |
89% |
92% |
Spain |
1.47 |
1.38 |
1.42 |
1.38 |
1.35 |
1.39 |
0.04 |
-0.03 |
98% |
100% |
United Kingdom |
1.17 |
1.16 |
1.15 |
1.11 |
1.15 |
1.13 |
-0.02 |
0.08 |
90% |
83% |
Other OECD Europe |
4.60 |
4.42 |
4.10 |
4.16 |
4.43 |
4.34 |
-0.09 |
0.03 |
93% |
97% |
OECD Europe |
12.91 |
12.09 |
11.68 |
11.82 |
12.36 |
12.23 |
-0.13 |
-0.22 |
90% |
93% |
Japan |
3.22 |
3.05 |
2.60 |
3.18 |
3.21 |
3.10 |
-0.11 |
-0.19 |
87% |
93% |
South Korea |
2.97 |
2.98 |
3.12 |
3.08 |
3.05 |
3.04 |
-0.01 |
-0.21 |
91% |
100% |
Other Asia Oceania |
0.87 |
0.93 |
0.91 |
0.91 |
0.91 |
0.82 |
-0.10 |
-0.04 |
94% |
98% |
OECD Asia Oceania |
7.05 |
6.96 |
6.62 |
7.17 |
7.17 |
6.95 |
-0.22 |
-0.44 |
90% |
96% |
OECD Total |
40.23 |
38.60 |
37.02 |
38.54 |
39.36 |
38.44 |
-0.93 |
-0.55 |
87% |
89% |
1Expressed as a percentage, based on crude throughput and current operable refining capacity
2US50
3OECD Americas includes Chile and OECD Asia Oceania includes Israel. OECD Europe includes Slovenia and Estonia, though neither country has a refinery
OECD Asia January throughput plunged 440 kb/d y-o-y, some 470 kb/d below our expectations, driven by counter seasonal slowdowns in Japan and Korea. This was an extension of the equally poor December performance. In Korea, where crude imports also registered declines in December and January, a partial displacement of crude feedstocks by cheaper naphtha for the mixed-feed crackers could explain the lower crude runs. For Japan, the issues are structural based on declining domestic demand, and less involvement in export markets.
mb/d |
OECD Asia Oceania |
|
8.0 |
Crude Throughput |
|
|
|
|
7.5 |
|
|
7.0 |
|
|
6.5 |
|
|
6.0 |
|
|
5.5 |
|
|
Jan |
Mar May Jul |
Sep Nov Jan |
|
Range 13-18 |
Average 13-18 |
|
2018 |
2019 |
|
2019 forecast |
|
|
|
|
15 MARCH 2019 |
27 |
|
vk.com/id446425943
REFINING INTERNATIONAL ENERGY AGENCY - OIL MARKET REPORT
Non-OECD refinery throughput
December data updates for non-OECD countries resulted in an 85 kb/d downward revision of our throughput numbers. Runs were down 355 kb/d y-o-y, as declines in Latin America were only partially offset by growth elsewhere. Changes to Thailand’s historical statistics resulted in a downward revision to our 2017 throughput estimate (-11 kb/d) and upward revision to our 2018 number (+35 kb/d). Annual growth for non-OECD countries is expected to moderate from 870 kb/d last year to 700 kb/d in 2019.
China’s National Bureau of Statistics reported cumulative data for January-February due to the Lunar New Year holiday break. Average throughput jumped 0.6 mb/d from December to 12.6 mb/d, up 0.9 mb/d y-o-y. This was 0.3 mb/d higher than our forecast. These record run rates came as a surprise as traditionally there is a slowdown around the holiday. Nevertheless, the major maintenance programme announced for spring will cause a slowdown from the heady January-February numbers.
mb/d |
China |
Crude Throughput |
|
13 |
|
12 |
|
11 |
|
10 |
|
9 |
|
8 |
|
Jan Mar May |
Jul Sep Nov Jan |
Range 13-18 |
Average 13-18 |
2018 |
2019 |
2019 forecast
mb/d
5.4
5.2 
5.0
4.8
4.6
4.4
4.2
4.0 |
|
|
|
|
|
|
|
||
|
|
|
|
|
|
|
|||
|
|
Jan Mar May Jul |
Sep Nov Jan |
||||||
|
|
|
|
|
Range 13-18 |
|
|
Average 13-18 |
|
|
|
2018 |
|
|
2019 |
|
|||
|
|
|
|
||||||
|
|
|
|
|
2019 forecast |
|
|
|
|
Indian runs climbed 215 kb/d m-o-m in January but remained 160 kb/d down y-o-y. Our forecast for 2019 is largely unchanged. Elsewhere in Asia, the growth comes from Malaysia, Vietnam and Brunei, which are either commissioning or ramping up new units.
mb/d |
Middle East |
|
9.0 |
Crude Throughput |
|
|
|
|
8.5 |
|
|
8.0 |
|
|
7.5 |
|
|
7.0 |
|
|
6.5 |
|
|
6.0 |
|
|
Jan |
Mar May Jul |
Sep Nov Jan |
|
Range 13-18 |
Average 13-18 |
|
2018 |
2019 |
|
2019 forecast |
|
mb/d
7.4
7.2
7.0
6.8
6.6
6.4
6.2
6.0 |
|
|
|
|
|
|
|
||
|
|
|
|
|
|
|
|||
|
|
Jan Mar May Jul |
Sep Nov Jan |
||||||
|
|
|
|
|
Range 13-18 |
|
|
Average 13-18 |
|
|
|
2018 |
|
|
2019 |
|
|||
|
|
|
|
||||||
|
|
|
|
|
2019 forecast |
|
|
|
|
Official December statistics for Saudi Arabian throughput came in 140 kb/d below our expectations at 2.7 mb/d and were 140 kb/d down y-o-y. Overall Middle East throughput growth in 2019 is revised up by 95 kb/d to 450 kb/d.
Updates for Russia and other FSU countries did not change the picture much. After growth of 160 kb/d in 2018 for the region as a whole, throughput is expected to decline by 80 kb/d in 2019, on lower Russian intake.
28 |
15 MARCH 2019 |
vk.com/id446425943
INTERNATIONAL ENERGY AGENCY - OIL MARKET REPORT REFINING
Brazil and Argentina reported lower than expected runs in January, by 120 and 30 kb/d, respectively. In the case of Brazil, they are expected to have recovered in February as the country’s largest refinery, Replan, returned to full operations following several months of reduced rates due to a fire. We have also pushed back the closure of Jamaica’s sole refinery to end-2019. The government announced that they will buy back Petroleos de Venezuela S.A’s share in Petrojam, the refinery’s owner, and seek an international partner to invest into a vacuum distillation unit. Without this necessary upgrade, the refinery is unlikely to survive after the IMO 2020 bunker specification change.
mb/d |
Latin America |
mb/d |
Africa |
5.5 |
Crude Throughput |
2.6 |
Crude Throughput |
|
|
||
5.0 |
|
2.4 |
|
4.5 |
|
|
|
|
2.2 |
|
|
4.0 |
|
|
|
|
2.0 |
|
|
3.5 |
|
|
|
|
|
|
|
3.0 |
|
1.8 |
|
2.5 |
|
1.6 |
|
Jan Mar May Jul |
Sep Nov Jan |
|
Jan Mar May Jul |
Sep Nov Jan |
||||||||
|
|
Range 13-18 |
|
|
Average 13-18 |
|
|
|
Range 13-18 |
|
|
Average 13-18 |
|
2018 |
|
|
2019 |
|
|
2018 |
|
|
2019 |
||
|
|
|
|
|
|
|||||||
|
|
2019 forecast |
|
|
|
|
|
2019 forecast |
|
|
||
Only two countries in Africa reported December runs. Algerian runs were up 33 kb/d y-o-y to 700 kb/d, while Angola’s only operating refinery near Luanda showed signs of a comeback from maintenance that lasted for three months. Runs were up 10 kb/d m-o-m to 13 kb/d in December. The continent’s throughput is expected to be 2.1 mb/d in 2019, up by 60 kb/d y-o-y.
|
|
|
15 MARCH 2019 |
29 |
|