


vk.com/id446425943
DEMAND INTERNATIONAL ENERGY AGENCY - OIL MARKET REPORT
mb/d |
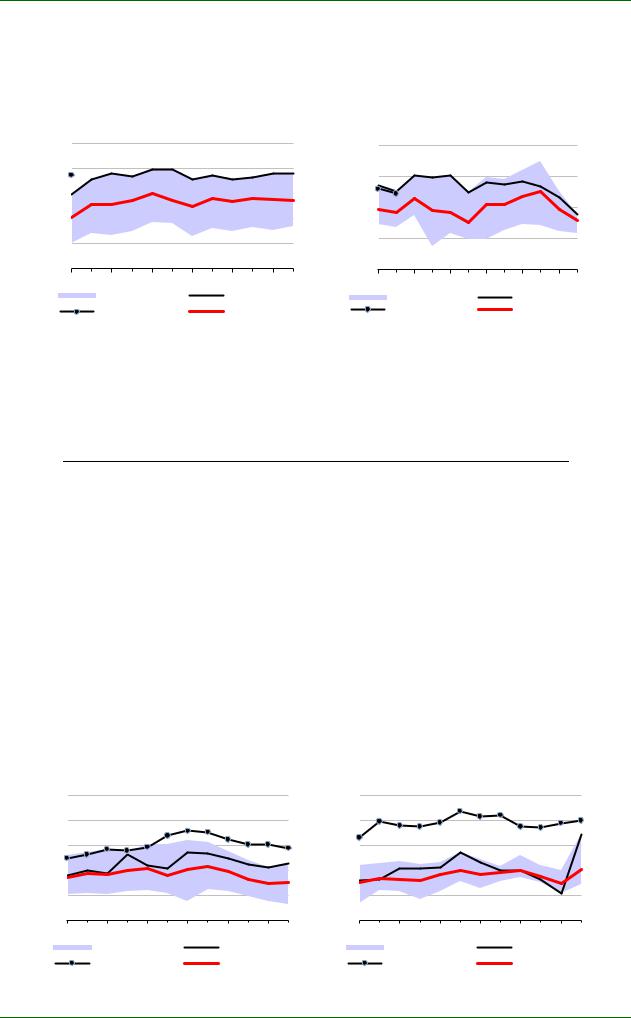
OECD Asia Oceania: Total Products |
||
9.5 |
|
Demand |
|
9.0 |
|
|
|
8.5 |
|
|
|
8.0 |
|
|
|
7.5 |
|
|
|
7.0 |
|
|
|
JAN |
APR |
JUL |
OCT |
|
Range 14-18 |
|
2018 |
|
2019 |
|
5-year avg |
mb/d Japan: Jet & Kerosene Demand
1.0 |
|
|
|
0.8 |
|
|
|
0.6 |
|
|
|
0.4 |
|
|
|
0.2 |
|
|
|
JAN |
APR |
JUL |
OCT |
|
Range 14-18 |
|
2018 |
|
2019 |
|
5-year avg |
Korean demand dropped by 225 kb/d in 4Q18. The economy is very dependent on exports and has started to suffer from trade tensions and a slowdown in China’s growth. The government announced six-month fuel tax cuts in September to help consumers. In Australia, oil demand rose by 25 kb/d y-o-y in 4Q18 on strong diesel deliveries.
OECD Asia Oceania oil demand contracted by 145 kb/d in 2018 and there will be a smaller decline of 125 kb/d in 2019, but the outcome depends partly on the resolution of trade tensions.
Non-OECD
China
Due to the Lunar New Year holiday, Chinese data for refining activity in January/February is unavailable at the time of publication and it is therefore impossible to calculate apparent demand figures.
The Chinese government recently lowered its GDP growth target for 2019 to between 6% to 6.5%. In the meantime, prompt indicators point to a significant slowdown in economic activity. These indicators may be difficult to interpret as Lunar New Year celebrations always cause distortions for January and February. Data for the period show a significant contraction in exports, falling 20.7% y-o-y in February, after growth of 9.1% in January. Customs data for the combined January-February period show a 4.6% decline. Imports dropped by 3.1% for the first two months, highlighting some weakness in domestic demand.
mb/d |
China: Total Products Demand |
||
14 |
|
|
|
13 |
|
|
|
12 |
|
|
|
11 |
|
|
|
10 |
|
|
|
9 |
|
|
|
JAN |
APR |
JUL |
OCT |
|
Range 13-17 |
|
2017 |
|
2018 |
|
5-year avg |
mb/d |
China: Gasoil/Diesel Demand |
||
4.0 |
|
|
|
3.5 |
|
|
|
3.0 |
|
|
|
2.5 |
|
|
|
2.0 |
|
|
|
JAN |
APR |
JUL |
OCT |
|
Range 13-17 |
|
2017 |
|
2018 |
|
5-year avg |
Weakness in passenger car sales has continued into 2019, with January-February seeing a decline of 17.5%. This is attributed to market saturation in some wealthy cities and a drop in consumer confidence. Electric vehicle sales continued to boom, however, with sales doubling in the first two months of 2019 versus the same period in 2018.
10 |
15 MARCH 2019 |
vk.com/id446425943 |
|
|
|
|
|
|
|
INTERNATIONAL ENERGY AGENCY - OIL MARKET REPORT |
|
|
|
DEMAND |
|||
mb/d |
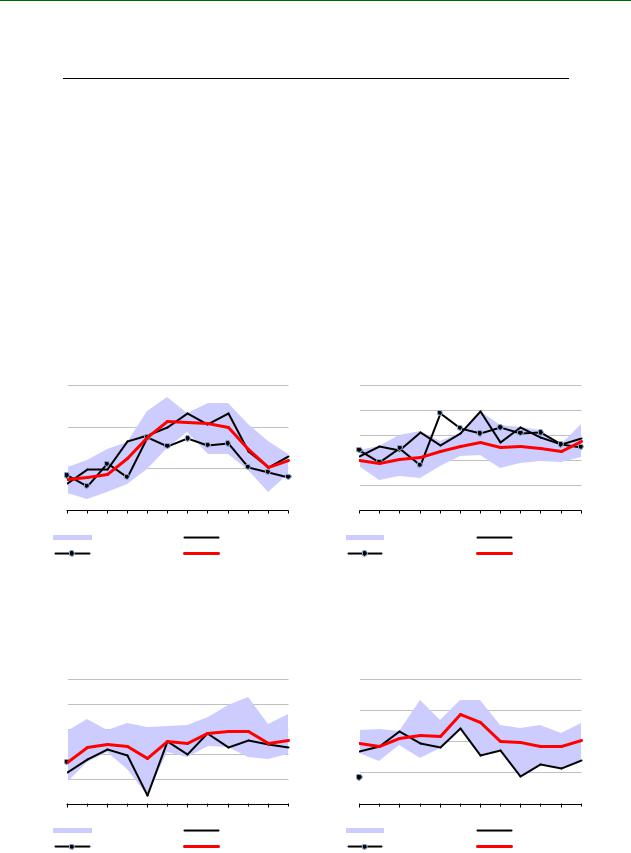
China: Motor Gasoline Demand |
units |
China Passenger Car Sales |
||||
|
|
|
|
Million |
|
|
|
3.5 |
|
|
|
3.0 |
|
|
|
|
|
|
|
|
|
|
|
3.0 |
|
|
|
2.5 |
|
|
|
2.5 |
|
|
|
2.0 |
|
|
|
|
|
|
|
|
|
|
|
|
|
|
|
1.5 |
|
|
|
2.0 |
|
|
|
1.0 |
|
|
|
|
|
|
|
|
|
|
|
1.5 |
|
|
|
0.5 |
|
|
|
JAN |
APR |
JUL |
OCT |
JAN |
APR |
JUL |
OCT |
|
Range 13-17 |
|
2017 |
|
Range 14-18 |
|
2018 |
|
2018 |
|
5-year avg |
|
2019 |
|
5-year avg |
After growth of 450 kb/d in 2018, we expect the pace of oil demand growth to slacken in 2019 to 420 kb/d. The recent sharp slowdown in economic activity introduces a downward risk to the forecast.
China: Demand by Product
(thousand barrels per day)
|
|
Demand |
|
Annual Chg (kb/d) |
Annual Chg (%) |
||
|
2017 |
2018 |
2019 |
2018 |
2019 |
2018 |
2019 |
LPG & Ethane |
1,523 |
1,616 |
1,718 |
93 |
102 |
6.1 |
6.3 |
Naphtha |
1,171 |
1,243 |
1,334 |
72 |
92 |
6.1 |
7.4 |
Motor Gasoline |
2,927 |
2,954 |
3,006 |
27 |
53 |
0.9 |
1.8 |
Jet Fuel & Kerosene |
710 |
800 |
850 |
90 |
50 |
12.8 |
6.2 |
Gas/Diesel Oil |
3,473 |
3,377 |
3,414 |
-96 |
38 |
-2.8 |
1.1 |
Residual Fuel Oil |
437 |
412 |
429 |
-24 |
17 |
-5.6 |
4.0 |
Other Products |
2,336 |
2,624 |
2,694 |
288 |
70 |
12.3 |
2.7 |
Total Products |
12,576 |
13,025 |
13,446 |
449 |
420 |
3.6 |
3.2 |
India
Revised data show that Indian oil demand increased by 215 kb/d in 2018 following growth of 125 kb/d in 2017. At the start of 2019, we have seen very strong growth in January of 365 kb/d based on robust gasoil and LPG/ethane demand, which were up by 100 kb/d and 85 kb/d, respectively. LPG utilisation has increased due to a government policy to promote its use in the domestic sector. This is largely at the expense of kerosene.
Gasoil demand rose by 70 kb/d in 2018, supported by strong economic activity, although GDP expansion in 4Q18 fell back to 6.6%, the lowest rate since 2017.
mb/d |
India: Total Products Demand |
||
6.0 |
|
|
|
5.5 |
|
|
|
5.0 |
|
|
|
4.5 |
|
|
|
4.0 |
|
|
|
3.5 |
|
|
|
3.0 |
|
|
|
JAN |
APR |
JUL |
OCT |
|
Range 14-18 |
|
2018 |
|
2019 |
|
5-year avg |
mb/d |
India: Gasoil/Diesel Demand |
||
2.0 |
|
|
|
1.8 |
|
|
|
1.6 |
|
|
|
1.4 |
|
|
|
1.2 |
|
|
|
1.0 |
|
|
|
JAN |
APR |
JUL |
OCT |
|
Range 14-18 |
|
2018 |
|
2019 |
|
5-year avg |
15 MARCH 2019 |
11 |
vk.com/id446425943
DEMAND INTERNATIONAL ENERGY AGENCY - OIL MARKET REPORT
Consumer spending has been weak, and car sales declined in the second part of 2018. Although car sales have not returned to growth in the first two months of 2019, gasoline demand has increased by 75 kb/d in January.
mb/d |
India: Motor Gasoline Demand |
||
0.8 |
|
|
|
0.7 |
|
|
|
0.6 |
|
|
|
0.5 |
|
|
|
0.4 |
|
|
|
0.3 |
|
|
|
JAN |
APR |
JUL |
OCT |
|
Range 14-18 |
|
2018 |
|
2019 |
|
5-year avg |
Units India Passenger Car Sales
350,000 |
|
|
|
300,000 |
|
|
|
250,000 |
|
|
|
200,000 |
|
|
|
150,000 |
|
|
|
JAN |
APR |
JUL |
OCT |
Range 14-18 |
|
2018 |
|
2019 |
|
|
5-year avg |
Rising demand for jet fuel, boosted by the booming aviation sector, did not completely offset the fall in kerosene use by households and total jet/kerosene demand declined by 5 kb/d. India’s domestic RPK grew by 14.8% y-o-y in December 2018 and 12.4% in January 2019. We expect strong growth in total oil demand to continue in 2019, reaching 245 kb/d y-o-y.
India: Demand by Product
(thousand barrels per day)
|
|
|
Demand |
|
Annual Chg (kb/d) |
Annual Chg (%) |
||
|
2017 |
|
2018 |
2019 |
2018 |
2019 |
2018 |
2019 |
LPG & Ethane |
740 |
781 |
828 |
40 |
47 |
5.5 |
6.0 |
|
Naphtha |
283 |
317 |
330 |
34 |
13 |
11.9 |
4.1 |
|
Motor Gasoline |
615 |
668 |
704 |
53 |
36 |
8.6 |
5.4 |
|
Jet Fuel & Kerosene |
242 |
247 |
263 |
5 |
16 |
2.1 |
6.6 |
|
Gas/Diesel Oil |
1,605 |
1,673 |
1,748 |
69 |
75 |
4.3 |
4.5 |
|
Residual Fuel Oil |
145 |
143 |
148 |
-2 |
5 |
-1.4 |
3.8 |
|
Other Products |
938 |
954 |
1,006 |
15 |
53 |
1.6 |
5.5 |
|
Total Products |
4,568 |
4,782 |
5,027 |
214 |
245 |
4.7 |
5.1 |
|
Other Non-OECD
Iraq’s oil demand remained very strong in December, increasing by 105 kb/d y-o-y, led by crude oil, gasoil and fuel oil. Crude oil direct use, however, remains well below its five-year average, having largely been replaced by fuel oil and natural gas imported from Iran. Fuel oil demand rose by 30 kb/d y-o-y in December.
kb/d |
Iraq: Motor Gasoline Demand |
kb/d |
Iraq: Residual Fuel Demand |
||||
180 |
|
|
|
300 |
|
|
|
160 |
|
|
|
250 |
|
|
|
140 |
|
|
|
200 |
|
|
|
120 |
|
|
|
150 |
|
|
|
100 |
|
|
|
100 |
|
|
|
80 |
|
|
|
50 |
|
|
|
JAN |
APR |
JUL |
OCT |
JAN |
APR |
JUL |
OCT |
|
Range 13-17 |
|
2017 |
|
Range 13-17 |
|
2017 |
|
2018 |
|
5-year avg |
|
2018 |
|
5-year avg |
12 |
|
|
|
|
|
|
15 MARCH 2019 |
vk.com/id446425943
INTERNATIONAL ENERGY AGENCY - OIL MARKET REPORT DEMAND
Non-OECD: Demand by Region
(thousand barrels per day)
|
|
Demand |
|
Annual Chg (kb/d) |
Annual Chg (%) |
||
|
2Q18 |
3Q18 |
4Q18 |
3Q18 |
4Q18 |
3Q18 |
4Q18 |
Africa |
4,289 |
4,197 |
4,427 |
7 |
162 |
0.2 |
3.8 |
Asia |
27,069 |
26,704 |
27,209 |
1,054 |
866 |
4.1 |
3.3 |
FSU |
4,636 |
4,906 |
4,830 |
178 |
232 |
3.8 |
5.0 |
Latin America |
6,355 |
6,465 |
6,422 |
-100 |
-27 |
-1.5 |
-0.4 |
Middle East |
8,541 |
8,760 |
8,208 |
-98 |
-1 |
-1.1 |
0.0 |
Non-OECD Europe |
744 |
774 |
784 |
11 |
27 |
1.4 |
3.6 |
Total Products |
51,635 |
51,805 |
51,880 |
1,052 |
1,259 |
2.1 |
2.5 |
Saudi Arabian oil demand continues to be extremely weak, declining by 255 kb/d y-o-y in December, with sharp drops in gasoline, gasoil and kerosene. Gasoline demand declined by 140 kb/d y-o-y, however this compares with an exceptionally strong number for December 2017 when deliveries were pushed up by impending price rises. Gasoil demand declined by 65 kb/d y-o-y, reflecting a slowing economy and a reduction in its use in power generation. Crude direct use rose while fuel oil declined 70 kb/d y-o-y.
mb/d |
Saudi Arabia: Total Products |
||
4.0 |
|
Demand |
|
3.5 |
|
|
|
3.0 |
|
|
|
2.5 |
|
|
|
JAN |
APR |
JUL |
OCT |
|
Range 13-17 |
2017 |
|
|
2018 |
|
5-year avg |
mb/d |
Saudi Arabia: Residual Fuel Demand |
||
1.0 |
|
|
|
0.8 |
|
|
|
0.6 |
|
|
|
0.4 |
|
|
|
0.2 |
|
|
|
0.0 |
|
|
|
JAN |
APR |
JUL |
OCT |
|
Range 13-17 |
|
2017 |
|
2018 |
|
5-year avg |
Saudi oil demand declined by 175 kb/d in 2018, after a drop of 25 kb/d in 2017. With a more favourable economic environment and the boost from government spending, demand is likely to grow again in 2019, albeit by only 50 kb/d.
mb/d |
Brazil: Total Products Demand |
||
3.6 |
|
|
|
3.4 |
|
|
|
3.2 |
|
|
|
3.0 |
|
|
|
2.8 |
|
|
|
2.6 |
|
|
|
JAN |
APR |
JUL |
OCT |
|
Range 14-18 |
|
2018 |
|
2019 |
|
5-year avg |
kb/d |
Argentina: Total Products Demand |
||
850 |
|
|
|
800 |
|
|
|
750 |
|
|
|
700 |
|
|
|
650 |
|
|
OCT |
JAN |
APR |
JUL |
|
|
Range 14-18 |
|
2018 |
|
2019 |
|
5-year avg |
Brazilian oil demand rose by 85 kb/d y-o-y in January, with gasoil rising by 50 kb/d and gasoline increasing by 40 kb/d. Domestic air traffic rose by 3.4% y-o-y in December but growth slowed to 0.3% in January. Overall, demand remained flat in 2018 but is expected to increase by 60 kb/d in 2019, reflecting faster economic growth.
15 MARCH 2019 |
13 |

vk.com/id446425943
DEMAND INTERNATIONAL ENERGY AGENCY - OIL MARKET REPORT
Argentina’s oil demand dropped by 40 kb/d y-o-y in January, reflecting the impact of the recent slowdown in economic activity. In 2018, oil demand fell 25 kb/d y-o-y and in 2019, we project a further contraction of 30 kb/d.
Non-OECD: Demand by Product
(thousand barrels per day)
|
|
Demand |
|
Annual Chg (kb/d) |
Annual Chg (%) |
||
|
2Q18 |
3Q18 |
4Q18 |
3Q18 |
4Q18 |
3Q18 |
4Q18 |
LPG & Ethane |
6,849 |
6,841 |
6,880 |
317 |
158 |
4.9 |
2.4 |
Naphtha |
2,940 |
2,928 |
3,079 |
184 |
158 |
6.7 |
5.4 |
Motor Gasoline |
11,397 |
11,754 |
11,882 |
341 |
491 |
3.0 |
4.3 |
Jet Fuel & Kerosene |
3,353 |
3,474 |
3,265 |
219 |
102 |
6.7 |
3.2 |
Gas/Diesel Oil |
14,994 |
14,740 |
14,939 |
22 |
156 |
0.2 |
1.1 |
Residual Fuel Oil |
4,838 |
4,834 |
4,697 |
-81 |
-21 |
-1.6 |
-0.5 |
Other Products |
7,263 |
7,235 |
7,138 |
48 |
215 |
0.7 |
3.1 |
Total Products |
51,635 |
51,805 |
51,880 |
1,052 |
1,259 |
2.1 |
2.5 |
For Iran, we considered quarterly data from the Ministry of Energy. Demand for 2017 was revised down by 20 kb/d, while for 2018 it was revised up by 40 kb/d. Within the total, gasoline demand was revised up significantly, while gasoil demand and fuel oil demand was revised down. These changes have been incorporated into our 2019 forecast resulting in stronger gasoline demand, and lower gasoil and fuel oil demand. In the end, the total level of demand is unchanged. Malaysia’s oil demand was also revised slightly up, by 25 kb/d for 2018.
14 |
15 MARCH 2019 |