

vk.com/id446425943
STOCKS INTERNATIONAL ENERGY AGENCY - OIL MARKET REPORT
STOCKS
Summary
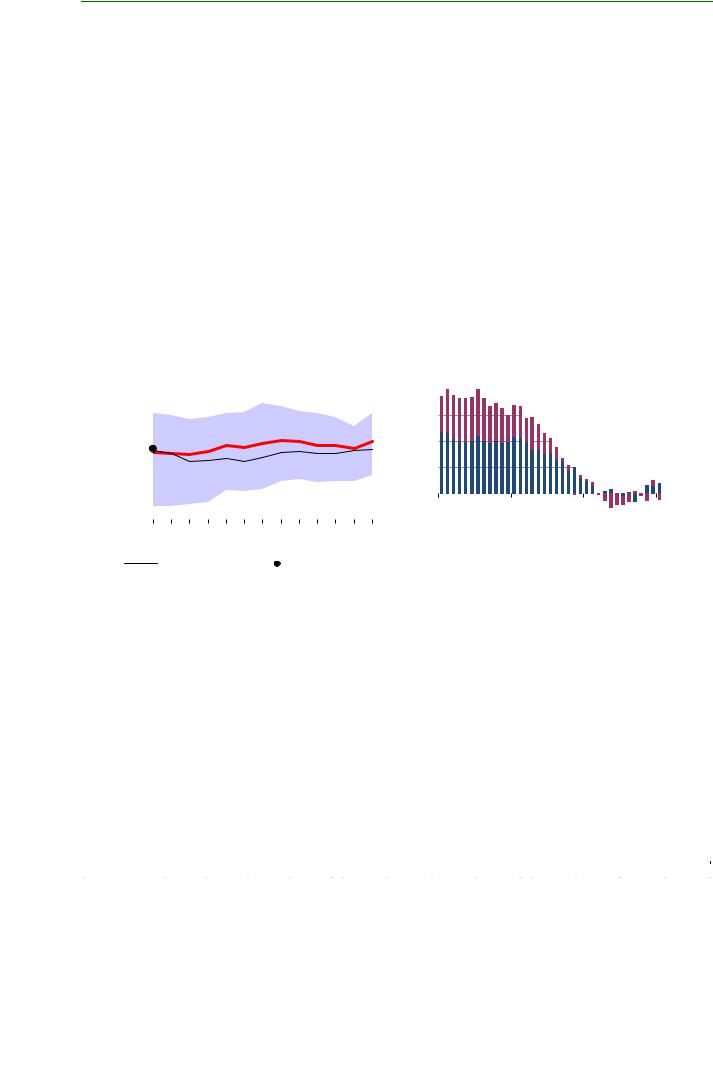
OECD commercial stocks rose 8.6 mb month-on-month (m-o-m) in January to 2 881 mb, the third straight monthly increase and the eighth in the last year. Stocks reached their highest level since November 2017. However, the gain was less than usual for the time of year, when maintenance at refineries and lower consumption of motor fuels boosts both crude and product stocks. The surplus to the five-year average fell from 50 mb in December to 21 mb.
Crude stocks built 20.3 mb on the month to reach 1 102 mb, a nine-month high, with gains recorded in all three OECD regions. NGL and feedstock holdings rose 1.9 mb m-o-m and remained close to the historical high reached at the end of last year. By contrast, oil product holdings declined counter-seasonally, by 13.6 mb m-o-m to 1 445 mb, due to lower refining output and higher demand for heating fuels in the northern hemisphere. OECD middle distillate inventories fell 10.1 mb and stood 33 mb below the five-year average at end-month, just 11 months before the implementation of the International Maritime Organisation’s new bunker sulphur rules that will boost demand for gasoil.
|
mb |
OECD Total Oil Industry Stocks |
mb |
OECD Stocks Vs 5-Year Average |
|
|
|||||||||||||||||||||
3 200 |
|
|
|
|
|
|
|
|
400 |
|
|
|
|
|
|
|
|
|
|
|
|
|
|
|
|
||
|
|
|
|
|
|
|
|
|
|
|
|
|
|
|
|
|
|
|
|
|
|
||||||
3 100 |
|
|
|
|
|
|
|
|
300 |
|
|
|
|
|
|
|
|
|
|
|
|
|
|
|
|
||
|
|
|
|
|
|
|
|
|
|
|
|
|
|
|
|
|
|
|
|
|
|
|
|||||
3 000 |
|
|
|
|
|
|
|
|
|
|
|
|
|
|
|
|
|
|
|
|
|
|
|
|
|||
|
|
|
|
|
|
|
|
200 |
|
|
|
|
|
|
|
|
|
|
|
|
|
|
|
|
|||
|
|
|
|
|
|
|
|
|
|
|
|
|
|
|
|
|
|
|
|
|
|
|
|||||
2 900 |
|
|
|
|
|
|
|
|
|
|
|
|
|
|
|
|
|
|
|
|
|
|
|
|
|||
|
|
|
|
|
|
|
|
|
|
|
|
|
|
|
|
|
|
|
|
|
|
||||||
|
|
|
|
|
|
|
|
|
|
|
|
|
|
|
|
|
|
|
|
|
|
|
|
|
|
||
2 800 |
|
|
|
|
|
|
|
|
100 |
|
|
|
|
|
|
|
|
|
|
|
|
|
|
|
|
||
|
|
|
|
|
|
|
|
|
|
|
|
|
|
|
|
|
|
|
|
|
|
|
|||||
2 700 |
|
|
|
|
|
|
|
|
|
|
|
|
|
|
|
|
|
|
|
|
|
|
|
|
|||
|
|
|
|
|
|
|
|
0 |
|
|
|
|
|
|
|
|
|
|
|
|
|
|
|
|
|||
|
|
|
|
|
|
|
|
|
|
|
|
|
|
|
|
|
|
|
|
|
|
|
|||||
2 600 |
|
|
|
|
|
|
|
|
|
|
|
|
|
|
|
|
|
|
|
|
|
|
|
|
|||
|
|
|
|
|
|
|
|
|
|
|
|
|
|
|
|
|
|
|
|
|
|
|
|||||
|
|
|
|
|
|
|
|
|
|
|
|
|
|
|
|
|
|
|
|
|
|
|
|
|
|
||
2 500 |
|
|
|
|
|
|
|
|
-100 |
|
|
|
|
|
|
|
|
|
|
|
|
|
|
|
|
||
|
|
|
|
|
|
|
|
|
|
|
|
|
|
|
|
|
|
|
|
|
|
||||||
|
Jan |
Mar May Jul |
Sep Nov Jan |
2016 |
2017 |
2018 |
2019 |
||||||||||||||||||||
|
|
|
|
Range 2014-2018 |
|
|
Avg 2014-2018 |
|
|
Oil Products |
|
|
Crude + NGL + Feedstocks |
||||||||||||||
|
|
|
|
|
|
|
|
|
|
||||||||||||||||||
2018 |
|
|
2019 |
|
|
|
|
||||||||||||||||||||
|
|
|
|
|
|
||||||||||||||||||||||
|
|
|
|
|
|
|
|
|
|
|
|
|
|
|
|
|
|
|
|
|
|||||||
Preliminary data for February show stocks declining in all three OECD regions and by 29.8 mb overall. If confirmed, this would be the largest downward movement in OECD stocks for 11 months and return the bloc’s inventories to below the five-year average. The steepest fall was seen in the United States, where product stocks declined 19.6 mb due to refinery maintenance. Crude stocks continued to build with higher light tight oil (LTO) output and despite record high crude exports.
Preliminary Industry Stock Change in January 2019 and Fourth Quarter 2018
|
|
|
|
January 2019 (preliminary) |
|
|
|
Fourth Quarter 2018 |
|
|||
|
|
(million barrels) |
|
|
(million barrels per day) |
|
|
(million barrels per day) |
|
|||
|
Am |
Europe |
As. Ocean |
Total |
Am |
Europe |
As. Ocean |
Total |
Am |
Europe |
As. Ocean |
Total |
Crude Oil |
7.7 |
9.0 |
3.6 |
20.3 |
0.25 |
0.29 |
0.12 |
0.65 |
0.37 |
-0.05 |
0.17 |
0.48 |
Gasoline |
10.9 |
3.6 |
0.4 |
14.9 |
0.35 |
0.12 |
0.01 |
0.48 |
0.09 |
0.11 |
0.00 |
0.20 |
Middle Distillates |
3.7 |
-5.1 |
-8.7 |
-10.1 |
0.12 |
-0.16 |
-0.28 |
-0.33 |
0.01 |
-0.13 |
-0.05 |
-0.16 |
Residual Fuel Oil |
1.5 |
3.5 |
0.5 |
5.5 |
0.05 |
0.11 |
0.02 |
0.18 |
-0.01 |
-0.01 |
0.01 |
-0.01 |
Other Products |
-18.8 |
-1.2 |
-3.8 |
-23.8 |
-0.61 |
-0.04 |
-0.12 |
-0.77 |
-0.26 |
-0.02 |
-0.01 |
-0.29 |
Total Products |
-2.7 |
0.8 |
-11.6 |
-13.6 |
-0.09 |
0.03 |
-0.38 |
-0.44 |
-0.17 |
-0.05 |
-0.05 |
-0.27 |
Other Oils1 |
3.4 |
0.4 |
-1.9 |
1.9 |
0.11 |
0.01 |
-0.06 |
0.06 |
-0.17 |
0.04 |
-0.01 |
-0.15 |
Total Oil |
8.3 |
10.2 |
-10.0 |
8.6 |
0.27 |
0.33 |
-0.32 |
0.28 |
0.03 |
-0.07 |
0.11 |
0.07 |
1 Other oils includes NGLs, feedstocks and other hydrocarbons.
OECD stocks were revised up by 15.1 mb in December. The biggest adjustment was in the Americas, particularly in Mexico, where crude stocks increased 1.2 mb m-o-m to 29 mb, their highest in 15 months, due to low refinery runs. Middle distillate stock figures were also revised up significantly in the Americas and in Europe. Finally, November stock figures were also changed, in this case down by 4.3 mb.
30 |
15 MARCH 2019 |