

vk.com/id446425943
PRICES INTERNATIONAL ENERGY AGENCY - OIL MARKET REPORT
PRICES
Market overview
Oil prices increased month-on-month (m-o-m) in February as Vienna Agreement members cut output and supplies from Iran and Venezuela declined further. ICE Brent rose above $65/bbl for the first time in three months and NYMEX WTI maintained an almost $10/bbl discount to Brent. Medium-heavy crudes, in particular, are in short supply and there is potential for further market tightening as Saudi Arabia has announced it will again reduce output into April and Iranian sanction waivers are due to expire in May. This has boosted the price of crudes such as Mars, which is currently trading at a premium of over $7/bbl to WTI, a five-year high. Elsewhere, sour Dubai has been priced higher than sweet North Sea crude since 21 February and this has made Brent-linked crude from the North Sea and West Africa more attractive to Asian buyers. In product markets, gasoline cracks have recovered from multi-year lows. Refinery maintenance and outages helped to clear the global supply glut and the US began the transition to higher-cost summer fuel. The reduced availability of heavy crude means that refiners are producing less fuel oil and this supported prices for highand lowsulphur fuel oil.
Futures markets
Benchmark crude futures prices rose in February, for the second consecutive month, as members of the Vienna Agreement restrained output, Canadian producers cut and growth in the US shale patch slowed. ICE Brent gained $4.19/bbl m-o-m, while NYMEX WTI increased by $3.43/bbl as lower US refinery runs weighed on the benchmark. The Brent futures curve has flipped entirely to backwardation, with the price of barrels delivered in May 2019 $1.21/bbl above those to be delivered 12 months out. Meanwhile, the WTI futures curve is in contango with April 2019 contract prices standing $1.76/bbl below March 2020 prices. Currently, US markets are well supplied thanks to high rates of domestic production and lower- than-usual refinery activity. Meanwhile, sour crude markets are tighter as output from Iran, Venezuela and Vienna Agreement members has been taken off the market. This has caused the DME Oman futures curve to display steeper backwardation. On the other hand, in addition to rising US LTO, the re-start of Libya’s El-Sharara field increases the supply of lighter crude.
Crude Futures
$/bbl |
|
Front Month Close |
|
|
90 |
|
|
|
|
85 |
|
|
|
|
80 |
|
|
|
|
75 |
|
|
|
|
70 |
|
|
|
|
65 |
|
|
|
|
60 |
|
|
|
|
55 |
|
|
|
|
50 |
Source: ICE, NYMEX |
|
|
|
45 |
|
|
||
|
|
|
|
|
40 |
|
|
|
|
May 18 |
Jul 18 |
Sep 18 Nov 18 |
Jan 19 |
Mar 19 |
|
NYMEX WTI |
ICE Brent |
||
NYMEX WTI and ICE Brent
$/bbl |
|
|
|
Forward Price Curves |
|
|
|
|||||
68 |
12 Mar 19 |
|
|
|
|
|
|
|
|
|
|
|
66 |
|
|
|
|
|
|
|
|
|
|
|
|
64 |
|
|
|
|
|
|
|
|
|
|
|
|
62 |
|
|
|
|
|
|
|
|
|
|
|
|
60 |
|
|
|
|
|
|
|
|
|
|
|
|
58 |
|
|
|
|
|
|
|
|
|
|
|
|
56 |
|
|
|
|
|
|
|
|
|
|
|
|
54 |
|
|
|
|
|
|
|
|
Source: ICE, NYMEX |
|||
52 |
|
|
|
|
|
|
|
|
||||
|
|
|
|
|
|
|
|
|
|
|
|
|
50 |
M1 |
2 |
3 |
4 |
5 |
6 |
7 |
8 |
9 |
10 |
11 |
12 |
|
||||||||||||
|
|
|
NYMEX WTI |
|
|
ICE Brent |
|
|
||||
Money manager’s net long positions in ICE Brent and NYMEX WTI crude futures have more than doubled since the beginning of January and now stand at 480 mb. Bets by funds that oil prices will increase have not been at this level since October 2018, when the oil price was around $75/bbl. Those betting on higher prices have been encouraged by positive news relating to US-China trade talks and as members of the Vienna Agreement have demonstrated their commitment to output cuts. Net long positions are, however, a long way from the record of over 1 000 mb seen in May 2018 and the long-to-short ratio is currently 5:1, having been as high as 15:1 during the last 12 months. Net long positions in ICE gasoil futures have increased from 2 mb in early January to 63 mb at the end of February. Bullish sentiment reflects the tightness in gasoil markets due to reduced heavy sour (gasoil-rich) crude availability. The ICE
36 |
15 MARCH 2019 |
vk.com/id446425943
INTERNATIONAL ENERGY AGENCY - OIL MARKET REPORT |
PRICES |
|
|
gasoil futures curve has displayed increasingly steep backwardation since 29 January. Meanwhile, the NYMEX RBOB gasoline futures curve had been in contango since early January due to a supply glut but the discount of near-term supplies narrowed to close to zero in early March.
mb |
|
Money Managers' Net Long |
$/bbl |
mb |
|
Money Managers' Net Long Positions |
|||
1,000 |
|
Positions in Crude Futures |
90 |
140 |
|
in ICE Gasoil Futures |
|
||
|
|
|
|
|
|||||
|
|
|
|
|
|
|
|||
800 |
|
|
|
80 |
120 |
|
|
|
|
|
|
|
70 |
|
|
|
|
||
|
|
|
100 |
|
|
|
|
||
600 |
|
|
|
60 |
|
|
|
|
|
|
|
|
50 |
80 |
|
|
|
|
|
|
|
|
|
|
|
|
|
||
400 |
|
|
|
40 |
60 |
|
|
|
|
|
|
|
30 |
|
|
|
|
||
|
|
|
|
|
|
|
|
|
|
200 |
|
|
|
20 |
40 |
Source: LC9 |
|
|
|
|
Sources: /CT/, L/9 |
|
10 |
20 |
|
|
|||
0 |
|
0 |
|
|
|
|
|||
|
|
|
0 |
|
|
|
|
||
Sep 18 |
Nov 18 |
Jan 19 |
Mar 19 |
|
|
|
|
||
|
Money Managers |
ICE Brent (RHS) |
Sep-18 |
Nov-18 |
Jan-19 |
Mar-19 |
|||
Prompt Month Oil Futures Prices
(monthly and weekly averages, $/bbl)
|
|
Dec |
Jan |
Feb |
Feb-Jan |
% |
Week Commencing: |
25 Feb |
04 Mar |
||
|
|
|
|
|
Avg Chg |
Chg |
04 Feb |
11 Feb |
18 Feb |
||
NYMEX |
|
|
|
|
|
|
|
|
|
|
|
Light Sw eet Crude Oil |
48.98 |
51.55 |
54.98 |
3.43 |
6.7 |
53.52 |
53.88 |
56.81 |
56.19 |
56.42 |
|
RBOB |
58.28 |
58.10 |
63.67 |
5.57 |
9.6 |
60.39 |
62.10 |
67.07 |
68.25 |
74.87 |
|
ULSD |
75.54 |
77.97 |
82.38 |
4.41 |
5.7 |
80.02 |
81.73 |
84.84 |
84.16 |
84.50 |
|
ULSD ($/mmbtu) |
13.32 |
13.75 |
14.53 |
0.78 |
5.7 |
14.11 |
14.41 |
14.96 |
14.84 |
14.90 |
|
Henry Hub Natural Gas ($/mmbtu) |
3.93 |
3.10 |
2.68 |
-0.42 |
-13.5 |
2.62 |
2.62 |
2.68 |
2.83 |
2.86 |
|
ICE |
|
|
|
|
|
|
|
|
|
|
|
Brent |
57.67 |
60.24 |
64.43 |
4.19 |
7.0 |
62.18 |
63.67 |
66.84 |
65.49 |
65.91 |
|
Gasoil |
73.18 |
75.06 |
80.60 |
5.54 |
7.4 |
77.83 |
79.79 |
82.89 |
82.85 |
83.07 |
|
Prompt Month Differentials |
|
|
|
|
|
|
|
|
|
|
|
NYMEX WTI - ICE Brent |
-8.69 |
-8.69 |
-9.45 |
-0.76 |
|
-8.66 |
-9.79 |
-10.03 |
-9.30 |
-9.49 |
|
NYMEX ULSD - WTI |
26.56 |
26.42 |
27.40 |
0.98 |
|
26.50 |
27.85 |
28.03 |
27.97 |
28.08 |
|
NYMEX RBOB - WTI |
9.30 |
6.55 |
8.69 |
2.14 |
|
6.87 |
8.22 |
10.26 |
12.06 |
18.45 |
|
NYMEX 3-2-1 Crack (RBOB) |
15.05 |
13.17 |
14.92 |
1.75 |
|
13.41 |
14.76 |
16.18 |
17.36 |
21.66 |
|
NYMEX ULSD - Natural Gas ($/mmbtu) |
9.40 |
10.65 |
11.85 |
1.20 |
|
11.49 |
11.79 |
12.29 |
12.01 |
12.04 |
|
ICE Gasoil - ICE Brent |
15.51 |
14.82 |
16.17 |
1.35 |
|
15.65 |
16.12 |
16.05 |
17.36 |
17.16 |
|
Source: ICE, NYMEX.
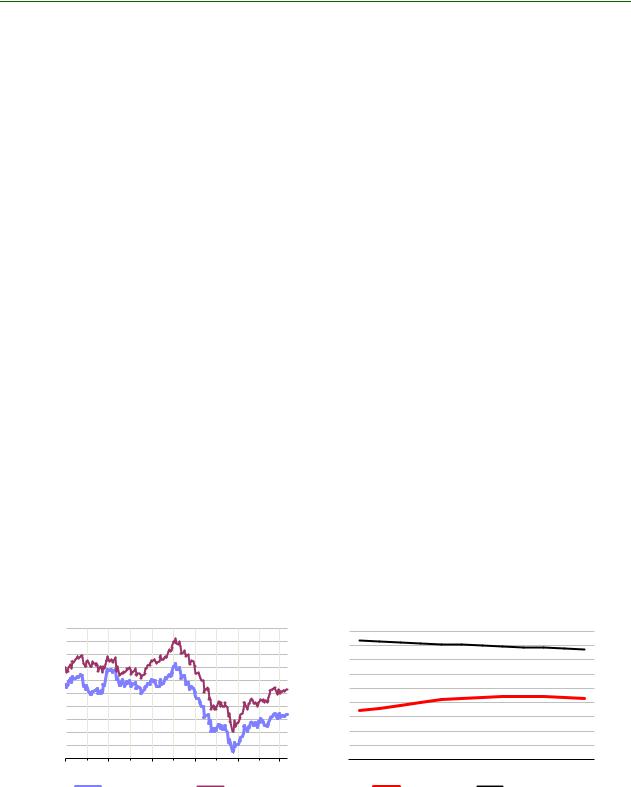
Spot crude oil prices
Dubai prices were on average $0.42/bbl above North Sea Dated in February due to tightness in sour crude markets. The Brent-Dubai Exchange of Futures for Swaps (EFS) fell to a nine-year low of $0.15/bbl on 14 February and this enhanced the attractiveness of Brent-linked oil in Asian markets. WTI’s discount to North Sea Dated widened by $1.20/bbl m-o-m as lower domestic refinery demand capped US price gains.
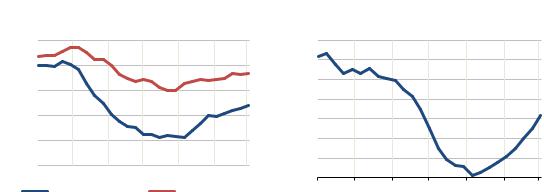
The announcement of sanctions against Petroleos de Venezuela S.A., which will remove sour crude volumes from the market, boosted alternatives such as Mars, Poseidon and Maya. These gained $1.73/bbl, $1.61/bbl and $1.49/bbl m-o-m, respectively, against WTI. The premium of Louisiana Light Sweet (LLS) to Mars averaged $1.28/bbl in February, having been $3.37/bbl on average in 2018. The price of LTO in the Permian Basin gained $3.24/bbl against WTI in February, and traded at a premium for the later part of the month. As recently as December, it had traded at a $9/bbl discount, and had fallen as low as $17.75/bbl below WTI in August 2018 due to strong output growth running against infrastructure constraints. Permian prices have recovered as pipeline capacity, such as Enterprise
|
|
|
15 MARCH 2019 |
37 |
|
vk.com/id446425943
PRICES |
INTERNATIONAL ENERGY AGENCY - OIL MARKET REPORT |
|
|
Product Partners’ NGL pipeline conversion and an expansion of Enterprise’s Midland to Sealy line, is becoming available earlier than expected. Although US refinery runs fell, there was healthy export demand for US crude from Europe and Asia Pacific. This caused WTI prices in Houston to gain $0.43/bbl m-o-m against North Sea Dated.
$/bbl |
Benchmark Crude Prices |
|
$/bbl |
Brent - Dubai EFS |
|||||
|
|
|
|||||||
90 |
|
|
|
|
4.0 |
|
|
|
|
85 |
|
|
|
|
|
|
|
|
|
|
|
|
|
3.5 |
|
|
|
|
|
80 |
/opyright © 2019 Argus aedia |
|
|
|
|
|
|||
75 |
|
|
|
|
3.0 |
|
|
|
|
70 |
|
|
|
|
2.5 |
|
|
|
|
65 |
|
|
|
|
|
|
|
|
|
|
|
|
|
2.0 |
|
|
|
|
|
60 |
|
|
|
|
|
|
|
|
|
55 |
|
|
|
|
1.5 |
|
|
|
|
50 |
|
|
|
|
|
|
|
|
|
|
|
|
|
1.0 |
|
|
|
|
|
45 |
|
|
|
|
|
|
|
|
|
40 |
Nov 18 Dec 18 |
Jan 19 |
Feb 19 |
Mar 19 |
0.5 |
/opyright © 2019 Argus aedia Ltd |
|
|
|
Oct 18 |
0.0 |
|
|
|
|
||||
WTI Cushing |
N. Sea Dated |
Dubai |
|
|
|
|
|||
Oct 18 |
Nov 18 Dec 18 |
Jan 19 |
Feb 19 Mar 19 |
||||||
The Western Canadian Select (WCS) differential to WTI has narrowed by $5.45/bbl since output cuts were implemented at the start of the year. The success of the curbs in reducing the WCS price discount, which reached $50.75/bbl in October 2018, has led to a relaxation of the restrictions. In February, WCS actually declined $2.29/bbl m-o-m against WTI due to the temporary shut-down of two key export pipelines (TransCanada’s Keystone and Enbridge’s Platte) which disrupted exports. As this reduced supplies of WCS on the US Gulf Coast the price of the crude in Houston gained $1.22/bbl m-o-m against WTI. On 4 March, Enbridge announced a one year delay to the start-up of its Line 3 replacement project. This much needed boost to Canadian export capacity is now expected to be in service in mid-2020. In the meantime, the Albertan government is making more rail transport available, but moving volumes by train can cost $10 - $15/bbl. For rail transport to make economic sense the WCS discount needs to exceed this cost. Since the WCS discount narrowed in late 2018, rail export volumes have fallen.
US Gulf Coast
$/bbl |
|
Differentials to WTI |
||
10 |
|
|
|
|
8 |
|
|
|
|
6 |
|
|
|
|
4 |
|
|
|
|
2 |
|
|
|
|
/opyright © 2019 Argus aedia Ltd |
|
|||
0 |
|
|
|
|
Oct 18 |
Nov 18 |
Dec 18 |
Jan 19 |
Feb 19 Mar 19 |
|
LLS |
Mars |
Poseidon |
|
$/bbl |
WCS |
|
|
10 |
Differential to WTI |
|
|
|
|
|
|
0 |
|
|
|
-10 |
|
|
|
-20 |
|
|
|
-30 |
|
|
|
-40 |
|
|
|
-50 |
/opyright © 2019 Argus aedia Ltd |
||
-60 |
|
|
|
Oct 18 |
Nov 18 Dec 18 |
Jan 19 |
Feb 19 Mar 19 |
|
WCS Hardisty |
WCS Houston |
|
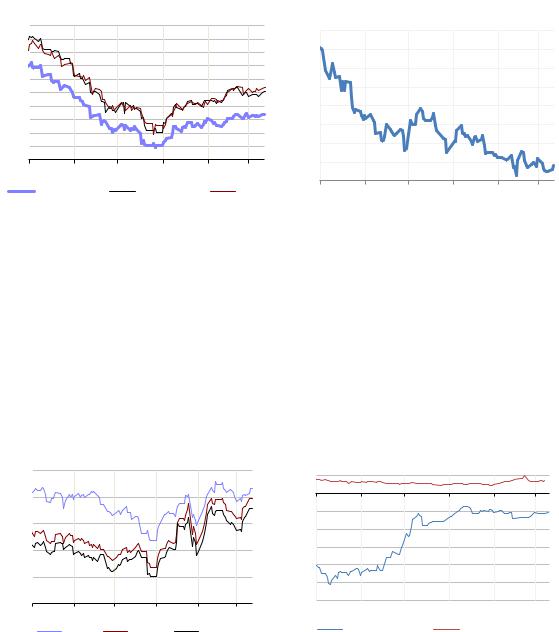
Prices for Forties, Brent, Ekofisk and Oseberg gained against North Sea Dated in February. Forties was up $0.17/bbl m-o-m on higher Asia Pacific demand, aided by the lower Brent-Dubai EFS. However, at the end of the month Forties fell to $0.85/bbl below North Sea Dated as refinery maintenance in Europe and Asia weighed on demand and alternative crudes such as Urals were more competitively priced. Loading schedules indicate that North Seas supplies will decline in April which should help to bolster prices.
38 |
15 MARCH 2019 |

vk.com/id446425943
INTERNATIONAL ENERGY AGENCY - OIL MARKET REPORT |
PRICES |
|
|
Spot crude oil prices and differentials
Table Unavailable
Available in the subscription version.
To subscribe, visit: https://webstore.iea.org/
As previously reported (January 2018 OMR), S&P Global Platts (Platts) proposed the inclusion of deals for North Sea crudes delivered to Rotterdam, adjusted for freight costs, in its North Sea Dated benchmark. This is intended to enhance the liquidity underpinning the assessment, and, on 26 February, Platts confirmed the reform will be effective from October. On 15 February, rival price reporting agency Argus launched the “New North Sea Dated” price. This assessment will incorporate Bonny Light, Qua Iboe, Escravos, BTC Blend, Saharan Blend and WTI Houston grades, along with the five North Sea crudes that make up North Sea Dated. The lowest priced grade will set the benchmark. Historically WTI Houston is often the cheapest of these 11 crudes and so is expected to often set the price, resulting in a divergence between North Sea Dated and New North Sea Dated. The change is intended to increase the number of deals included in the price assessment and also ensure the benchmark reflects the wider market for light sweet crude in North East Europe. For the moment, the changes proposed by Platts are expected to have a limited impact on the benchmark price, although they pave the way for the inclusion of other CIFdelivered crudes. Rather than directly changing its key North Sea Dated benchmark, Argus will report both the new and old benchmarks in parallel.
$/bbl |
North Sea Crude |
|
$/bbl |
|
Angolan Crude |
|
|
Differentials to North Sea Dated |
3.0 |
|
|
||||
2.5 |
Differentials to North Sea Dated |
||||||
|
|
||||||
|
|
2.0 |
|
|
|
||
|
/opyright © 2019 Argus aedia Ltd |
|
|
|
|
||
1.5 |
|
|
1.0 |
|
|
|
|
|
|
|
|
|
|
||
0.5 |
|
|
0.0 |
|
|
|
|
-0.5 |
|
|
-1.0 |
|
|
|
|
|
|
-2.0 |
|
|
|
||
|
|
|
|
/opyright © 2019 Argus aedia Ltd |
|||
-1.5 |
|
|
-3.0 |
|
|||
|
|
|
|
|
|||
Oct 18 |
Nov 18 Dec 18 Jan 19 Feb 19 Mar 19 |
May 18 |
Jul 18 |
Sep 18 Nov 18 |
Jan 19 Mar 19 |
||
|
Statfjord |
Ekofisk |
Cabinda |
Dalia |
Girassol |
||
|
Hungo |
Nemba |
Kissanje |
||||
|
Oseberg |
Forties |
|||||
|
|
|
|
|
|||
Key Angolan and Nigerian crudes were also supported by the lower Brent-Dubai EFS. Chinese buyers turned to Angola to replace supplies from Venezuela. In particular, heavy grades such as Dalia and Girassol gained $0.92/bbl and $0.70/bbl m-o-m against North Sea Dated, respectively, in February. Loading programmes show a reduction in Angolan shipments in April, while exports from the new Egina field will see Nigerian exports increase.
|
|
|
15 MARCH 2019 |
39 |
|