

vk.com/id446425943
DEMAND INTERNATIONAL ENERGY AGENCY - OIL MARKET REPORT
fewer in Germany. The weather was particularly mild in February in Europe, with 19% and 31% fewer HDDs in France and Germany, respectively.
OECD
We now have complete data for OECD countries for the whole of 2018. For January 2019, preliminary estimates are available for Mexico, Japan, Korea and some European countries. US weekly data are available through to the end of February.
OECD Demand based on Adjusted Preliminary Submissions - January 2019
(million barrels per day)
|
Gasoline |
Jet/Kerosene |
Diesel |
Other Gasoil |
RFO |
Other |
Total Products |
|||||||
|
mb/d |
% pa |
mb/d |
% pa |
mb/d |
% pa |
mb/d |
% pa |
mb/d |
% pa |
mb/d |
% pa |
mb/d |
% pa |
OECD Americas* |
10.68 |
2.4 |
1.95 |
2.6 |
5.01 |
-0.7 |
0.55 |
2.6 |
0.64 |
-3.9 |
6.98 |
2.0 |
25.80 |
1.5 |
US50 |
8.98 |
2.7 |
1.66 |
2.0 |
4.21 |
0.1 |
0.19 |
0.1 |
0.31 |
-7.6 |
5.44 |
1.6 |
20.79 |
1.6 |
Canada |
0.79 |
2.2 |
0.14 |
15.5 |
0.26 |
5.7 |
0.28 |
-4.7 |
0.06 |
-27.5 |
0.87 |
4.2 |
2.41 |
2.0 |
Mexico |
0.76 |
-0.6 |
0.09 |
-2.7 |
0.31 |
-15.8 |
0.06 |
91.1 |
0.17 |
15.6 |
0.55 |
3.6 |
1.93 |
0.1 |
OECD Europe |
1.77 |
1.7 |
1.37 |
4.7 |
4.48 |
-0.1 |
1.72 |
24.0 |
0.91 |
5.3 |
3.51 |
-1.3 |
13.74 |
3.1 |
Germany |
0.44 |
3.2 |
0.21 |
18.4 |
0.64 |
-0.7 |
0.45 |
37.6 |
0.09 |
-4.3 |
0.48 |
-8.6 |
2.32 |
5.2 |
United Kingdom |
0.27 |
2.0 |
0.33 |
1.0 |
0.47 |
1.2 |
0.12 |
12.0 |
0.02 |
-6.1 |
0.28 |
10.6 |
1.49 |
3.6 |
France |
0.17 |
4.5 |
0.16 |
5.4 |
0.63 |
-3.3 |
0.28 |
20.0 |
0.05 |
-1.5 |
0.35 |
4.2 |
1.64 |
3.4 |
Italy |
0.14 |
1.8 |
0.10 |
5.9 |
0.46 |
2.8 |
0.06 |
17.6 |
0.07 |
-4.5 |
0.36 |
1.6 |
1.20 |
2.8 |
Spain |
0.10 |
0.5 |
0.11 |
0.6 |
0.44 |
-0.6 |
0.20 |
5.8 |
0.16 |
10.0 |
0.30 |
4.8 |
1.31 |
2.9 |
OECD Asia & Oceania |
1.46 |
0.6 |
1.22 |
-3.7 |
1.35 |
2.9 |
0.54 |
0.5 |
0.62 |
-8.0 |
3.12 |
-4.9 |
8.31 |
-2.5 |
Japan |
0.79 |
-2.4 |
0.72 |
-7.2 |
0.39 |
0.1 |
0.37 |
-4.5 |
0.34 |
2.5 |
1.47 |
-5.7 |
4.08 |
-4.1 |
Korea |
0.24 |
12.6 |
0.27 |
1.1 |
0.42 |
14.2 |
0.11 |
16.2 |
0.24 |
-20.6 |
1.40 |
-4.2 |
2.68 |
-1.0 |
Australia |
0.31 |
-0.3 |
0.17 |
3.2 |
0.48 |
-2.7 |
0.00 |
0.0 |
0.02 |
-9.0 |
0.16 |
-4.4 |
1.13 |
-1.3 |
OECD Total |
13.91 |
2.1 |
4.54 |
1.4 |
10.83 |
0.0 |
2.81 |
14.2 |
2.17 |
-1.6 |
13.60 |
-0.5 |
47.85 |
1.3 |
* Including US territories
Gasoline demand in OECD countries rose by 2.1% year-on-year (y-o-y) in January, according to provisional data. Diesel demand was roughly flat. Jet/kerosene demand fell sharply in Asia Oceania on relatively high temperatures.
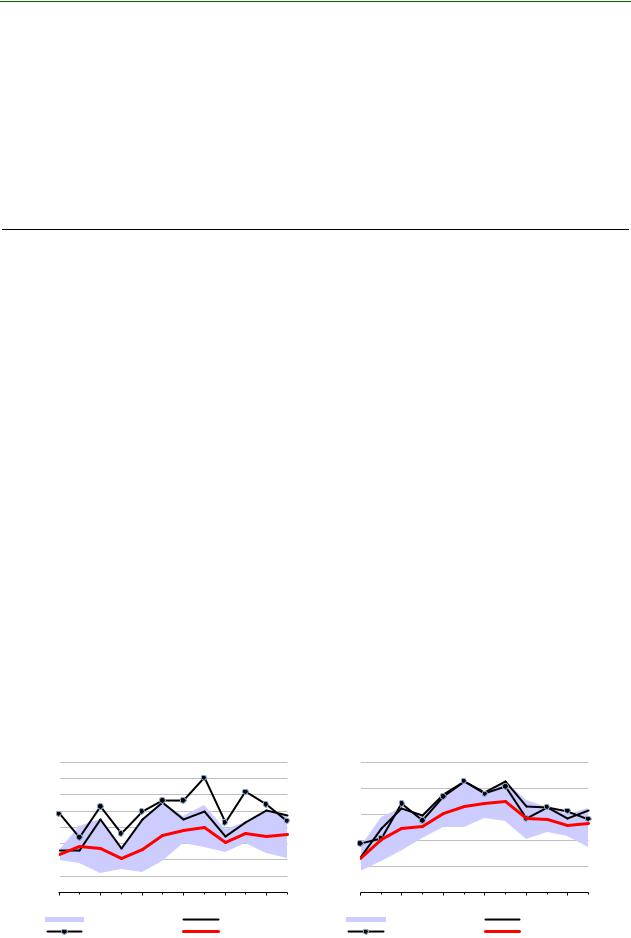
OECD Americas
Data released for 4Q18 in OECD Americas were particularly weak, with demand revised down by a significant 340 kb/d. For the US, November data were lowered by 345 kb/d and December data was 145 kb/d below our forecast. Canadian data were also cut by 70 kb/d for November, and December demand showed a contraction of 170 kb/d. Finally, Mexican oil demand declined by 165 kb/d y-o-y in December.
mb/d |
OECD Americas: Total Products |
||
27.0 |
|
Demand |
|
26.5 |
|
|
|
26.0 |
|
|
|
25.5 |
|
|
|
25.0 |
|
|
|
24.5 |
|
|
|
24.0 |
|
|
|
23.5 |
|
|
|
23.0 |
|
|
|
JAN |
APR |
JUL |
OCT |
|
Range 13-17 |
|
2017 |
|
2018 |
|
5-year avg |
mb/d |
OECD Americas: Motor Gasoline |
||
12.0 |
|
Demand |
|
11.5 |
|
|
|
11.0 |
|
|
|
10.5 |
|
|
|
10.0 |
|
|
|
9.5 |
|
|
|
JAN |
APR |
JUL |
OCT |
|
Range 13-17 |
|
2017 |
|
2018 |
|
5-year avg |
6 |
15 MARCH 2019 |
vk.com/id446425943
INTERNATIONAL ENERGY AGENCY - OIL MARKET REPORT DEMAND
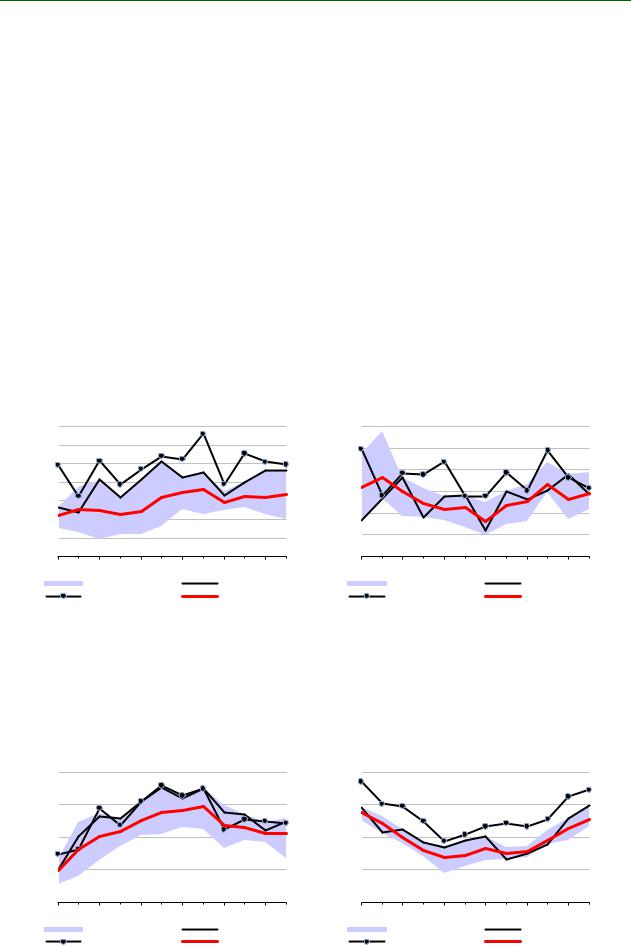
The US changes led to an overall downward revision of 160 kb/d for 4Q18, even if overall demand growth remains supported by strong LPG/ethane deliveries. We estimate that the US saw the largest oil demand growth of all countries worldwide in 2018, with 495 kb/d.
LPG/ethane demand growth is estimated at 315 kb/d y-o-y in 4Q18, due to the start-up of ethane based ethylene crackers. LPG/ethane demand grew by 330 kb/d y-o-y in November and 235 kb/d in December. For 2018 as a whole, LPG/ethane demand growth was 315 kb/d, supported by very cold temperatures at the start of the year, the lack of a strong hurricane season versus 2017 and the start-up of petrochemical projects. Once again, in 2019, growth in the petrochemicals sector will support LPG/ethane demand growth of 150 kb/d.
Gasoil demand growth slowed to 130 kb/d y-o-y in 4Q18 from 190 kb/d in 3Q18, with growth particularly weak in November and December at only 10 kb/d. Truck transport demand in 2018 has been supported by the continued growth in e-commerce sales and booming economic activity, although industrial production started to slow in 4Q18. Shale oil production contributed to higher diesel demand, via trucks used in the transport of sands and heavy equipment. Trucks are also used to move crude oil out of some producing areas. US gasoil and diesel demand increased by 200 kb/d in 2018 but is expected to expand by only 15 kb/d in 2019, as the US economy is starting to slow and new pipelines will reduce the need to transport crude oil by truck.
mb/d US50: Total Products Demand
21.5 |
|
|
|
21.0 |
|
|
|
20.5 |
|
|
|
20.0 |
|
|
|
19.5 |
|
|
|
19.0 |
|
|
|
18.5 |
|
|
|
18.0 |
|
JUL |
|
JAN |
APR |
OCT |
|
|
Range 13-17 |
|
2017 |
|
2018 |
|
5-year avg |
mb/d |
US50: Gasoil/Diesel Demand |
||
4.6 |
|
|
|
4.4 |
|
|
|
4.2 |
|
|
|
4.0 |
|
|
|
3.8 |
|
|
|
3.6 |
|
|
|
3.4 |
|
|
|
JAN |
APR |
JUL |
OCT |
|
Range 13-17 |
|
2017 |
|
2018 |
|
5-year avg |
Gasoline demand was roughly unchanged y-o-y in 4Q18, increasing by only 5 kb/d. The latest US data point to a rebound in gasoline demand in November (135 kb/d) and a small decline in December (25 kb/d). US vehicle miles travelled increased by a very low 0.3% y-o-y in November, according to the Federal Highway Administration. The strong price increase experienced in 2018 cut gasoline demand by 10 kb/d for the year as a whole. In 2019, the forward curve points to a fall in prices, so we expect a strong rebound with growth close to 120 kb/d.
mb/d US50: Motor Gasoline Demand
10.0 |
|
|
|
9.5 |
|
|
|
9.0 |
|
|
|
8.5 |
|
|
|
8.0 |
|
|
|
JAN |
APR |
JUL |
OCT |
|
Range 13-17 |
|
2017 |
|
2018 |
|
5-year avg |
mb/d US50: LPG Demand
3.5 |
|
|
|
3.0 |
|
|
|
2.5 |
|
|
|
2.0 |
|
|
|
1.5 |
|
|
|
JAN |
APR |
JUL |
OCT |
|
Range 13-17 |
|
2017 |
|
2018 |
|
5-year avg |
15 MARCH 2019 |
7 |