


vk.com/id446425943
Russia
•We expect GDP growth to slow to 1.5% in 2019 on the VAT hike; government-sponsored investments and a drop in inflation should help growth to rebound to 2.1% in 2020.
•Current account surplus will likely peak in Q1 2019, supporting the RUB in the early 2019.
We have lowered our GDP growth forecasts for 2018 and 2019 by 0.1pp to 1.6% and 1.5%, respectively, on the back of weaker-than-expected activity data for Q3 2018. Contrary to our forecast, growth in retail sales failed to accelerate much above 2%y/y, despite strong growth in real wages (7%y/y) generated by the preelection spending in early 2018 and the acceleration in bank lending to households. Next year, we expect real wage growth to be squeezed both by nominal wage growth decelerating back to single digits and by a pick-up in inflation. On the positive side, retirees should see real incomes rise slightly faster as the government has committed to raise pensions by 6-7% in the next three years regardless of inflation. We think the credit cycle is also about to peak, as interest rates started to rise and the CBR tightened the macroprudential screws on consumer lending. With the 2pp VAT hike to 20% from 1 January 2019 likely to shift some demand forward to Q4'18, we expect private consumption to slow to 1.7% in 2019 from 2.7% in 2018, before rebounding by 3.2%y/y in 2020.
Fixed investment growth has decelerated to 2.8%y/y in Q2'18 from 4.3% in 2017, and a fall in investment imports and weak construction data point to further deterioration in Q3. Although the rise in oil prices helped to lift company profits, tighter financial conditions and sanctions-related uncertainty will likely act as headwinds to investment in 2019. The President made infrastructure investment one of the priorities of the economic programme for 2019-24, but as the development and implementation of specific projects will likely take time, we pencil in a modest pick-up in investment growth to 3.5%y/y in 2020.
CPI inflation is on the rise after bottoming at 2.3%y/y in June, pushed up by food prices, weaker RUB and the approaching VAT hike. We expect headline inflation to peak around 5.7%y/y in mid-2019 before falling to 4.5%y/y by December 2019 and to 4% or slightly below in 2020. The VAT hike is likely to add c. 1pp to the headline inflation and c. 0.5pp to food inflation in 2019. Fuel prices are an additional upside risk, as the weaker oil-RUB correlation and government plans to gradually cut the export duties on oil have increased the sensitivity of domestic fuel prices to global oil price moves.
After a three-and-a-half-year rate-cutting cycle, the CBR was close to ending the rate cuts earlier this year, having taken the key rate close to the 6-7% neutral range. But two sell-offs (in April and in August-September) in Russian markets and the RUB, in combination with the inflation risks from food prices and the VAT increase, prompted the CBR to hike rates by 25bps to 7.5%, in addition to stopping FX purchases on behalf of the Finance Ministry. With a concentration of upside risks to inflation in the near term, and external risks to the RUB, the CBR policy in the coming months will likely remain reactionary. Although we think that the cyclical position of the economy does not warrant tighter monetary policy, we expect the CBR to hike one more time in December or early Q1, assuming inflation expectations follow inflation higher (October survey actually showed a decline). A larger rate move is possible if the external environment gets worse; if external risks subside, further tightening can be avoided. Once the effects of the VAT hike and
We expect the VAT hike to slow GDP growth to 1.5% in 2019 as already sluggish consumption decelerates further
Government plans to spend RUB 13 tn on "national projects" will likely take time to implement; we expect to see some pick-up in investment in 2020
Food prices, weaker RUB and a looming VAT hike should drive inflation above 5% in 2019, but in the absence of further shocks CPI should fall back to target in 2020
The CBR will likely hike by another 25bps but should be able to reduce rates back to 7.25% in 2020
EMEA Economic Perspectives 9 November 2018 |
14 |

vk.com/id446425943
other temporary factors start to subside, we expect the CBR to take the hikes back, cutting the key rate back to 7.25% in 2020.
A c. 35% rise in oil prices and fiscal consolidation catapulted the federal budget from a deficit of 1.5% of GDP in 2017 to a surplus of 1.7% in 2018 (UBSe). Assuming Brent prices average $74/bbl in 2019 and $72 in 2020, we forecast that the surplus will rise to 2.2% of GDP in 2019 and 1.7% in 2020. The VAT hike is the key revenue-raising measure, as neither the oil tax reform nor the increase in retirement age are likely to give a quick revenue boost. On the spending side, the budget allocates 1.6-1.8% of GDP per year to 12 "national projects" as part of the government plan to accelerate investment and lift GDP growth to 3%. However, at least for 2019-21, the resulting changes in expenditure structure are actually small. The plan to ramp up net domestic borrowing to RUB 1.7tn-1.8tn per year (from a reduced RUB 0.66tn in 2018) to finance an infrastructure upgrade while at the save time rebuilding the oil fund (NWF) can be hard to implement if the outflow of non-residents from the domestic bond market continues.
We think that in the absence of further geopolitical shocks the RUB will likely appreciate both versus the bi-currency basket and the USD in H1 2019, but will tend to weaken from mid-2019 and in 2020. Taking into account the UBS view of a weaker USD in 2019-2020, we forecast the RUBUSD at 61.0 and 63.0 for end2019 and -2020, respectively (implying a c. 6% depreciation vs bi-currency basket in 2020). With flattish oil prices, Russia's rapidly improving current account surplus will likely peak in Q1 2019 but remain large, declining from an estimated 6.8% of GDP in 2018 to 4.8% in 2020. The non-resident outflows from the government bond market have slowed but we would not expect significant inflows in 2019. Our strategists' BEER models shows the RUB as 10% undervalued, but in an environment of rising US yields and geopolitical risks it can stay undervalued.
The modalities of the CBR's FX purchases under the fiscal rule will remain an important factor for the RUB. The decision to put these on hold until end-2018 left about $7bn/month of current account inflows to absorb the pick-up in capital outflows. Our general assumption is that this joint Finance Ministry–CBR policy will continue to curb the appreciation potential of the RUB from higher oil prices in good times, but the CBR will be ready to reduce or pause buying FX on the market in case the RUB volatility jumps dramatically again (for non-oil-related reasons). We expect the CBR to resume market FX purchases for the Finance Ministry in January 2019 but without immediately trying to catch up for the pause in 2018; the decision will likely be announced around the 14 December rate meeting. We calculate that the CBR will need to buy $64.5bn in 2019 and $56bn in 2020; depending on the market conditions, some of the estimated $31.5bn the CBR will convert for the Finance Ministry off the market in 2018 can be added to these "regular" purchases as a catch-up. This should take the National Welfare Fund (NWF) from 3.8% of GDP in 2018 to 10.5% of GDP in 2020, including c. 9% of GDP in accounts in the CBR.
Geopolitical developments, particularly in US-Russia relations, remain an important risk to our forecasts. Several bills under consideration in the US Congress propose imposing more sanctions on Russia, including restrictions on one or more stateowned banks and newly issued sovereign debt. The US State Department also has confirmed that it must certify to the Congress by 6 November'18 whether Russia met the conditions in the US Chemical and Biological Weapons Act; a negative conclusion requires the State Department to impose a second round of sanctions after consultations with the Congress.
Federal budget likely to stay in surplus in 2019-2020 unless oil prices decline below $50/bbl
We expect the RUB to strengthen in H1 2019 as the current account surplus peaks but then start to depreciate
The CBR's FX purchases under the fiscal rule will likely continue to limit RUB appreciation potential from high oil prices
Geopolitics remains a risk to the economic outlook
EMEA Economic Perspectives 9 November 2018 |
15 |
vk.com/id446425943
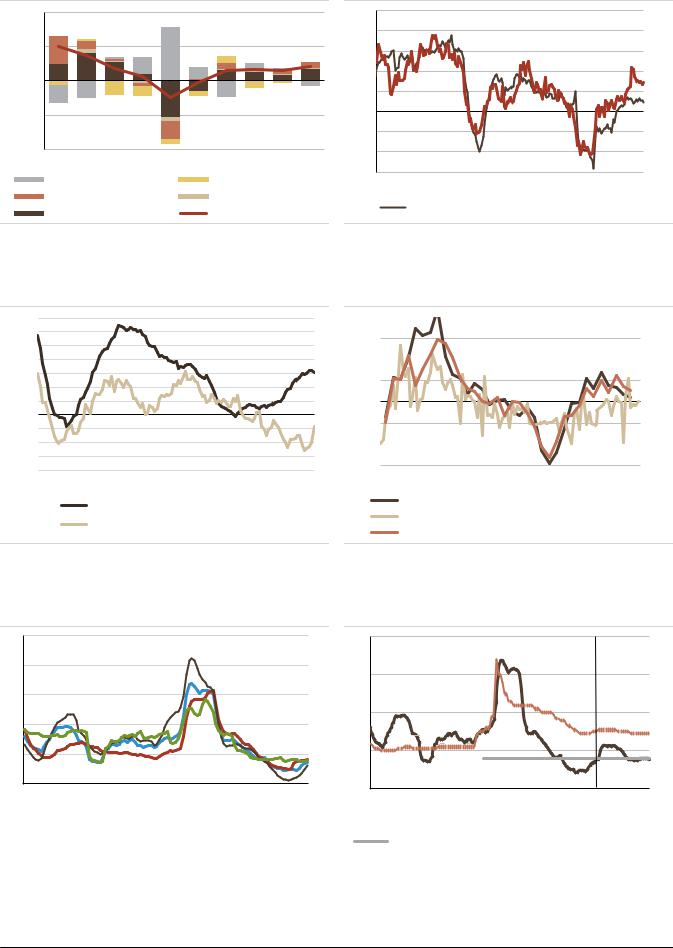
Figure 13: GDP growth by expenditure contributions |
Figure 14: Faster wage growth made no impact on sales |
10 |
Contribution to GDP growth, ppt |
25 |
|||||
|
20 |
||||||
|
|
|
|
|
|
|
|
5 |
|
|
|
|
|
|
15 |
|
|
|
|
|
|
|
|
0 |
|
|
|
|
|
|
10 |
|
|
|
|
|
|
5 |
|
|
|
|
|
|
|
|
|
(5) |
|
|
|
|
|
|
0 |
|
|
|
|
|
|
|
|
|
|
|
|
|
|
|
(5) |
(10) |
2012 |
2013 |
2014 |
2015 |
2016 |
2017 2018F 2019F 2020F |
(10) |
2011 |
(15) |
||||||
Net exports |
|
|
|
Stocks |
|||
|
|
|
|
||||
Gross Fixed capital formation |
Government consumption |
|
|||||
Private consumption |
|
|
GDP |
|
|||
|
% y/y |
|
|
|
|
|
|
|
|
|
|
|
|
|
04 |
05 |
06 |
07 |
08 |
09 |
10 |
11 |
12 |
13 |
14 |
15 |
16 |
17 |
18 |
Retail sales, %y/y |
|
Real wages, % y/y |
|
Source: Haver, UBS Source: Haver, UBS
Figure 15: RUB loans are replacing FX borrowing Figure 16: Fixed investment and construction
35
30 %y/y
25
20
15
10
5
0 -5 -10 -15 -20
Jan-09 Aug-10 Mar-12 Oct-13 May-15 Dec-16 Jul-18
Total RUB loans, %y/y
Total FX loans (adj for exchange rate), %y/y
20
15
10
5
0
(5)
(10)
(15)
Jan-10 Apr-11 Jul-12 Oct-13 Jan-15 Apr-16 Jul-17 Oct-18
Gross fixed capital formation (National Accounts) %yoy Construction work performed, % y/y
Fixed assets investment, %y/y
Source: CBR, Haver, UBS Source: Rosstat, Haver, UBS
Figure 17: Inflation by main components Figure 18: Inflation and CBR policy rate
25 |
|
20 |
|
|
|
|
|
|
|
|
%y/y |
|
|
|
|
|
|
|
|
UBS |
|
20 |
|
15 |
|
|
|
|
|
|
forecast |
|
|
|
|
|
|
|
|
|
|
||
15 |
|
|
|
|
|
|
|
|
|
|
10 |
|
10 |
|
|
|
|
|
|
|
|
|
|
|
|
|
|
|
|
|
||
5 |
|
5 |
|
|
|
|
|
|
|
|
|
|
|
|
|
|
|
|
|
||
0 |
|
0 |
|
|
|
|
|
|
|
|
Jan-10 Feb-11 Mar-12 Apr-13 May-14 Jun-15 |
Jul-16 Aug-17 Sep-18 |
|
|
|
|
|
|
|
||
Jan-10 |
Jul-11 |
Jan-13 |
Jul-14 |
Jan-16 |
Jul-17 |
Jan-19 |
Jul-20 |
|||
|
|
|
|
Total CPI |
|
Non-food |
|
Food ex fruit&veg |
|
Services |
|
|
CPI, %y/y |
|
Key Rate, % |
|
|
|
|
|
|
|
|
|
|||||||
|
|
|
|
|
|
|
CBR medium term target |
|
|
|||||
|
|
|
|
|
|
|
|
|
||||||
|
|
|
|
|
|
|
|
|
|
|
|
|
|
|
|
|
|
|
|
|
|
|
|
|
|
|
|
|
|
Source: RosStat, Haver |
|
|
|
|
|
|
Source: CBR, Haver, UBS |
|
|
|||||
EMEA Economic Perspectives 9 November 2018 |
16 |
vk.com/id446425943
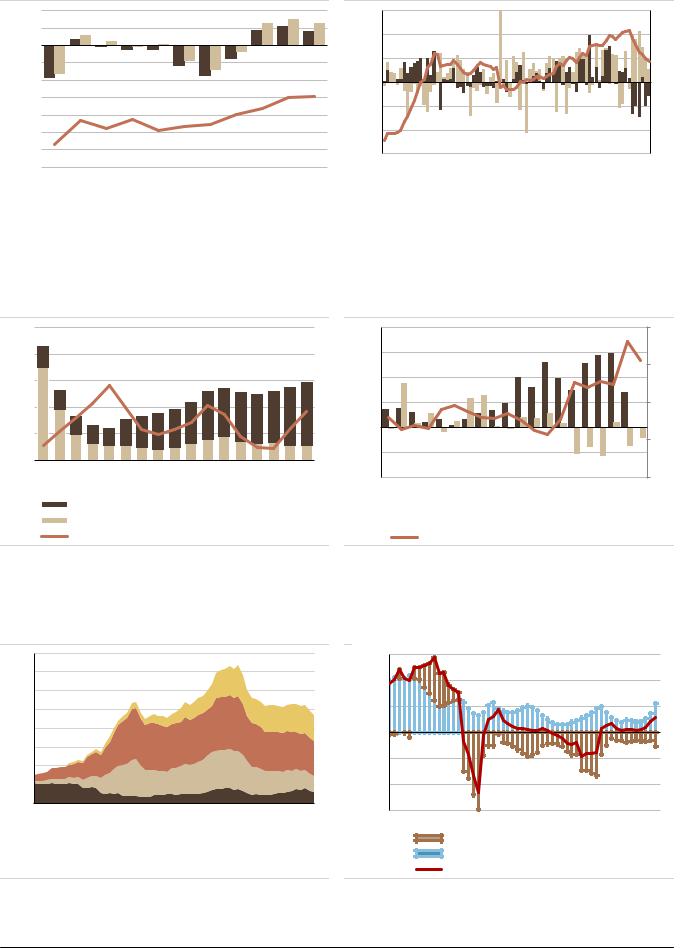
Figure 19: Federal budget moved back into surplus |
Figure 20: Locals step in to replace non-residents in OFZs |
4.0 |
% of GDP |
UBS forecast |
300 |
RUB bn |
|
|
|
% share |
40 |
|
2.0 |
|
|
|
|
|
|
||||
|
|
200 |
|
|
|
|
|
|
|
|
0.0 |
|
|
|
|
|
|
|
|
30 |
|
|
|
100 |
|
|
|
|
|
|
||
(2.0) |
|
|
|
|
|
|
|
|
|
|
|
|
|
|
|
|
|
|
|
|
|
(4.0) |
|
|
0 |
|
|
|
|
|
|
20 |
(6.0) |
|
|
(100) |
|
|
|
|
|
|
|
(8.0) |
|
|
|
|
|
|
|
|
10 |
|
|
|
|
|
|
|
|
|
|
||
|
|
|
(200) |
|
|
|
|
|
|
|
(10.0) |
|
|
|
|
|
|
|
|
|
|
(12.0) |
|
|
(300) |
|
|
|
|
|
|
0 |
|
|
|
|
|
|
|
|
|
||
(14.0) |
|
|
Jan-12 |
May-13 |
Sep-14 |
Jan-16 |
May-17 |
Sep-18 |
||
10 |
11 |
12 |
13 |
14 |
15 |
16 |
17 |
18F |
19F |
20F |
||||||
|
|
|
|
Federal budget balance, % GDP |
|
|
|
|
|
|
Change in domestic OFZ holdings, RUB bn |
|||||
|
|
|
|
|
|
|
|
|
|
|||||||
|
|
|
|
|
|
|
|
|
|
|||||||
|
|
|
|
Primary budget balance, % GDP |
|
|
|
|
|
Change in non-residents' OFZ holdings, RUB bn |
||||||
|
|
|
|
|
|
|
|
|
||||||||
|
|
|
|
|
|
|
|
|
||||||||
|
|
|
|
Non-oil balance, % GDP |
|
|
|
|
|
|
|
Russia: Nonresident Federal Loan Bonds [OFZ] Market Share, % |
||||
|
|
|
|
|
|
|
|
|
|
|
||||||
|
|
|
|
|
|
|
|
|
|
|
|
|||||
Source: Finance Ministry, State Duma, Haver, UBS |
|
|
|
|
|
|
Source: CBR, Haver, UBS |
|||||||||
Figure 21: Government debt vs savings in oil funds Figure 22: FX purchases under the fiscal rule
25 |
|
|
|
|
|
|
|
|
|
|
|
|
|
|
|
|
8.0 |
% of GDP |
|
|
|
|
|
|
|
|
|
|
|
|
|
|
|
||
20 |
|
|
|
|
|
|
|
|
|
|
|
|
|
|
|
|
6.0 |
15 |
|
|
|
|
|
|
|
|
|
|
|
|
|
|
|
|
4.0 |
|
|
|
|
|
|
|
|
|
|
|
|
|
|
|
|
|
|
10 |
|
|
|
|
|
|
|
|
|
|
|
|
|
|
|
|
2.0 |
|
|
|
|
|
|
|
|
|
|
|
|
|
|
|
|
|
|
5 |
|
|
|
|
|
|
|
|
|
|
|
|
|
|
|
|
0.0 |
|
|
|
|
|
|
|
|
|
|
|
|
|
|
|
|
|
|
0 |
|
|
|
|
|
|
|
|
|
|
|
|
|
|
|
|
-2.0 |
|
|
|
|
|
|
|
|
|
|
|
|
|
|
|
|
|
|
2004 |
2005 |
2006 |
2007 |
2008 |
2009 |
2010 |
2011 |
2012 |
2013 |
2014 |
2015 |
2016 |
2017 |
2018F |
2019F |
2020F |
-4.0 |
|
|||||||||||||||||
|
|
Domestic debt |
|
|
|
|
|
|
|
|
|
|
|
|
|||
|
|
External debt |
|
|
|
|
|
|
|
|
|
|
|
|
|||
|
|
Total oil funds, excl already invested part of NWF |
|
|
|||||||||||||
$ bn |
|
|
70 |
|
|
RUB/USD |
|
|
|
|
65 |
|
|
|
60 |
|
|
|
55 |
|
|
|
50 |
Feb-17 |
May-17 Aug-17 Nov-17 |
Feb-18 |
May-18 Aug-18 |
 MinFin FX purchases
 Change in non-resident RUB govt bond holdings RUB/USD, eop
Source: Ministry of Finance, Haver, UBS calculations |
Source: CBR, Haver, UBS |
Figure 23: All external debt build-up since the GFC is now gone
800 |
External debt, $bn |
|
|
|
|
|
|
|
|
|
|||||
700 |
|
|
|
|
|
|
|
|
|
||||||
|
|
|
|
|
|
|
|
|
|
|
|
|
|
|
|
600 |
|
|
|
|
|
|
|
|
|
|
|
|
|
|
|
500 |
|
|
|
|
|
|
|
|
|
|
|
|
|
|
|
400 |
|
|
|
|
|
|
|
|
|
|
|
|
|
|
|
300 |
|
|
|
|
|
|
|
|
|
|
|
|
|
|
|
200 |
|
|
|
|
|
|
|
|
|
|
|
|
|
|
|
100 |
|
|
|
|
|
|
|
|
|
|
|
|
|
|
|
0 |
|
|
|
|
|
|
|
|
|
|
|
|
|
|
|
02 |
03 |
04 |
05 |
06 |
07 |
08 |
09 |
10 |
11 |
12 |
13 |
14 |
15 |
16 |
17 |
 Debt to Direct investors
 Corporates, excl debt to direct investors, $bn
 Banks excl debt to direct investors, $bn
 Govt + CBR
Source: Haver, CBR, UBS
Figure 24: Current account surplus rising quickly
15 |
|
|
12m rolling, % of GDP |
|
|
|
|
|
|||||
|
|
|
|
|
|
|
|
||||||
10 |
|
|
|
|
|
|
|
|
|
|
|
|
|
5 |
|
|
|
|
|
|
|
|
|
|
|
|
|
0 |
|
|
|
|
|
|
|
|
|
|
|
|
|
(5) |
|
|
|
|
|
|
|
|
|
|
|
|
|
(10) |
|
|
|
|
|
|
|
|
|
|
|
|
|
(15) |
|
|
|
|
|
|
|
|
|
|
|
|
|
05 |
06 |
07 |
08 |
09 |
10 |
11 |
12 |
13 |
14 |
15 |
16 |
17 |
18 |
|
|
|
Net private capital flows, % GDP |
|
|
|
|||||||
|
|
|
C/A balance, % GDP |
|
|
|
|
|
|
||||
|
|
|
C/A + net private capital flow, %GDP |
|
|
||||||||
Source: CBR, Haver, UBS
EMEA Economic Perspectives 9 November 2018 |
17 |

vk.com/id446425943
Figure 25: RUSSIAN FEDERATION
|
2013 |
2014 |
2015 |
2016 |
2017 |
2018F |
2019F |
2020F |
|
|
|
|
|
|
|
|
|
Economic Activity and Employment |
|
|
|
|
|
|
|
|
GDP, local currency bn |
73134 |
79200 |
83387 |
86149 |
92037 |
100075 |
106126 |
112408 |
GDP, USD bn |
2297 |
2064 |
1368 |
1285 |
1578 |
1603 |
1749 |
1811 |
GDP per capita, USD |
15985 |
14106 |
9341 |
8752 |
10739 |
10913 |
11917 |
12334 |
Real GDP growth, % |
1.8 |
0.7 |
-2.5 |
-0.2 |
1.5 |
1.6 |
1.5 |
2.1 |
Private consumption, % y/y |
5.2 |
2.0 |
-9.4 |
-2.8 |
3.3 |
2.7 |
1.7 |
3.2 |
Government consumption, % y/y |
0.9 |
0.4 |
-3.1 |
0.9 |
0.4 |
0.5 |
0.8 |
0.8 |
Gross Fixed Capital formation, % y/y |
1.3 |
-0.6 |
-11.2 |
0.8 |
4.3 |
1.5 |
2.5 |
3.5 |
Exports, % y/y |
4.6 |
0.5 |
3.7 |
3.2 |
5.1 |
5.3 |
5.9 |
3.6 |
Imports, % y/y |
3.5 |
-7.3 |
-25.1 |
-3.6 |
17.4 |
3.3 |
6.1 |
6.7 |
Unemployment rate, % (avg) |
5.5 |
5.2 |
5.6 |
5.5 |
5.2 |
4.8 |
4.8 |
4.6 |
Industrial Production (%) |
1.8 |
2.4 |
-0.8 |
2.2 |
2.1 |
2.7 |
1.6 |
2.3 |
Prices, interest rates and money |
|
|
|
|
|
|
|
|
CPI inflation, % y/y (average) |
6.8 |
7.8 |
15.5 |
7.0 |
3.7 |
2.9 |
5.4 |
3.9 |
CPI inflation, % y/y (year-end) |
6.5 |
11.4 |
12.9 |
5.4 |
2.5 |
3.9 |
4.5 |
3.9 |
Broad money M2, % y/y (end-year) |
14.7 |
1.5 |
11.3 |
9.2 |
10.5 |
11.6 |
8.0 |
11.7 |
Domestic private credit, % y/y |
18.7 |
27.3 |
8.1 |
-4.4 |
3.9 |
13.0 |
7.8 |
7.8 |
Domestic bank credit/GDP |
48.2 |
56.7 |
58.2 |
53.8 |
52.4 |
54.4 |
55.2 |
56.3 |
Policy rate 1w repo/depo, % (end-year) |
5.5 |
17.0 |
11.0 |
10.0 |
7.75 |
7.75 |
7.50 |
7.25 |
10 year bond yield, % (year-end) |
8.0 |
13.2 |
9.6 |
8.5 |
7.6 |
8.5 |
8.75 |
8.25 |
RUB/USD (year-end) |
32.7 |
56.3 |
72.9 |
60.7 |
57.6 |
64.5 |
61.0 |
63.0 |
RUB/EUR (year-end) |
45.1 |
68.3 |
79.4 |
63.7 |
68.2 |
74.8 |
75.0 |
81.9 |
Fiscal accounts |
|
|
|
|
|
|
|
|
Federal government budget balance, % GDP* |
-0.4 |
-0.4 |
-2.4 |
-3.4 |
-1.5 |
1.7 |
2.2 |
1.7 |
Revenue, % GDP |
17.8 |
18.3 |
16.4 |
15.6 |
16.4 |
18.9 |
19.2 |
18.6 |
Expenditure, % GDP |
18.2 |
18.7 |
18.8 |
19.1 |
17.8 |
17.2 |
17.0 |
16.9 |
of which interest expenditure, % GDP |
0.5 |
0.5 |
0.6 |
0.7 |
0.7 |
0.8 |
0.8 |
0.9 |
Primary balance, % GDP |
0.0 |
0.1 |
-1.7 |
-2.7 |
-0.7 |
2.5 |
3.0 |
2.5 |
Public sector debt (gross),% GDP** |
11.1 |
13.2 |
13.6 |
12.9 |
12.6 |
13.0 |
13.8 |
14.8 |
of which domestic public debt, % GDP |
8.1 |
9.3 |
9.1 |
9.3 |
9.4 |
9.7 |
11.0 |
12.1 |
of which external public debt,% GDP |
3.1 |
3.9 |
4.5 |
3.6 |
3.1 |
3.3 |
2.8 |
2.7 |
% domestic public debt held by non-residents |
23.9 |
18.7 |
21.5 |
26.9 |
33.1 |
24.0 |
23.0 |
23.0 |
Public debt held by the central bank, % GDP |
0.5 |
0.5 |
0.6 |
0.4 |
0.3 |
0.19 |
0.15 |
0.14 |
Balance of payments |
|
|
|
|
|
|
|
|
Trade balance, USD bn |
180.6 |
188.9 |
148.4 |
90.2 |
115.4 |
193.7 |
193.9 |
178.5 |
Exports, USD bn |
521.8 |
496.8 |
341.4 |
281.7 |
353.5 |
443.8 |
470.3 |
470.0 |
Imports, USD bn |
341.3 |
307.9 |
193.0 |
191.5 |
238.1 |
250.1 |
276.4 |
291.5 |
Current account balance, USD bn |
33.4 |
57.5 |
67.8 |
24.5 |
33.3 |
108.4 |
104.0 |
86.4 |
as % of GDP |
1.5 |
2.8 |
5.0 |
1.9 |
2.1 |
6.8 |
5.9 |
4.8 |
Foreign direct investment (net), USD bn |
-17.3 |
-35.1 |
-15.2 |
10.2 |
-8.2 |
-14.0 |
-10.0 |
-10.0 |
Total FX reserves, USD bn |
509.6 |
385.5 |
368.4 |
377.7 |
432.7 |
462.0 |
558.3 |
631.4 |
Foreign exchange reserves excl gold, USD bn |
469.6 |
339.4 |
319.8 |
317.5 |
356.1 |
385.0 |
465.3 |
526.2 |
Total FX reserves, % GDP |
22.2 |
18.7 |
26.9 |
29.4 |
27.4 |
28.8 |
31.9 |
34.9 |
Total external debt, % GDP |
31.7 |
29.1 |
37.9 |
39.8 |
32.8 |
28.7 |
26.9 |
26.5 |
Net International Investment Position, % GDP |
5.7 |
15.0 |
24.2 |
16.4 |
17.2 |
25.4 |
34.4 |
42.2 |
Credit ratings |
|
|
|
|
|
|
|
|
Moody's |
Baa1 |
Baa2 (n) |
Ba1 (st) |
Ba1 (n) |
Ba1 (p) |
Ba1 (p) |
n/a |
n/a |
S&P |
BBB |
BBB- (n) |
BB+ (n) |
BB+ (st) |
BB+ (p) |
BBB- (st) |
n/a |
n/a |
Fitch |
BBB |
BBB (n) |
BBB- (n) |
BBB- (st) |
BBB- (p) |
BBB- (p) |
n/a |
n/a |
Source: Rosstat, CBR, Finance Ministry, Haver, UBS estimates, Bloomberg. *Federal budget. **Public sector debt includes state debt and state guarantees, does not include SOE debt.
EMEA Economic Perspectives 9 November 2018 |
18 |