


vk.com/id446425943
South Africa
•We now see GDP growth modestly accelerating from 0.5% in 2018 to 1.5% in 2019 and 2.1% in 2020. We believe that the government's recent policy efforts and investment drive should bring some growth benefit in the next two years.
•We see the SARB raising rates to 7.25% by end-2020. Fiscal and external imbalances could deteriorate slightly in 2019-20.
We believe that South African GDP growth could re-accelerate in the coming years as some of the government sectoral reform efforts (mining charter, withdrawal of the Mineral and Petroleum Resources Development Act (MPRDA), spectrum allocation, governance changes at SoEs) and its investment and jobs drive should start to yield results. However, we remain cautious about the rebound potential of the South African economy on three grounds. First, the global macro backdrop is likely to remain challenging – in particular most of UBS' risk scenarios are consistent with pressure on EM FX (because of implications for CNY and China). Second, the adherence to the Medium-Term Budget Policy Statement's fiscal targets and debt trajectory would limit any scope for a government-led investment stimulus. Third, some of the structural problems of South Africa require a longer time to be addressed: skill shortages, education and infrastructure upgrades. Thus we expect GDP growth to pick up from 0.5% in 2018 (previously 0.7%) to 1.5% in 2019 (previously 1.9%) and 2.1% in 2020. The 2019 downward revision in part reflects the carry-over from the 2018 GDP revision.
High-frequency indicators suggest that the economy is likely to escape another contraction in Q3-2018, mainly due to the rebound in manufacturing, car and retail sales. Agriculture output has also probably recovered as Q2 softness was influenced by the late start of harvest. In our calculation, GDP should grow by c1.2% q/q annualized, following -2.6% and -0.7% q/q annualized contractions in Q1/Q2-18. Given that there was another soft PMI print in October and vehicle sales were only up marginally in the same month, we now believe that 2018 fullyear growth is more likely to be around 0.5%.
We do not believe that the past rules about a typical recovery phase can be applied for 2019-20: in the past exports were leading the recovery in South Africa, followed by consumption, and investments came with a significant lag.
While exports might have some upside from the revival of Africa — accounting for more than 25% of exports — and the Chinese stimulus measures, we find it difficult to believe that exports could grow faster than 3-4% in the next two years, with a 35-45bps maximum GDP upside versus 2018 (from the contribution of net exports).
We believe consumption has also few levers to pull to boost GDP growth. Limited gains in disposable income (wage growth is gradually slowing, employment growth is lacklustre and inflation should be largely flat at around 5%) should constrain consumption growth to 1.5-2%. As we argued recently, wealth effects are also not helpful, mainly with housing prices remaining under pressure.
This leaves us with investments to do the heavy lifting (80bps upside in GDP from 2018 to 2020 — i.e. accounting for half of the GDP acceleration). We project fixed capital formation growth to pick up from 0.5% in 2018 to 2.0% in 2019 and to 4.5% in 2020.
GDP growth to re-accelerate to 2.1% in 2020 from 0.5% in 2018. Faster rebound is restricted by the global backdrop, adherence to fiscal targets and by structural problems
The economy to escape contraction in Q3-18: we project 1.2% q/q annualized pick-up
We think this time exports cannot lead the recovery; investments need to rebound
Consumption gains limited by disposable income trends
EMEA Economic Perspectives 9 November 2018 |
24 |

vk.com/id446425943
What are the possible drivers of investments — i.e. the funding and triggers? There are four sources for accelerated investment: a) companies' own cash reserves (previous studies put the cash on the balance sheet of JSE's biggest companies well north of ZAR 1tn or 20% of GDP); b) FDI — here the government's drive to attract USD 100bn in investors matters with USD 35bn commitments secured from Saudi Arabia, UAE and China; c) infrastructure investment: the MTBPS envisages a combined ZAR 855bn spent on infrastructure in 2019-21, out of which stateowned companies account for R370.2 billion and the government for the rest; and d) a pick-up in corporate lending — we are witnessing a higher momentum in investment loan growth (2018 YTD: 20.3% y/y vs 12% in 2017 and 9.7% in 2016). As regards to the triggers, a revival of business confidence would help (yet to happen), and a more predictable regulatory environment (which is happening with the sectoral legislations) should also be supportive.
We expect the ZAR at 15.25 versus USD by both end-2019 and end-2020. The main reasons for us to expect some modest depreciation are: a) the expected weakening of the CNY in the coming years, which normally has a feedback loop on the ZAR (Asia accounts for a third of South Africa's exports); b) some widening in the current account balance from -3.2% of GDP in 2018 to -3.9% of GDP in 2020; and c) potential for portfolio outflows at times of rising global yields — though here foreign positioning on the local currency bond market has also eased somewhat to 39.4% (yet still higher than the 37% level of the average of the last five years). The currency is unlikely to be much impacted by our forecasted changes in global commodity prices (we see help from gold and platinum prices in 201920, with some drag from coal and iron ore). On the positive side, the fact that we expect the SARB to raise rates and that UBS expects the EUR to appreciate vs the USD should cap the pressure on the Rand.
Inflation was at 5.1% y/y in September – in the upper half of the SARB's 3-6% target range. Core inflation remained relatively subdued at 4.2%. We see CPI accelerating somewhat to 5.8% in Q1-19 on base effects in food inflation (spillover from the record harvest in 2017), but then we project inflation easing off towards 5% by end-2019. In 2020, CPI should stay marginally below 5% throughout the year. Food inflation is stuck at low levels recently, and although it is likely to pick up from here, the increase should be mitigated by decent grain inventories. Fuel inflation should decline from the current c20% y/y levels: it is not only because of UBS' call of essentially flat oil prices, but also because the 2018 increase in fuel excises might not be repeated in 2019-2020. FX pass-through has been much weaker than previously, so our forecast of a weaker ZAR is unlikely to generate much inflation. The real risk to inflation is Eskom's electricity price hikes in 2019-20, which could well exceed the 8% approved level. Eskom is asking for 15% each year during 2019-21 (this could be an upside risk to inflation by around 30-40bps each year). Due to our inflation profile and the upside skew in inflation risks mainly from the currency and energy prices, we continue to believe that the SARB will raise rates by 25bps in November 2018, then again in Q1 2019 and finally then around the turn of 2019/2020 — taking the policy rate to 7.25%.
Finally, we think it is crucial that South Africa sticks to the fiscal framework set in the October MTPBS, in particular to maintain the expenditure ceiling and to limit the government's contingent liabilities. State guarantees amount to ZAR 670bn or 13% of GDP, out of which Eskom is granted ZAR 350bn. By June 2018, half of the guarantees were called (ZAR 334.2bn). Curbing the expansion of these is critical if South Africa wants to stabilize the gross debt stock just below 60% by 2023/24.
What are the sources and triggers for investments?
We expect the ZAR at 15.25 versus USD by both end-2019 and end-2020 – implying modest weakening from current levels
We believe SARB should raise rates by 25bps in November 2018, then again in Q1 2019, and finally then around the turn of 2019/2020 — taking the policy rate to 7.25%
Adherence to fiscal targets is key
EMEA Economic Perspectives 9 November 2018 |
25 |
vk.com/id446425943
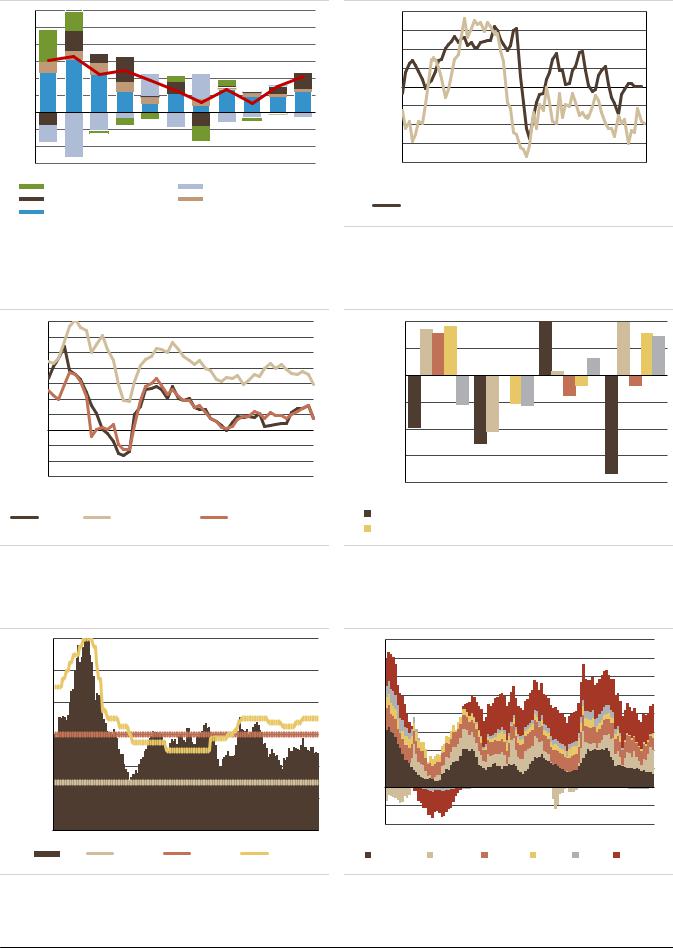
Figure 39: GDP growth and contributions
6.0 |
|
|
|
|
|
5.0 |
|
|
|
|
|
4.0 |
|
|
|
|
|
3.0 |
|
|
|
|
|
2.0 |
|
|
|
|
|
1.0 |
|
|
|
|
|
0.0 |
|
|
|
|
|
(1.0) |
|
|
|
|
|
(2.0) |
|
|
|
|
|
(3.0) |
|
|
|
|
|
2010 |
2012 |
2014 |
2016 |
2018E |
2020F |
Inventories & stat discr. |
Net exports |
|
|||
Capital formation |
|
Government consumption |
Private consumption |
|
GDP |
|
||
|
|
|
Source: StatsSA, Haver, UBS |
|
|
Figure 40: Fixed investments and confidence (BCI)
20.0 |
|
|
|
|
|
90 |
15.0 |
|
|
|
|
|
80 |
10.0 |
|
|
|
|
|
70 |
|
|
|
|
|
|
|
5.0 |
|
|
|
|
|
60 |
0.0 |
|
|
|
|
|
|
|
|
|
|
|
50 |
|
-5.0 |
|
|
|
|
|
|
|
|
|
|
|
|
|
-10.0 |
|
|
|
|
|
40 |
|
|
|
|
|
|
|
-15.0 |
|
|
|
|
|
30 |
-20.0 |
|
|
|
|
|
20 |
Q1- |
Q1- |
Q1- |
Q1- |
Q1- |
Q1- |
Q1- |
2000 |
2003 |
2006 |
2009 |
2012 |
2015 |
2018 |
Private investments, % y/y |
|
Business confidence, r.s. |
|
Source: StatsSA, BER, Haver, UBS
Figure 41: Disposable income and consumption, % y/y |
Figure 42: Q3-2018 high frequency indicators, % q/q |
14.0 |
|
|
|
|
|
2.0% |
|
12.0 |
|
|
|
|
|
1.0% |
|
10.0 |
|
|
|
|
|
||
8.0 |
|
|
|
|
|
0.0% |
|
6.0 |
|
|
|
|
|
||
|
|
|
|
|
|
||
4.0 |
|
|
|
|
|
-1.0% |
|
2.0 |
|
|
|
|
|
|
|
0.0 |
|
|
|
|
|
-2.0% |
|
(2.0) |
|
|
|
|
|
-3.0% |
|
(4.0) |
|
|
|
|
|
||
|
|
|
|
|
|
||
(6.0) |
|
|
|
|
|
-4.0% |
|
Q1-06 |
Q1-08 |
Q1-10 |
Q1-12 |
Q1-14 |
Q1-16 Q1-18 |
||
Q4-17 |
|||||||
|
|
|
|
|
|
||
PCE, real |
Disposable Income |
Disposable Income, real |
Mining |
||||
Retail sales |
|||||||
|
|
|
|
|
|
||
Q1-18 Q2-18 Q3-18
 Manufacturing
  Electricity
  Vehicle sales
Source: StatsSA, Haver, UBS |
Source: StatsSA, Haver, UBS |
Figure 43: Inflation and policy rate, %
12.0% |
|
|
|
10.0% |
|
|
|
8.0% |
|
|
|
6.0% |
|
|
|
4.0% |
|
|
|
2.0% |
|
|
|
0.0% |
|
|
|
Jan-07 Jan-09 Jan-11 |
Jan-13 Jan-15 |
Jan-17 Jan-19 |
|
CPI |
3% limit |
6% limit |
Repo rate |
Figure 44: Contributions to headline inflation, y/y
8.0% |
|
|
|
|
7.0% |
|
|
|
|
6.0% |
|
|
|
|
5.0% |
|
|
|
|
4.0% |
|
|
|
|
3.0% |
|
|
|
|
2.0% |
|
|
|
|
1.0% |
|
|
|
|
0.0% |
|
|
|
|
-1.0% |
|
|
|
|
-2.0% |
|
|
|
|
Jan-09 |
Jan-11 |
Jan-13 |
Jan-15 |
Jan-17 |
FNAB, A&T |
Transport |
Housing |
Energy |
Goods Services |
Source: StatsSA, SARB, Haver, UBS |
Source: StatsSA, Haver, UBS |
EMEA Economic Perspectives 9 November 2018 |
26 |
vk.com/id446425943
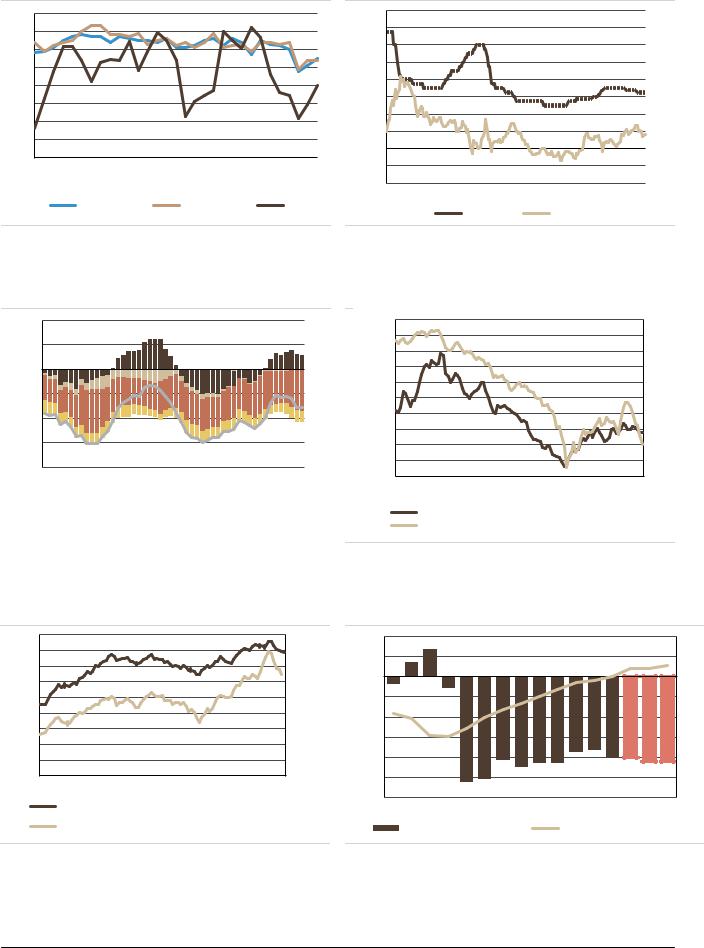
Figure 45: Inflation expectations, %*
7.0 |
|
|
|
|
|
|
|
6.5 |
|
|
|
|
|
|
|
6.0 |
|
|
|
|
|
|
|
5.5 |
|
|
|
|
|
|
|
5.0 |
|
|
|
|
|
|
|
4.5 |
|
|
|
|
|
|
|
4.0 |
|
|
|
|
|
|
|
3.5 |
|
|
|
|
|
|
|
3.0 |
|
|
|
|
|
|
|
Q1- |
Q1- |
Q1- |
Q1- |
Q1- |
Q1- |
Q1- |
Q1- |
2011 |
2012 |
2013 |
2014 |
2015 |
2016 |
2017 |
2018 |
|
One-year out |
Two-year out |
|
CPI |
|||
Source: BER, Haver, UBS *Average of businesses and unions.
Figure 46: Real rate, %
16.00 |
|
14.00 |
|
12.00 |
|
10.00 |
|
8.00 |
|
6.00 |
|
4.00 |
|
2.00 |
|
0.00 |
|
(2.00) |
|
(4.00) |
|
2003-Jan 2006-Jan 2009-Jan 2012-Jan 2015-Jan 2018-Jan |
|
Policy rate |
Real rate |
Source: SARB, Haver, UBS
Figure 47: External balance, % of GDP
4.0 |
|
|
|
|
|
|
2.0 |
|
|
|
|
|
|
0.0 |
|
|
|
|
|
|
(2.0) |
|
|
|
|
|
|
(4.0) |
|
|
|
|
|
|
(6.0) |
|
|
|
|
|
|
(8.0) |
|
|
|
|
|
|
Q1-06 |
Q1-08 |
Q1-10 |
Q1-12 |
Q1-14 |
Q1-16 |
Q1-18 |
|
|
Net exports |
|
Net services |
|
|
|
||
|
|
|
||
|
|
Net income |
|
Current transfers |
|
|
|
||
|
|
|
||
|
|
Current account, % GDP |
|
|
|
|
|
|
|
|
|
|
|
|
Source: SARB, Haver, UBS |
|
|
||
Figure 48: ZAR and commodity prices*
300.0 |
|
6.0 |
280.0 |
|
7.0 |
260.0 |
|
8.0 |
240.0 |
|
9.0 |
|
10.0 |
|
220.0 |
|
|
|
11.0 |
|
200.0 |
|
|
|
12.0 |
|
180.0 |
|
|
|
13.0 |
|
160.0 |
|
|
|
14.0 |
|
140.0 |
|
|
|
15.0 |
|
120.0 |
|
16.0 |
100.0 |
|
17.0 |
Jan- |
JanJan- JanJan- Jan- |
JanJan- Jan- |
2010 2011 2012 2013 2014 2015 2016 2017 2018 |
||
|
Average price index |
|
South Africa: Exchange Rate: U.S. (Avg, Rand/US$)
Source: Haver, UBS *Average of gold, platinum, coal and iron ore.
49: Foreign ownership of ZAR government bonds |
Figure 50: Budget balance and public debt, % of GDP |
45.0 |
|
|
80,000 |
2.0 |
|
|
|
|
|
|
70 |
|
40.0 |
|
|
70,000 |
1.0 |
|
|
|
|
|
|
60 |
|
35.0 |
|
|
60,000 |
|
|
|
|
|
|
|||
|
|
0.0 |
|
|
|
|
|
|
|
|||
30.0 |
|
|
|
|
|
|
|
|
|
|||
|
|
50,000 |
|
|
|
|
|
|
50 |
|||
|
|
|
|
|
|
|
|
|
||||
25.0 |
|
|
(1.0) |
|
|
|
|
|
|
|
||
|
|
40,000 |
|
|
|
|
|
|
40 |
|||
20.0 |
|
|
(2.0) |
|
|
|
|
|
|
|||
|
|
30,000 |
|
|
|
|
|
|
|
|||
15.0 |
|
|
|
|
|
|
|
|
30 |
|||
|
|
|
|
|
|
|
|
|
||||
|
|
20,000 |
(3.0) |
|
|
|
|
|
|
|||
10.0 |
|
|
|
|
|
|
|
|
|
|||
|
|
|
|
|
|
|
|
|
20 |
|||
|
|
|
|
|
|
|
|
|
|
|||
5.0 |
|
|
10,000 |
(4.0) |
|
|
|
|
|
|
||
|
|
|
|
|
|
|
|
|
||||
0.0 |
|
|
0 |
(5.0) |
|
|
|
|
|
|
10 |
|
Jan-2011 |
Jan-2013 |
Jan-2015 |
Jan-2017 |
(6.0) |
|
|
|
|
|
|
0 |
|
Foreign ownership of ZAR-denom govt bonds, % of total |
|
|
|
|
|
|
||||||
2005 |
2007 |
2009 |
2011 |
2013 |
2015 |
2017 |
2019F |
|||||
|
|
|
|
|||||||||
Foreign holding in USD mn, r.s. |
|
Budget balance, % of GDP |
|
Public debt, % of GDP, r.s. |
||||||||
Source: Haver, UBS |
Source: National Treasury, Haver, UBS |
EMEA Economic Perspectives 9 November 2018 |
27 |

vk.com/id446425943
Figure 51: SOUTH AFRICA
|
2013 |
2014 |
2015 |
2016 |
2017 |
2018E |
2019F |
2020F |
|
|
|
|
|
|
|
|
|
Economic Activity and Employment |
|
|
|
|
|
|
|
|
GDP, local currency bn |
3540 |
3805 |
4051 |
4350 |
4652 |
4895 |
5222 |
5587 |
GDP, USD bn |
367 |
351 |
318 |
296 |
349 |
374 |
351 |
366 |
GDP per capita, USD |
6913 |
6510 |
5824 |
5337 |
6179 |
6507 |
6018 |
6182 |
Real GDP growth, % |
2.5 |
1.8 |
1.3 |
0.6 |
1.3 |
0.5 |
1.5 |
2.1 |
Private consumption, % y/y |
2.0 |
0.8 |
1.8 |
0.7 |
2.2 |
1.5 |
1.5 |
2.0 |
Government consumption, % y/y |
3.1 |
1.7 |
-0.3 |
1.9 |
0.6 |
1.0 |
1.0 |
1.0 |
Gross Fixed Capital formation, % y/y |
7.2 |
0.7 |
3.4 |
-4.1 |
0.4 |
0.5 |
2.0 |
4.5 |
Exports, % y/y |
4.0 |
3.6 |
2.8 |
1.0 |
-0.1 |
1.0 |
4.0 |
3.0 |
Imports, % y/y |
5.0 |
-0.6 |
5.4 |
-3.8 |
1.9 |
2.0 |
3.5 |
4.0 |
Unemployment rate, % (average) |
24.7 |
25.1 |
25.4 |
26.7 |
27.5 |
27.3 |
27.8 |
28.2 |
Industrial Production (%) |
1.5 |
0.3 |
-0.2 |
0.7 |
-0.4 |
1.5 |
2.5 |
2.0 |
Prices, interest rates and money |
|
|
|
|
|
|
|
|
CPI inflation, % y/y (average) |
5.8 |
6.1 |
4.6 |
6.3 |
5.3 |
4.7 |
5.1 |
4.8 |
CPI inflation, % y/y (year-end) |
5.4 |
5.3 |
5.2 |
6.7 |
4.7 |
5.1 |
4.8 |
4.8 |
Broad money M2, % y/y (end-year) |
9.7 |
8.6 |
9.6 |
6.6 |
7.9 |
7.0 |
7.0 |
7.0 |
Domestic private credit, % y/y |
6.3 |
8.6 |
10.2 |
5.1 |
6.7 |
6.5 |
8.0 |
10.0 |
Domestic bank credit/GDP |
73.4 |
74.0 |
76.6 |
75.2 |
75.1 |
76.0 |
76.9 |
79.1 |
Policy rate, % (end-year) |
5.0 |
5.8 |
6.3 |
7.0 |
6.8 |
6.8 |
7.0 |
7.3 |
10 year bond yield, % (year-end) |
8.2 |
8.0 |
9.7 |
9.0 |
8.6 |
9.2 |
9.5 |
9.3 |
USD/ZAR (year-end) |
10.5 |
11.6 |
15.6 |
13.7 |
12.7 |
14.5 |
15.3 |
15.3 |
EUR/ZAR (year-end) |
14.4 |
14.1 |
17.0 |
0.0 |
14.3 |
17.2 |
18.2 |
19.3 |
Fiscal accounts |
|
|
|
|
|
|
|
|
General government budget balance, % GDP |
-4.3 |
-4.3 |
-3.7 |
-3.6 |
-4.0 |
-4.0 |
-4.2 |
-4.2 |
Revenue, % GDP |
27.3 |
27.6 |
28.1 |
28.6 |
28.3 |
28.5 |
29.0 |
29.0 |
Expenditure, % GDP |
31.6 |
31.9 |
31.8 |
32.2 |
32.3 |
32.5 |
33.2 |
33.2 |
of which interest expenditure, % GDP |
2.9 |
3.1 |
3.3 |
3.4 |
3.6 |
3.7 |
3.8 |
3.9 |
Primary balance, % GDP |
-1.4 |
-1.2 |
-0.4 |
-0.2 |
-0.4 |
-0.3 |
-0.4 |
-0.3 |
Public sector debt (gross),% GDP |
44.1 |
46.8 |
50.0 |
51.0 |
52.7 |
55.8 |
56.1 |
57.4 |
of which domestic public debt, % GDP |
40.1 |
42.4 |
45.3 |
45.9 |
48.0 |
49.3 |
50.6 |
51.7 |
of which external public debt,% GDP |
4.0 |
4.4 |
4.8 |
5.1 |
4.7 |
6.5 |
5.5 |
5.7 |
% domestic public debt held by non-residents |
36.4 |
36.0 |
32.4 |
36.0 |
41.4 |
38.5 |
36.0 |
37.0 |
Public debt held by the central bank, % GDP |
0.2 |
0.2 |
0.2 |
0.2 |
0.2 |
0.2 |
0.2 |
0.2 |
Balance of payments |
|
|
|
|
|
|
|
|
Trade balance, USD bn |
-7.2 |
-5.1 |
-3.6 |
2.4 |
5.2 |
3.1 |
2.5 |
1.8 |
Exports, USD bn |
96.8 |
93.6 |
80.8 |
76.4 |
88.2 |
87.0 |
91.8 |
96.5 |
Imports, USD bn |
104.0 |
98.6 |
84.4 |
74.1 |
83.0 |
83.9 |
89.2 |
94.7 |
Current account balance, USD bn |
-21.2 |
-17.8 |
-14.6 |
-8.2 |
-8.6 |
-11.9 |
-12.7 |
-14.2 |
as % of GDP |
-5.8 |
-5.1 |
-4.6 |
-2.8 |
-2.5 |
-3.2 |
-3.6 |
-3.9 |
Foreign direct investment (net), USD bn |
1.7 |
-1.9 |
-4.0 |
-2.2 |
-6.0 |
-2.0 |
-1.0 |
0.0 |
Total FX reserves, USD bn |
49.6 |
49.1 |
45.8 |
47.4 |
50.7 |
50.5 |
50.5 |
50.5 |
Foreign exchange reserves excl gold, USD bn |
44.8 |
44.3 |
41.5 |
42.7 |
45.5 |
45.7 |
45.7 |
45.7 |
Total FX reserves, % GDP |
13.5 |
14.0 |
14.4 |
16.0 |
14.5 |
13.5 |
14.4 |
13.8 |
Total external debt, % GDP |
37.2 |
41.3 |
39.0 |
48.2 |
49.6 |
50.0 |
50.5 |
51.0 |
Net International Investment Position, % GDP |
-4.5 |
-7.9 |
15.7 |
3.6 |
14.0 |
5.0 |
4.5 |
4.0 |
Credit ratings |
|
|
|
|
|
|
|
|
Moody's |
Baa1 |
Baa2 |
Baa2 |
Baa2 |
Baa3 |
Baa3 (sta) |
n/a |
n/a |
S&P |
BBB |
BBB- |
BBB- |
BBB- |
BB |
BB (sta) |
n/a |
n/a |
Fitch |
BBB |
BBB |
BBB- |
BBB- |
BB+ |
BB+ (sta) |
n/a |
n/a |
Source: StatsSA, SARB, National Treasury, IMF, Haver, UBS estimates
EMEA Economic Perspectives 9 November 2018 |
28 |