


vk.com/id446425943
Greece
•We expect Greek GDP growth to accelerate from 2.0% in 2018 to 2.4% in 2019 and 2.9% in 2020. GDP growth should be driven by some acceleration in private consumption and fixed capital formation.
•Greece's excellent fiscal track record should help to meet the postprogram commitments.
Greece's economic performance came in somewhat weaker in 2018 than what was implied by the rebound in soft indicators. Growth only averaged 2.2% y/y in H1 2018, dragged down by a -7.6% y/y drop in investment spending. In q/q terms the economy barely grew in Q2-2018 (0.2% q/q), which makes it unlikely that the economy could expand faster than 2% this year. At the same time, economic confidence averaged at 103 and PMI at 54.1 in January-October 2018 – these are best results since 2007 and 2000, respectively, and would historically be consistent with a much stronger expansion of economic activity (3-6%).
We now project GDP growth to pick up to 2.4% in 2019 and 2.9% in 2020. The projection rests on two assumptions. First, household consumption could grow around 2-3% in the next two years – propelled higher by rising employment (and falling unemployment), a pick-up in nominal wage growth, and improving sentiment. Second, fixed investment spending could rebound by 9-9.5% in 201920, driven by improving business sentiment, a pick-up in EU fund absorption (Greece so far has only spent 19% or EUR 5.1bn worth of EU funds out of its total allocation of EUR 26.7bn in the 2014-2020 framework), some privatization activity (EUR 0.5-1bn per annum), and potentially FDI inflows (EUR 3.5-4bn).
Compared to our earlier expectations, the clearance of arrears could take longer, and thus could hold back some fresh cash from the private sector (arrears were still at EUR 2.6bn in September, only 20% down vs end-2017). Tourism could also remain supportive for GDP, but given the record high revenues in 2018 (EUR 16bn or c9% of GDP, 12m rolling) it is going to be difficult to have a similar scale of improvement. Our growth forecasts are more optimistic than the consensus estimates of 1.9% and 1.8%, respectively.
Greece is on track to exceed the 3.5%-of-GDP primary surplus target in 2018 (4% of GDP, in our view): in January-September the State Budget posted a primary surplus of EUR 4.8bn – which is EUR 2.3bn higher than the targeted level and also exceeds last year's surplus levels. 75% of the outperformance comes from lower spending (Public Investment Budget expenditures, military procurement, and agricultural subsidies). Greece had the first post-programme ESM mission in midSeptember with the first quarterly enhanced report being issued in November. The next key policy focus is the 2019 draft Budget plan. Here the discussion with the European authorities is whether from the fiscal point the 1%-of-GDP worth of pension cuts are necessary or not to meet the planned 3.5%-of-GDP primary surplus target, and whether the government has the fiscal space for the stimulus measures planned (cuts in the Single Property Tax, corporate income tax, dividend distribution tax) without breaching the target. We expect Greece to reach the necessary 3.5%-of-GDP primary surplus in both 2019 and 2020, which would produce a small headline budget surplus in the next two years.
There are both upside and downside risks to our forecasts: external risks are about the Eurozone; domestically it is mainly about the government's implementation of the reform agenda (NPLs, social protection, attracting investment).
Despite strong soft indicators in 2018, GDP growth is 'just' on track to 2.0% in 2018
GDP growth to pick up to 2.4% in 2019E and 2.9% in 2020E
Greece to continue with excellent fiscal execution: primary surplus at 4.0% of GDP in 2018 and 3.5% in 2019-2020
EMEA Economic Perspectives 9 November 2018 |
39 |
vk.com/id446425943
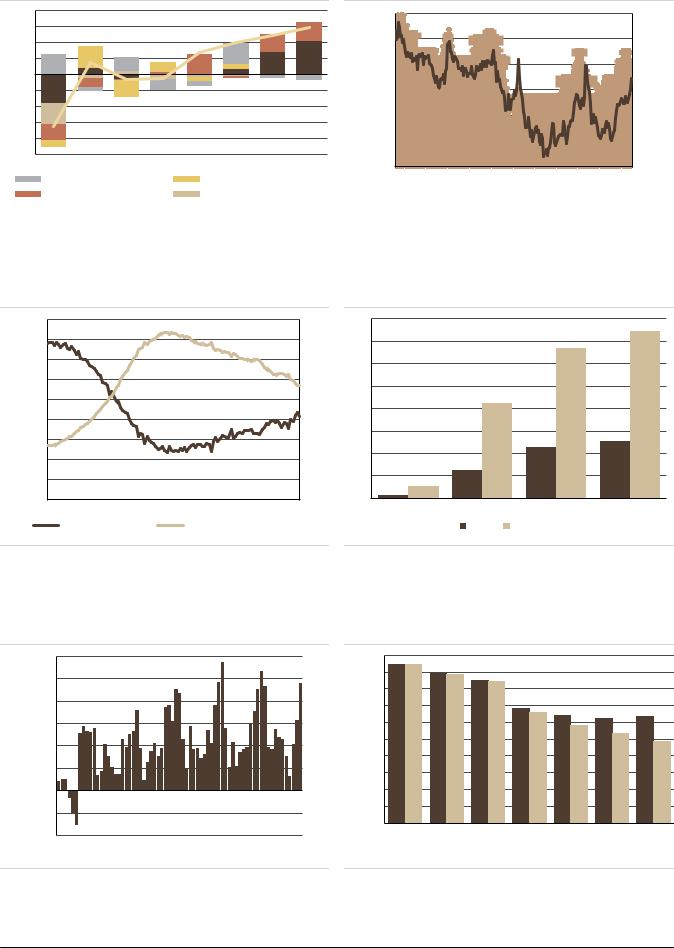
Figure 73: GDP growth and contributions, % |
Figure 74: Sentiment indicators |
4.0 |
|
|
|
|
|
|
|
120.0 |
|
|
|
|
|
0.0 |
3.0 |
|
|
|
|
|
|
|
|
|
|
|
|
|
(10.0) |
|
|
|
|
|
|
|
|
110.0 |
|
|
|
|
|
|
2.0 |
|
|
|
|
|
|
|
|
|
|
|
|
(20.0) |
|
|
|
|
|
|
|
|
|
|
|
|
|
|
||
1.0 |
|
|
|
|
|
|
|
|
|
|
|
|
|
|
|
|
|
|
|
|
|
100.0 |
|
|
|
|
|
(30.0) |
|
0.0 |
|
|
|
|
|
|
|
|
|
|
|
|
||
|
|
|
|
|
|
|
|
|
|
|
|
|
(40.0) |
|
(1.0) |
|
|
|
|
|
|
|
90.0 |
|
|
|
|
|
|
|
|
|
|
|
|
|
|
|
|
|
|
(50.0) |
||
(2.0) |
|
|
|
|
|
|
|
|
|
|
|
|
|
|
|
|
|
|
|
|
|
80.0 |
|
|
|
|
|
(60.0) |
|
(3.0) |
|
|
|
|
|
|
|
|
|
|
|
|
||
|
|
|
|
|
|
|
|
|
|
|
|
|
(70.0) |
|
(4.0) |
|
|
|
|
|
|
|
70.0 |
|
|
|
|
|
|
|
|
|
|
|
|
|
|
|
|
|
|
(80.0) |
||
(5.0) |
|
|
|
|
|
|
|
|
|
|
|
|
|
|
|
|
|
|
|
|
|
|
|
|
|
|
|
|
|
2013 |
2014 |
2015 |
2016 |
2017 |
2018F |
2019F |
2020F |
60.0 |
|
|
|
|
|
(90.0) |
Net exports |
|
|
Inventories |
|
|
Jan- |
Jan- |
Jan- |
Jan- |
Jan- |
Jan- |
Jan- |
||
Fixed investments |
|
Government consumption |
2000 |
2003 |
2006 |
2009 |
2012 |
2015 |
2018 |
|||||
|
|
Private consumption |
|
GDP growth |
|
|
|
Business sentiment |
|
Consumer sentiment, r.s. |
|
|
|
|
|
|
|
||||
|
|
|
|
|
|
|
|
|
|
|
Source: Haver, UBS |
|
|
|
Source: European Commission, Haver, UBS |
|
|||||
Figure 75: Improving labour market indicators Figure 76: EU funds absorption slowed in 2018 (EUR bn)*
4800 |
30 |
16 |
|
|
|
4600 |
25 |
14 |
|
|
|
4400 |
|
|
|
|
|
|
12 |
|
|
|
|
|
|
|
|
|
|
4200 |
20 |
10 |
|
|
|
|
|
|
|
|
|
4000 |
15 |
8 |
|
|
|
3800 |
|
|
|
||
|
6 |
|
|
|
|
3600 |
10 |
|
|
|
|
|
|
|
|
||
3400 |
|
4 |
|
|
|
5 |
|
|
|
|
|
3200 |
2 |
|
|
|
|
|
|
|
|
||
|
|
|
|
|
|
3000 |
0 |
0 |
|
|
|
Jan-2009 Jan-2011 Jan-2013 |
Jan-2015 Jan-2017 |
2015 |
2016 |
2017 |
2018 YTD |
Employment (000s) |
Unemployment rate (%, r.s.) |
|
Spent |
Contracted |
|
Source: Haver, UBS |
Source: European Commission, UBS* Out of EUR 26.22bn available |
Figure 77: Fiscal execution remains excellent, EUR mn (cumulative primary balance)
6000
5000
4000
3000
2000
1000
0
(1000)
(2000) Jan-2013Jan-2014Jan-2015Jan-2016Jan-2017Jan-2018
Figure 78: Public debt trajectories, % of GDP
200
180
160
140
120
100
80
60
40
20
0
2018 |
2019 |
2020 |
2030 |
2040 |
2050 |
2060 |
|||
|
Before debt relief measures |
|
|
After debt relief measures |
|||||
|
|
||||||||
|
|
||||||||
Source: Ministry of Finance, Haver, UBS |
Source: European Commission, UBS |
EMEA Economic Perspectives 9 November 2018 |
40 |
vk.com/id446425943
Figure 79: GREECE
|
2013 |
2014 |
2015 |
2016 |
2017 |
2018E |
2019F |
2020F |
|
|
|
|
|
|
|
|
|
|
|
Economic Activity and Employment |
|
|
|
|
|
|
|
|
|
GDP, local currency bn |
181 |
179 |
176 |
174 |
178 |
183 |
189 |
198 |
|
GDP, USD bn |
240 |
237 |
196 |
193 |
201 |
216 |
227 |
253 |
|
GDP per capita, USD |
21881 |
21796 |
18080 |
17889 |
18719 |
20211 |
21299 |
23729 |
|
Real GDP growth, % |
-3.2 |
0.7 |
-0.3 |
-0.2 |
1.4 |
2.0 |
2.4 |
2.9 |
|
Private consumption, % y/y |
-2.6 |
0.6 |
-0.5 |
0.0 |
0.1 |
0.5 |
2.0 |
3.0 |
|
Government consumption, % y/y |
-6.4 |
-1.4 |
1.2 |
-1.5 |
-1.1 |
-0.5 |
0.0 |
0.0 |
|
Gross Fixed Capital formation, % y/y |
-8.4 |
-4.7 |
-0.4 |
1.6 |
9.6 |
-0.5 |
9.0 |
9.5 |
|
Exports, % y/y |
1.5 |
7.7 |
3.1 |
-1.8 |
6.8 |
9.0 |
8.0 |
7.0 |
|
Imports, % y/y |
-2.4 |
7.7 |
0.4 |
0.3 |
7.2 |
4.5 |
8.0 |
7.5 |
|
Unemployment rate, % |
27.5 |
26.5 |
25.0 |
23.6 |
21.5 |
19.5 |
17.5 |
15.5 |
|
Industrial Production (%) |
-3.2 |
-2.0 |
1.1 |
2.5 |
4.5 |
1.0 |
2.0 |
2.5 |
|
Prices, interest rates and money |
|
|
|
|
|
|
|
|
|
CPI inflation, % y/y (average) |
-0.9 |
-1.4 |
-1.1 |
0.0 |
1.1 |
0.8 |
1.2 |
1.5 |
|
CPI inflation, % y/y (year-end) |
-1.8 |
-2.5 |
0.4 |
0.3 |
1.0 |
1.0 |
1.3 |
1.5 |
|
Broad money M2, % y/y (end-year) |
2.4 |
-0.1 |
-17.5 |
1.9 |
5.9 |
7.0 |
7.5 |
8.0 |
|
Domestic private credit, % y/y |
-4.3 |
-2.6 |
-4.1 |
-4.6 |
-6.0 |
-4.0 |
0.0 |
5.0 |
|
Domestic bank credit/GDP |
122.6 |
122.0 |
118.0 |
112.8 |
103.8 |
97.0 |
93.6 |
94.1 |
|
Policy rate, % (end-year) |
- |
- |
- |
- |
- |
- |
- |
- |
|
10 year bond yield, % (year-end) |
8.57 |
9.60 |
8.10 |
7.06 |
4.14 |
4.30 |
3.5 |
3.0 |
|
USD/EUR (year-end) |
1.38 |
1.21 |
1.09 |
1.05 |
1.20 |
1.15 |
1.23 |
1.3 |
|
Fiscal accounts |
|
|
|
|
|
|
|
|
|
General government budget balance, % GDP |
-13.2 |
-3.6 |
-5.7 |
0.6 |
0.8 |
1.0 |
0.0 |
0.3 |
|
Revenue, % GDP |
49.1 |
46.6 |
48.2 |
50.2 |
48.8 |
48.7 |
47.5 |
46.5 |
|
Expenditure, % GDP |
62.3 |
50.2 |
53.8 |
49.5 |
48.0 |
47.7 |
47.5 |
46.2 |
|
of which interest expenditure, % GDP |
4.0 |
4.0 |
3.5 |
3.2 |
3.2 |
3.0 |
3.5 |
3.2 |
|
Primary balance, % GDP |
-9.1 |
0.4 |
-2.1 |
3.9 |
4.0 |
4.0 |
3.5 |
3.5 |
|
Public sector debt (gross),% GDP |
177.4 |
178.9 |
176.8 |
180.8 |
178.6 |
185.0 |
175.0 |
165.0 |
|
of which domestic public debt, % GDP |
177.4 |
178.9 |
176.8 |
179.8 |
176.6 |
180.4 |
175.0 |
165.0 |
|
of which external public debt,% GDP |
0.0 |
0.0 |
0.0 |
1.0 |
2.0 |
4.6 |
4.4 |
4.1 |
|
% domestic public debt held by non-residents |
84.7 |
84.7 |
85.2 |
83.7 |
85.3 |
88.4 |
88.5 |
88.5 |
|
Public debt held by the central bank, % GDP |
- |
- |
- |
- |
- |
- |
- |
- |
|
Balance of payments |
|
|
|
|
|
|
|
|
|
Trade balance, EUR bn |
-20.8 |
-22.3 |
-17.2 |
-16.6 |
-18.4 |
-19.3 |
-20.5 |
-21.5 |
|
Exports, EUR bn |
26.9 |
26.8 |
24.8 |
24.5 |
27.9 |
31.3 |
34.0 |
36.5 |
|
Imports, EUR bn |
47.7 |
49.0 |
42.0 |
41.1 |
46.3 |
50.6 |
54.5 |
58.0 |
|
Current account balance, EUR bn |
-3.7 |
-2.9 |
-0.4 |
-2.2 |
-1.8 |
-2.5 |
-2.7 |
-3.2 |
|
as % of GDP |
-2.0 |
-1.6 |
-0.2 |
-1.3 |
-1.0 |
-1.4 |
-1.4 |
-1.6 |
|
Foreign direct investment (net), EUR bn |
2.7 |
-0.3 |
-0.3 |
4.0 |
2.7 |
3.0 |
3.5 |
4.0 |
|
Total FX reserves, EUR bn |
3.3 |
4.2 |
4.9 |
5.8 |
5.8 |
5.5 |
5.6 |
5.8 |
|
Foreign exchange reserves excl gold, EUR bn |
0.1 |
0.6 |
1.4 |
1.8 |
1.9 |
1.8 |
1.8 |
1.8 |
|
Total FX reserves, % GDP |
1.8 |
2.3 |
2.8 |
3.3 |
3.3 |
3.0 |
3.0 |
2.9 |
|
Total external debt, % GDP |
237.3 |
237.5 |
250.4 |
247.6 |
227.2 |
220.0 |
215.0 |
210.0 |
|
Net International Investment Position, % GDP |
-130.4 |
-131.9 |
-136.1 |
-139.7 |
-142.5 |
-141.0 |
-139.0 |
-137.0 |
|
Credit ratings |
|
|
|
|
|
|
|
|
|
Moody's |
Caa3 |
Caa1 |
Caa3 |
Caa3 |
Caa2 |
B3 (pos) |
n/a |
n/a |
|
S&P |
B- |
B |
CCC+ |
B- |
B- |
B+ (pos) |
n/a |
n/a |
|
Fitch |
B- |
B |
CCC |
CCC |
B- |
BB- (sta) |
n/a |
n/a |
|
Source: ELStat, Bank of Greece, IMF, European Commission, UBS. *As of Q4 2011, the ECB effective policy rate changed from the refi rate to the deposit rate.
EMEA Economic Perspectives 9 November 2018 |
41 |

vk.com/id446425943
United Arab Emirates
The rebound in oil prices and output and a ramp-up in fiscal spending should drive GDP growth to 3-3.5% in 2019-20.
In addition to the fiscal stimulus, the authorities announced a set of reforms to cut red tape, and attract foreign talent and investment.
After a slowdown in GDP growth to 0.8% in 2017, growth is accelerating both in the oil and non-oil sectors. Oil output was lifted by the relaxation of OPEC+ production curbs (up 4.1%y/y in Sep'18), while higher oil prices allowed the government to once again open the purse strings. GDP growth in the Emirate of Abu Dhabi was more affected by the downturn in the oil prices and consequently will likely show a relatively larger rebound than in the less oil-dependent Dubai, which experienced a milder slowdown and has been initially leading the economic recovery. We expect GDP growth of 2.5% in 2018, accelerating to 3.0% and 3.5% in 2019-20, with non-oil sector being the main contributor to growth.
Following a three-year fiscal consolidation up to 2017, a now more comfortable fiscal position and a rebound in oil prices created room for the government to support the non-oil sector. In June, the Abu Dhabi authorities announced a threeyear stimulus package of AED 50bn (of which AED 20bn is allocated to 2019), an increase in spending for 2018 and a set of initiatives to ease doing business. Already approved measures include cuts to electricity tariffs for the industry, reforms to business licensing and speeding up payments to private suppliers. Dubai has also unveiled a package of reforms to attract investment, including cuts to fees on aviation, property registration and commercial entities ("market fees"). Reforms to the UAE visa system and foreign ownership rules also aim to attract talent and investment. The fiscal oil price breakevens are slightly below current oil prices – $65-71/bbl on IMF estimates, and on our assumption of oil prices in low $70s we expect the government to run small fiscal surpluses in 2019-20.
CPI inflation peaked at 4.8%y/y in January 2018 as a result of the VAT hike and earlier hikes in the taxes on tobacco and alcohol. More recently, higher oil prices have also driven up transport prices, keeping inflation above 3%y/y even as the peg to a strong US$ reduced imported inflation pressures and housing costs declined. We expect inflation to decline to 2.3%y/y on average in 2019, as the effect of taxes drops out of the index. The currency peg to US$ implies that monetary conditions had to tighten, with stronger US$ and the Central Bank of the UAE mirroring the Fed rate increases in the CD and CD repo rates. UBS expectations of a weaker US$ in 2019-20 and fewer Fed hikes (three in 2019 and none in 2020) imply that while financial overall conditions would still be tightening, it will likely be less of a headwind to growth than in 2018.
Credit growth ground to a halt in 2017 but a rebound in the non-oil growth has helped lending to the private sector to recover to c.5%y/y by Q3'18. Further increases in interest rates, however, will likely dampen further credit growth acceleration. Higher oil prices (and thus higher public-sector deposits) have also improved the liquidity situation in the banking system. The property market, however, remains soft: prices in both Dubai and Abu Dhabi continue to decline. REIDIN estate agency reported residential sale prices down 5.7%y/y in Abu Dhabi and down 7.7%y/y in Dubai as of September, with deeper declines in rental prices of c. 10-11%y/y. UAE banks remain well capitalised, although reported NPLs have drifted higher to c 7% in Q2'18 from 6% in 2015.
We expect GDP growth to pick up from 2.5% in 2018 to 3.0-3.5% in 2019 and 2020, with the non-oil sector being the main contributor to GDP growth
Dubai and Abu Dhabi announce fiscal stimulus alongside reforms to attract investment and promote diversification
The US Dollar peg drove tightening of domestic monetary conditions in 2018 but we expect this to be less of a headwind to growth in 2019-20
Credit growth picked up somewhat but the property market remains soft
EMEA Economic Perspectives 9 November 2018 |
42 |
vk.com/id446425943
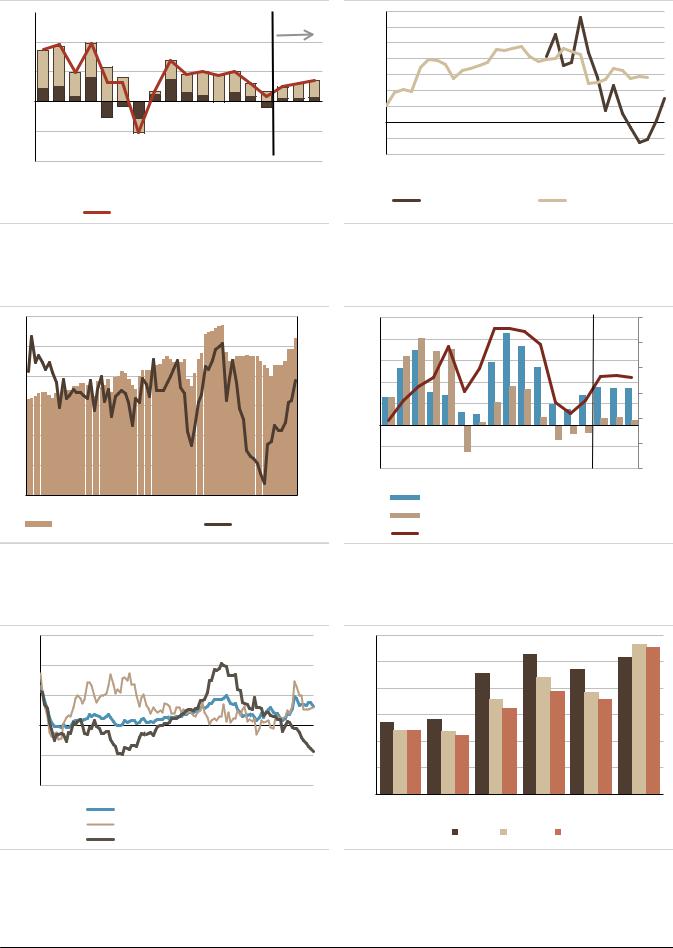
Figure 80: Contributions to GDP growth, oil vs non-oil
15 |
|
|
Contributions to GDP, pp |
F'cast |
10 |
5 |
0 |
(5) |
(10) |
03 04 05 06 07 08 09 10 11 12 13 14 15 16 17 18 19 20

 non-oil contribution to growth
 oil contribution to growth GDP growth, %y/y
Source: Haver, UBS
Figure 81: Abu Dhabi GDP growth rebounded in H1 2018
7 |
|
|
|
|
|
|
|
|
6 |
|
|
|
|
|
|
|
|
5 |
|
|
|
|
|
|
|
|
4 |
|
|
|
|
|
|
|
|
3 |
|
|
|
|
|
|
|
|
2 |
|
|
|
|
|
|
|
|
1 |
|
|
|
|
|
|
|
|
0 |
|
|
|
|
|
|
|
|
(1) |
|
|
|
|
|
|
|
|
(2) |
|
|
|
|
|
|
|
|
Mar-10 |
Mar-11 |
Mar-12 |
Mar-13 |
Mar-14 |
Mar-15 |
Mar-16 |
Mar-17 |
Mar-18 |
|
Abu Dhabi GDP y/y% |
|
Dubai GDP y/y% |
|
||||
Source: Haver, UBS
Figure 82: Oil output rebounds after OPEC caps lifted |
Figure 83: C/A surplus widens, fiscal on track to surplus |
3.2 |
|
12 |
25 |
mbd |
%y/y |
10 |
20 |
|
|
||
3 |
|
8 |
|
|
15 |
||
|
|
6 |
|
2.8 |
|
|
|
|
4 |
10 |
|
|
|
||
2.6 |
|
2 |
5 |
|
0 |
||
|
|
0 |
|
2.4 |
|
(2) |
|
|
|
||
|
(4) |
(5) |
|
|
|
||
2.2 |
|
(6) |
(10) |
|
|
(8) |
|
2 |
|
(10) |
|
Apr-12 Mar-13 Feb-14 Jan-15 Dec-15 Nov-16 Oct-17 Sep-18 |
|
||
UAE Crude oil production, mbd |
Oil output, y/y% |
|
|
% GDP |
|
|
|
|
$/bbl |
120 |
|
|
|
|
|
|
|
UBS |
100 |
|
|
|
|
|
|
|
|
|
|
|
|
|
|
forecas |
80 |
|
|
|
|
|
|
|
60 |
|
|
|
|
|
|
|
40 |
|
|
|
|
|
|
|
20 |
|
|
|
|
|
|
|
0 |
2004 |
2006 |
2008 |
2010 |
2012 |
2014 |
2016 2018F 2020F |
|
Current Account, % of GDP
Consolidated government budget balance (% GDP) Brent oil price, $/bbl
Source: IEA Oil Market Report, UBS Source: Haver, UBS
Figure 84: VAT hike pushed inflation up temporarily Figure 85: GCC fiscal breakeven price of oil
15 |
|
|
|
|
|
120 |
|
|
|
|
|
|
%y/y |
|
|
|
|
$/bbl |
|
|
|
|
|
||
|
|
|
|
|
|
|
|
|
|
|||
10 |
|
|
|
|
|
100 |
|
|
|
|
|
|
|
|
|
|
|
|
|
|
|
|
|
||
5 |
|
|
|
|
|
80 |
|
|
|
|
|
|
|
|
|
|
|
|
|
|
|
|
|
||
0 |
|
|
|
|
|
60 |
|
|
|
|
|
|
|
|
|
|
|
|
|
|
|
|
|
||
|
|
|
|
|
|
40 |
|
|
|
|
|
|
-5 |
|
|
|
|
|
|
|
|
|
|
|
|
|
|
|
|
|
|
20 |
|
|
|
|
|
|
-10 |
|
|
|
|
|
0 |
|
|
|
|
|
|
Jan-09 |
Jul-10 |
Jan-12 Jul-13 |
Jan-15 |
Jul-16 |
Jan-18 |
|
|
|
|
|
||
Kuwait |
Qatar |
UAE |
Saudi |
Oman |
Bahrain |
|||||||
|
|
Total CPI |
|
|
|
|||||||
|
|
Food and Non-Alcoholic Beverages |
|
|
|
|
Arabia |
|
|
|||
|
|
|
|
2014 |
|
2018E |
2019E |
|
||||
|
|
Housing, Water, Electricity and Gas |
|
|
|
|
||||||
|
|
|
|
|
|
|
|
|
||||
Source: Haver, UBS |
|
|
|
|
Source: IMF Regional Economic Outlook for ME and CA, October 2017and May |
|||||||
|
|
|
|
|
|
2018 |
|
|
|
|
|
|
EMEA Economic Perspectives 9 November 2018 |
43 |

vk.com/id446425943
Figure 86: Peg to the USD drives REER appreciation… |
Figure 87: …And interest rate rises |
130 |
Index, |
160 |
3.0 |
|
$/bbl |
% |
|
|
2010=100 |
140 |
|
120 |
|
2.5 |
|
|
120 |
||
|
|
|
|
110 |
|
100 |
2.0 |
|
|
|
|
|
|
80 |
1.5 |
100 |
|
|
|
|
60 |
|
|
|
|
|
|
90 |
|
40 |
1.0 |
|
|
||
|
20 |
|
|
|
|
0.5 |
|
|
|
|
|
80 |
|
0 |
|
06 |
07 |
08 |
09 |
10 |
11 |
12 |
13 |
14 |
15 |
16 |
17 |
18 |
0.0 |
|
|
|
|
|
|
|||
|
|
|
|
|
|
|||||||||||||||||
|
|
|
|
United Arab Emirates: Nominal Broad Effective Exch Rate (Avg, |
|
Jan-14 Sep-14 May-15 Jan-16 |
Sep-16 May-17 Jan-18 Sep-18 |
|||||||||||||||
|
|
|
|
|
||||||||||||||||||
|
|
|
|
2010=100) |
|
|
|
|
|
|
|
|
|
|
|
|
1M AEIBOR |
|
|
6M AEIBOR |
||
|
|
|
|
U.S.: Real Broad Effective Exch Rate (Avg, 2010=100) |
|
|
|
|
|
|
||||||||||||
|
|
|
|
|
|
|
|
|
||||||||||||||
|
|
|
|
Average Spot Price: Crude Oil: Brent (US$/Barrel) |
|
|
|
|
|
US policy target rate |
|
|
UAE CB CD repo rate |
|||||||||
|
|
|
|
|
|
|
|
|
|
|
||||||||||||
|
|
|
|
|
|
|
|
|
1M Libor |
|
|
UAE CB CD rate |
||||||||||
|
|
|
|
|
|
|
|
|
|
|
|
|
|
|
|
|
|
|
|
|||
|
|
|
|
|
|
|
|
|
|
|
|
|
|
|
|
|
|
|
|
|||
|
|
|
|
|
|
|
|
|
|
|
|
|
|
|
|
|
|
|
|
|
|
|
Source: Haver |
|
|
|
|
|
|
|
|
|
|
|
|
Source: Haver |
|
|
|
|
|||||
Figure 88: Public sector deposits rise with oil prices Figure 89: A modest pick-up in lending to private sector
40 |
% y/y |
|
|
|
|
|
|
|
|
50 |
30 |
|
|
|
|
|
|
|
|
|
40 |
20 |
|
|
|
|
|
|
|
|
|
30 |
10 |
|
|
|
|
|
|
|
|
|
20 |
0 |
|
|
|
|
|
|
|
|
|
10 |
(10) |
|
|
|
|
|
|
|
|
|
0 |
(20) |
|
|
|
|
|
|
|
|
|
-10 |
|
|
|
|
|
|
|
|
|
|
|
(30) |
|
|
|
|
|
|
|
|
|
-20 |
|
10 |
11 |
12 |
13 |
14 |
15 |
16 |
17 |
18 |
|
|
|
|||||||||
|
|
|
|
Government & GRE deposits, %y/y |
|
|
||||
Non-residents deposits, %y/y
Other residents deposits, %y/y
% y/y |
10 11 12 13 14 15 16 17 18 Banks' foreign assets
Claims on private sector (ex overseas branches) Claims on government and official entities
Source: CB of UAE, Haver, UBS Source: CB of UAE, Haver, UBS
Figure 90: Property prices continue to decline |
Figure 91: Share of non-performing loans drifted higher |
||
50 |
9 |
18 |
|
% y/y |
8 |
|
|
40 |
17 |
||
30 |
7 |
17 |
|
|
|||
20 |
6 |
16 |
|
5 |
|||
10 |
16 |
||
4 |
|||
0 |
15 |
||
3 |
|||
|
|
||
-10 |
2 |
15 |
|
|
|
||
-20 |
1 |
14 |
|
-30 |
0 |
14 |
|
Jan-05 Jul-06 Jan-08 Jul-09 Jan-11 Jul-12 Jan-14 Jul-15 Jan-17 Jul-18 |
Mar-2009 Jan-2011 Nov-2012 Sep-2014 |
Jul-2016 May-2018 |
|
Residential property prices in Dubai, %y/y |
NPL to Total Gross Loans (EOP, %) |
|
|
Residential property prices in Abu Dhabi, %y/y |
Regulatory tier 1 capital to risk-weighted assets (EOP, %), rhs |
||
Source: BIS, Haver, UBS |
Source: IMF, Haver |
|
|
EMEA Economic Perspectives 9 November 2018 |
44 |

vk.com/id446425943
Figure 92: UNITED ARAB EMIRATES
|
2013 |
2014 |
2015 |
2016 |
2017E |
2018F |
2019F |
2020F |
|
|
|
|
|
|
|
|
|
Economic Activity and Employment |
|
|
|
|
|
|
|
|
GDP, local currency bn |
1433 |
1481 |
1315 |
1311 |
1405 |
1569 |
1642 |
1716 |
GDP, USD bn |
390 |
403 |
358 |
357 |
383 |
428 |
447 |
468 |
GDP per capita, USD |
43226 |
43368 |
37405 |
36251 |
37759 |
40991 |
41623 |
42223 |
Real GDP growth, % |
5.1 |
4.4 |
5.1 |
3.0 |
0.8 |
2.5 |
3.0 |
3.5 |
Oil GDP growth, % y/y |
3.2 |
0.1 |
5.2 |
2.6 |
-3.0 |
1.6 |
1.8 |
2.3 |
Non-oil GDP growth, % y/y |
5.9 |
6.4 |
5.0 |
3.2 |
2.5 |
2.8 |
3.5 |
4.0 |
Unemployment rate, % |
- |
- |
- |
- |
- |
- |
- |
- |
Industrial Production (%) |
- |
- |
- |
- |
- |
- |
- |
- |
Prices, interest rates and money |
|
|
|
|
|
|
|
|
CPI inflation, % y/y (average) |
1.1 |
2.3 |
4.1 |
1.6 |
2.0 |
3.6 |
2.3 |
3.0 |
CPI inflation, % y/y (year-end) |
1.5 |
3.1 |
3.6 |
1.2 |
2.7 |
3.5 |
2.1 |
3.0 |
Broad money M2, % y/y (end-year) |
22.8 |
7.9 |
5.5 |
3.3 |
4.1 |
2.7 |
4.6 |
5.6 |
Domestic private credit, % y/y |
3.3 |
11.5 |
8.4 |
5.8 |
0.7 |
6.0 |
5.5 |
6.0 |
Domestic bank credit/GDP |
78.9 |
80.9 |
98.4 |
103.3 |
96.2 |
91.3 |
92.0 |
93.3 |
Policy rate (1 week CD), % (end-year) |
1.0 |
1.0 |
1.25 |
1.50 |
2.25 |
3.00 |
3.75 |
4.00 |
USD/AED (year-end) |
3.67 |
3.67 |
3.67 |
3.67 |
3.67 |
3.67 |
3.67 |
3.67 |
EUR/AED (year-end) |
5.06 |
4.46 |
4.00 |
3.85 |
4.34 |
4.22 |
4.51 |
4.77 |
Fiscal accounts |
|
|
|
|
|
|
|
|
General government budget balance, % GDP |
8.4 |
1.9 |
-3.4 |
-2.0 |
-1.6 |
1.6 |
1.8 |
1.1 |
Revenue, % GDP |
38.7 |
35.0 |
29.0 |
28.9 |
26.2 |
29.0 |
29.3 |
28.6 |
Expenditure, % GDP |
30.3 |
33.1 |
32.4 |
30.9 |
27.8 |
27.4 |
27.5 |
27.5 |
of which interest expenditure, % GDP |
0.4 |
0.3 |
0.2 |
0.1 |
0.2 |
0.1 |
0.1 |
0.2 |
Primary balance, % GDP |
8.8 |
2.2 |
-3.2 |
-1.9 |
-1.4 |
1.7 |
1.9 |
1.3 |
Public sector debt (gross),% GDP |
15.8 |
15.5 |
18.7 |
20.2 |
19.7 |
17.8 |
17.6 |
17.5 |
of which domestic public debt, % GDP |
14.3 |
15.3 |
16.5 |
- |
- |
- |
|
|
of which external public debt,% GDP |
6.4 |
5.7 |
5.9 |
- |
- |
- |
|
|
% domestic public debt held by non-residents |
- |
- |
- |
- |
- |
- |
- |
- |
Public debt held by the central bank, % GDP |
3.9 |
3.5 |
3.9 |
4.0 |
3.7 |
3.3 |
3.1 |
3.0 |
Balance of payments |
|
|
|
|
|
|
|
|
Trade balance, USD bn |
140.5 |
108.5 |
76.6 |
68.5 |
79.3 |
93.1 |
95.4 |
94.5 |
Exports, USD bn |
371.5 |
343.3 |
300.7 |
295.2 |
308.7 |
333.9 |
349.5 |
360.0 |
Imports, USD bn |
231.0 |
234.8 |
224.1 |
226.7 |
229.4 |
240.9 |
254.1 |
265.6 |
Current account balance, USD bn |
71.3 |
54.5 |
17.6 |
13.2 |
26.5 |
37.4 |
37.9 |
40.0 |
as % of GDP |
18.3 |
13.5 |
4.9 |
3.7 |
6.9 |
8.7 |
8.5 |
8.5 |
Foreign direct investment (net), USD bn |
1.7 |
-0.9 |
-7.9 |
-4.0 |
-3.7 |
-4.6 |
-5.0 |
-4.5 |
Total FX reserves, USD bn |
68.2 |
78.4 |
93.9 |
85.4 |
95.4 |
117.8 |
140.6 |
164.5 |
Foreign exchange reserves excl gold, USD bn |
68.2 |
78.4 |
93.7 |
85.1 |
95.1 |
117.5 |
115.0 |
115.0 |
Total FX reserves, % GDP |
17.5 |
19.4 |
26.2 |
23.9 |
24.9 |
27.6 |
31.4 |
35.2 |
Total external debt, % GDP |
44.3 |
48.2 |
62.9 |
67.6 |
70.8 |
73.5 |
66.9 |
64.2 |
Credit ratings* |
|
|
|
|
|
|
|
|
Moody's |
Aa2 |
Aa2 |
Aa2(st) |
Aa2(n) |
Aa2(st) |
Aa2(st) |
n/a |
n/a |
S&P |
AA |
AA |
AA(st) |
AA(st) |
AA(st) |
AA(st) |
n/a |
n/a |
Fitch |
AA |
AA |
AA(st) |
AA(st) |
AA(st) |
AA(st) |
n/a |
n/a |
Source: Central Bank of UAE, Haver, IMF, IIF, Bloomberg, UBS. *Emirate of Abu Dhabi. Moody's also rates the
Federal Government of the UAE Aa2, with a stable outlook.
EMEA Economic Perspectives 9 November 2018 |
45 |