


vk.com/id446425943
Czech Republic
•Tightening of monetary conditions should continue as the output gap remains positive in 2019-2020. We expect the CNB to raise its policy rate to 2.50% and the CZK/EUR to appreciate to 24.0 by end-2020.
•We see GDP growth in a tight range of 3.1-3.3% in 2018-2020, with inflation persistently above the CNB's 2% target.
The Czech National Bank (CNB) has significantly tightened monetary conditions in 2018. As the CZK has failed to appreciate so far in 2018, the CNB had to do the heavy-lifting using rates and thus increased its policy rate by 125bps to 1.75%. In our calculation, the cumulative tightening of monetary conditions since the removal of the CZK floor (April 2017) is the equivalent of 250bps of rate hikes.
What is the trajectory of the CZK and rates going forward in 2019-20? We forecast another 275bps of rate hikes worth of tightening in monetary conditions in the next two years due to robust economic growth. However, we expect about 75% of the tightening to come from the CZK rising to 24.0 vs EUR by end-2020, and only project 75bps of rate hikes to 2.50%: a 25bps hike in February and again in May 2019, and one more hike in early 2020 (in response to ECB tightening).
We project GDP to grow by 3.1% in 2018, 3.3% in 2019 and 3.1% in 2020. Our forecast is consistent with the output gap remaining in positive territory of 0.5- 0.7% of GDP in the forecast horizon. Growth should benefit from sustained consumer strength (driven by real income growth of 4.5-5.5%, record high consumer and retail sector optimism and renewed borrowing), EU-funds driven investment activity, and healthy export momentum. We believe that the unemployment rate will fall to 2% by 2020, which, given the 75% employment ratio, should leave basically no slack in the labour market.
We forecast inflation to hover around or slightly above the CNB’s target of 2% in 2019-20. The contribution from regulated prices should be rather stable at around 0.2-0.3pps. The most important pressure on prices is coming from wages (though directly affecting only around 12% of the basket) and items related to the housing market boom (new home prices, rents, furniture). Lower oil prices and the expected CZK gains should help to contain inflationary pressures. Headline CPI should peak around 2.5-2.6% y/y in April-May 2019 (base effects in food), and then ease off towards 2% y/y by end-19.
What would trigger the CZK to appreciate again vs the EUR in 2019-20 following the soft performance in 2018? We believe a combination of three factors. First, the surplus on the extended basic balance (external balance + FDI + capital account) should remain stable around 2.2-2.4% of GDP in 2018-20 and not decline anymore from 2017's 4.7% of GDP level. Second, the CNB is willing to pursue additional tightening. Third, foreign investor positioning on the bond market and in deposits has eased somewhat — which, in conjunction with a potential rise in interest in CE3 due to a stronger EUR, could bring additional inflows in the CZK market as well.
The key external risk is a sharp slowdown in the Eurozone, which should negate the CNB's appetite to tighten monetary conditions. The key domestic risk is a potentially faster rise in CPI on back of the tight labour market, which would argue for more and faster tightening.
Czech Republic delivered "by-the- book tightening" in 2018: hiking rates faster to compensate for a softer CZK
We expect another 275bps rate hikes worth of tightening in monetary conditions in 2019-20. 75% of that should come from CZK appreciation
GDP growth to hover around 3.1- 3.3% in 2018-20, with continued labour market tightening
Inflation to remain above or at the CNB's 2% target in 2019-20
What are possible triggers for CZK appreciation?
Key risks: Eurozone and potentially faster CPI increase
EMEA Economic Perspectives 9 November 2018 |
33 |
vk.com/id446425943
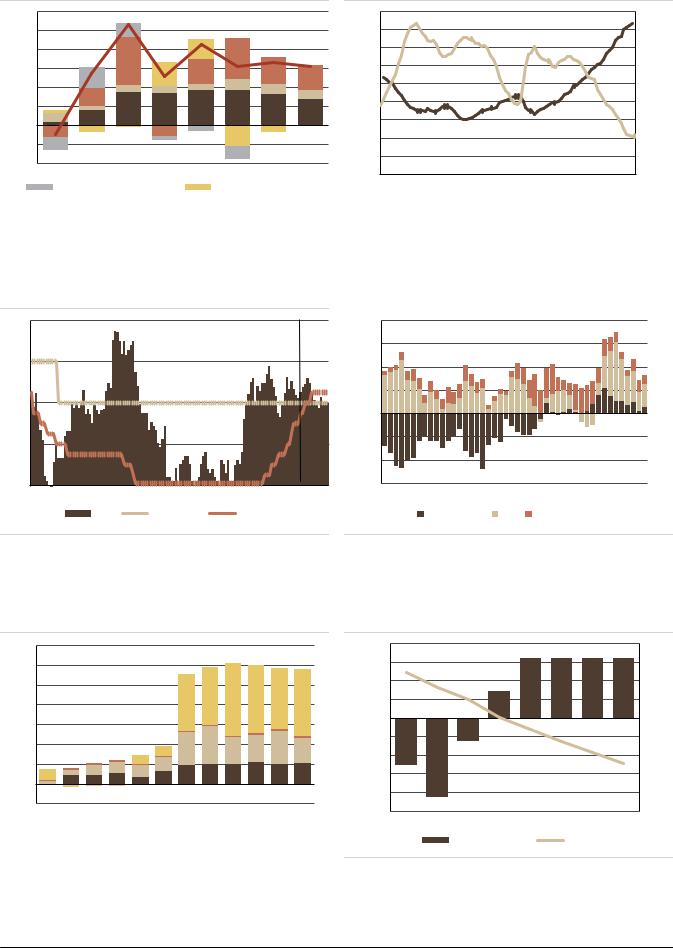
Figure 59: GDP growth and contributions |
Figure 60: Labour market tightens further |
6 |
|
|
|
|
|
|
|
76.0 |
|
|
|
|
10.0 |
5 |
|
|
|
|
|
|
|
74.0 |
|
|
|
|
9.0 |
4 |
|
|
|
|
|
|
|
72.0 |
|
|
|
|
8.0 |
|
|
|
|
|
|
|
|
|
|
|
7.0 |
||
3 |
|
|
|
|
|
|
|
70.0 |
|
|
|
|
|
|
|
|
|
|
|
|
|
|
|
|
6.0 |
||
2 |
|
|
|
|
|
|
|
68.0 |
|
|
|
|
|
|
|
|
|
|
|
|
|
|
|
|
5.0 |
||
|
|
|
|
|
|
|
|
|
|
|
|
||
|
|
|
|
|
|
|
|
66.0 |
|
|
|
|
|
1 |
|
|
|
|
|
|
|
|
|
|
|
4.0 |
|
|
|
|
|
|
|
|
64.0 |
|
|
|
|
||
0 |
|
|
|
|
|
|
|
|
|
|
|
3.0 |
|
|
|
|
|
|
|
|
|
|
|
|
|
||
(1) |
|
|
|
|
|
|
|
62.0 |
|
|
|
|
2.0 |
|
|
|
|
|
|
|
60.0 |
|
|
|
|
||
(2) |
|
|
|
|
|
|
|
|
|
|
|
1.0 |
|
|
|
|
|
|
|
|
58.0 |
|
|
|
|
0.0 |
|
2013 |
2014 |
2015 |
2016 |
2017 |
2018F |
2019F |
2020F |
|
|
|
|
||
Inventories |
|
|
|
Net exports |
|
Q1-1997 |
Q1-2001 |
Q1-2005 |
Q1-2009 |
Q1-2013 |
Q1-2017 |
||
|
|
Fixed investments |
|
|
Government consumption |
|
|
Employment rate (15-64), % |
|
Unemployment rate, %, r.s. |
|
|
|
|
|
|
|
||||||
|
|
|
|
|
|
||||||
|
|
Private consumption |
|
|
GDP growth |
|
|
|
|||
|
|
|
|
|
|
|
|
|
|||
|
|
|
|
|
|
|
|
|
|||
|
|
|
|
|
|
|
|
|
|
|
|
Source: CZSO, Haver, UBS |
|
|
|
|
Source: CZSO, Haver, UBS |
|
|
||||
Figure 61: Inflation and policy rate outlook, % Figure 62: Extended basic balance, % of GDP
4 |
|
|
|
forecast |
8% |
|
|
|
|
|
|
|
|
|
|
|
|
|
|
|
6% |
|
|
3 |
|
|
|
|
4% |
|
|
|
|
|
|
|
|
|
|
|
|
|
|
|
2% |
|
|
2 |
|
|
|
|
0% |
|
|
|
|
|
|
|
|
|
|
1 |
|
|
|
|
-2% |
|
|
|
|
|
|
|
|
|
|
|
|
|
|
|
-4% |
|
|
0 |
|
|
|
|
-6% |
|
|
Jan-09 |
Jan-11 |
Jan-13 |
Jan-15 |
Jan-17 Jan-19 |
Q1-2007 Q1-2009 Q1-2011 Q1-2013 Q1-2015 Q1-2017 |
||
|
CPI |
CPI target |
Policy rate |
C/A balance |
FDI |
Capital account |
|
Source: CZSO, CNB, Haver, UBS |
Source: CNB, Haver, UBS |
Figure 63: Cumulative foreign inflows into bonds and deposits, EUR mn
70.0
60.0
50.0
40.0
30.0
20.0
10.0
0.0
-10.0
Q3-2015 Q1-2016 Q3-2016 Q1-2017 Q3-2017 Q1-2018
|
|
Bank bonds |
|
Government bonds |
|
|
|
||
|
|
|
||
|
|
Corporate bonds |
|
Deposits |
|
|
|
||
|
|
|
||
|
|
|
|
|
Source: CNB, Haver, UBS |
|
|
||
Figure 64: Budget balance and public debt, % of GDP
2.0 |
|
|
|
|
50.0 |
1.5 |
|
|
|
|
45.0 |
1.0 |
|
|
|
|
|
|
|
|
|
|
|
0.5 |
|
|
|
|
40.0 |
0.0 |
|
|
|
|
35.0 |
(0.5) |
|
|
|
|
|
|
|
|
|
|
|
(1.0) |
|
|
|
|
30.0 |
(1.5) |
|
|
|
|
25.0 |
(2.0) |
|
|
|
|
|
|
|
|
|
|
|
(2.5) |
|
|
|
|
20.0 |
2013 |
2014 |
2015 |
2016 |
2017 2018F 2019F 2020F |
|
|
|
Budget balance |
Public debt |
||
Source: EuroStat, Haver, UBS
EMEA Economic Perspectives 9 November 2018 |
34 |

vk.com/id446425943
Figure 65: CZECH REPUBLIC
|
2013 |
2014 |
2015 |
2016 |
2017 |
2018F |
2019F |
2020F |
|
|
|
|
|
|
|
|
|
Economic Activity and Employment |
|
|
|
|
|
|
|
|
GDP, local currency bn |
4098 |
4314 |
4596 |
4773 |
5043 |
5314 |
5610 |
5899 |
GDP, USD bn |
208 |
206 |
182 |
189 |
215 |
243 |
262 |
304 |
GDP per capita, USD |
19797 |
19534 |
17248 |
17917 |
20278 |
22939 |
24739 |
28643 |
Real GDP growth, % |
-0.5 |
2.7 |
5.3 |
2.6 |
4.3 |
3.1 |
3.3 |
3.1 |
Private consumption, % y/y |
0.5 |
1.8 |
3.8 |
3.6 |
4.0 |
4.0 |
3.5 |
3.0 |
Government consumption, % y/y |
2.5 |
1.1 |
1.9 |
2.0 |
1.6 |
3.0 |
3.0 |
2.5 |
Gross Fixed Capital formation, % y/y |
-2.5 |
3.9 |
10.2 |
-2.3 |
5.4 |
8.5 |
5.5 |
5.0 |
Exports, % y/y |
0.2 |
8.7 |
6.0 |
4.5 |
6.5 |
4.0 |
5.0 |
4.5 |
Imports, % y/y |
0.1 |
10.1 |
6.8 |
3.4 |
5.8 |
6.0 |
6.0 |
5.0 |
Unemployment rate, % |
6.9 |
6.1 |
5.0 |
4.0 |
2.9 |
2.4 |
2.2 |
2.0 |
Industrial Production (%) |
0.6 |
5.0 |
4.4 |
3.7 |
5.7 |
3.5 |
5.0 |
5.0 |
Prices, interest rates and money |
|
|
|
|
|
|
|
|
CPI inflation, % y/y (average) |
1.4 |
0.4 |
0.3 |
0.7 |
2.5 |
2.2 |
2.2 |
2.0 |
CPI inflation, % y/y (year-end) |
1.4 |
0.1 |
0.1 |
2.0 |
2.4 |
2.3 |
2.0 |
2.0 |
Broad money M2, % y/y (end-year) |
5.0 |
6.6 |
8.4 |
6.6 |
8.6 |
6.5 |
8.0 |
6.0 |
Domestic private credit, % y/y |
6.3 |
3.5 |
5.2 |
5.8 |
5.2 |
5.5 |
6.0 |
5.5 |
Domestic bank credit/GDP |
51.4 |
50.2 |
50.1 |
51.2 |
51.5 |
52.0 |
52.5 |
52.5 |
Policy rate, % (end-year) |
0.05 |
0.05 |
0.05 |
0.05 |
0.50 |
1.75 |
2.25 |
2.50 |
10 year bond yield, % (year-end) |
2.53 |
0.70 |
0.50 |
0.43 |
1.58 |
2.20 |
2.45 |
2.70 |
USD/CZK (year-end) |
19.89 |
22.82 |
24.77 |
25.71 |
21.30 |
22.43 |
20.33 |
18.46 |
EUR/CZK (year-end) |
27.43 |
27.70 |
27.00 |
27.00 |
25.54 |
25.80 |
25.00 |
24.00 |
Fiscal accounts |
|
|
|
|
|
|
|
|
General government budget balance, % GDP |
-1.2 |
-2.1 |
-0.6 |
0.7 |
1.6 |
1.6 |
1.6 |
1.6 |
Revenue, % GDP |
41.4 |
40.3 |
41.1 |
40.2 |
40.4 |
41.0 |
41.5 |
41.5 |
Expenditure, % GDP |
42.6 |
42.4 |
41.7 |
39.4 |
38.8 |
39.4 |
39.9 |
39.9 |
of which interest expenditure, % GDP |
1.3 |
1.3 |
1.1 |
0.9 |
0.7 |
0.7 |
0.6 |
0.6 |
Primary balance, % GDP |
0.1 |
-0.8 |
0.5 |
1.6 |
2.3 |
2.3 |
2.2 |
2.2 |
Public sector debt (gross),% GDP |
44.9 |
42.2 |
40.0 |
36.8 |
34.6 |
32.5 |
30.5 |
28.5 |
of which domestic public debt, % GDP |
40.0 |
37.6 |
36.0 |
33.1 |
31.1 |
29.3 |
27.5 |
25.7 |
of which external public debt,% GDP |
4.9 |
4.6 |
4.0 |
3.7 |
3.5 |
3.3 |
3.1 |
2.9 |
% domestic public debt held by non-residents |
15.0 |
14.5 |
21.3 |
31.6 |
50.0 |
40.0 |
35.0 |
35.0 |
Public debt held by the central bank, % GDP |
0.0 |
0.0 |
0.0 |
0.0 |
0.0 |
0.0 |
0.0 |
0.0 |
Balance of payments |
|
|
|
|
|
|
|
|
Trade balance, USD bn |
8.5 |
10.6 |
7.6 |
10.1 |
10.3 |
9.9 |
10.4 |
12.4 |
Exports, USD bn |
135.9 |
146.7 |
128.5 |
130.9 |
145.7 |
159.7 |
168.5 |
187.2 |
Imports, USD bn |
127.4 |
136.1 |
120.8 |
120.8 |
135.4 |
149.8 |
158.0 |
174.7 |
Current account balance, USD bn |
-1.1 |
0.3 |
0.4 |
3.1 |
2.3 |
1.0 |
1.5 |
2.3 |
as % of GDP |
-0.5 |
0.1 |
0.2 |
1.6 |
1.1 |
0.4 |
0.6 |
0.8 |
Foreign direct investment (net), USD bn |
-2.5 |
3.9 |
-2.0 |
5.8 |
5.9 |
3.6 |
3.0 |
3.2 |
Total FX reserves, USD bn |
56.2 |
54.5 |
64.5 |
85.4 |
146.1 |
143.8 |
153.8 |
162.5 |
Foreign exchange reserves excl gold, USD bn |
56.3 |
53.4 |
64.9 |
85.4 |
146.1 |
143.8 |
153.8 |
162.5 |
Total FX reserves, % GDP |
27.0 |
26.5 |
35.4 |
45.1 |
68.1 |
59.2 |
58.6 |
53.4 |
Total external debt, % GDP |
66.7 |
68.3 |
67.9 |
73.4 |
86.7 |
82.0 |
79.0 |
75.0 |
Net International Investment Position, % GDP |
-41.4 |
-36.6 |
-33.2 |
-24.9 |
-26.9 |
-24.0 |
-22.0 |
-20.0 |
Credit ratings |
|
|
|
|
|
|
|
|
Moody's |
A1 |
A1 |
A1 |
A1 |
A1 |
A1 (pos) |
n/a |
n/a |
S&P |
AA- |
AA- |
AA- |
AA- |
AA- |
AA- (sta) |
n/a |
n/a |
Fitch |
A+ |
A+ |
A+ |
A+ |
A+ |
A+ (sta) |
n/a |
n/a |
Source: CNB, CZSO, IMF, EuroStat, Haver, UBS estimates
EMEA Economic Perspectives 9 November 2018 |
35 |

vk.com/id446425943
Hungary
•We expect the NBH to raise rates by 85bps — in line with the ECB tightening — to 1.75% by end-2020. In tandem with declining excess banking liquidity this should lift 3m BUBOR to c125bps by end-2020.
•We believe that HUF could gradually strengthen against the EUR.
Three key determinants of the outlook for the effective rate (3m BUBOR) in 201920 are: a) outlook for CPI and policy rate; b) development of excess banking system liquidity; and c) budget policies and management of EU funds.
First, CPI hit 3.6% y/y in September — which is the highest print since 2012 — and is firmly in the upper part of the NBH's target range (3% +/-1%). Inflation has been driven largely by non-core items: food, fuel and alcohol & tobacco – applying Eurostat's definition, core inflation was only 1.9% y/y. 2019 should bring further tobacco excise hikes, which could be offset by the VAT cut on milk. We expect CPI to reach 4% y/y in Q1-19 due to base effects (VAT cut on internet services). However, from May-2019 onwards, inflation should decline towards 3% on the back of lower petrol prices and should stay there in 2020. With CPI being close to the NBH's target from H2-19 onwards, we think the NBH will largely follow the pace of ECB tightening and hike the policy rate by 10bps to 1.0% in Q4-19 and then by a cumulative 75% to 1.75% in 2020 (this itself would imply BUBOR at c.100bps).
Second, the peak in excess banking sector liquidity should be behind us. This is mainly due to the pick-up in lending (we see private credit growth at 14-15% in 2018-19, the fastest pace since GFC), which in Q3-18 finally reversed the previous 'secular' fall in the loan-to-deposit ratio (currently at 71%). The lending boom is partly due to mortgages, as the construction industry strives to complete a huge number of residential homes before the VAT on new homes will be lifted back to 27%, from 5% by January 2020. This should help to reduce the excess banking sector liquidity in 2018-19, although in 2020 liquidity could stabilize. This points to spread tightening between the NBH's policy rate and BUBOR, and is the driving force in our call for 3m BUBOR to be at c125bps by end-2020.
Third, the budget should be a smaller drag on liquidity. The government started to accelerate the absorption of EU fund inflows since September (difference at peak levels between the government's pre-payments and actual EU fund inflows was about 3.4% of GDP, inflating the cash budget deficit) and also plans a cut in the headline deficit in 2019-20. This should help to limit the upside move in BUBOR.
As we expect GDP growth to decelerate to 3.1-3.2% in 2019-20 from an expected 4.5% in 2018, we think the narrowing of Hungary's external balance surplus will stop in 2020 at around +1.5% of GDP. With a likely acceleration of EU fund inflows and a decent FDI pipeline, we think that Hungary's net external debt position including FX reserves (but excluding intercompany loans) could drop to zero by end of 2020 from -57% of GDP in Q1-10. This underlines the huge external adjustment Hungary carried out. We believe this improvement in combination with some NBH rate hikes should allow the HUF to marginally appreciate to 315 vs the EUR by end-2020.
We believe the key negative risk to the economy is external (situation in Europe), while the main potential negative domestic risk is a more pronounced acceleration of inflation due to labour market tightness. An inflation upside would also put pressure on the NBH to remove accommodation earlier.
What is going to drive Bubor in 2019-20?
Inflation to pick up to 4% y/y in Q1-19, but then should stay around 3% from H2-19 onwards. NBH to take its cue from ECB on hikes: policy rate to rise to 1.75% by end-20.
Ongoing mortgage boom in 201819 is reducing the banking sector excess liquidity – should drive BUBOR to c125bps by end-20
Fiscal tightening and better EU funds-related cash management to cap BUBOR upside
External position should continue to improve. Expect gradual HUF appreciation in 2019-20.
EMEA Economic Perspectives 9 November 2018 |
36 |
vk.com/id446425943
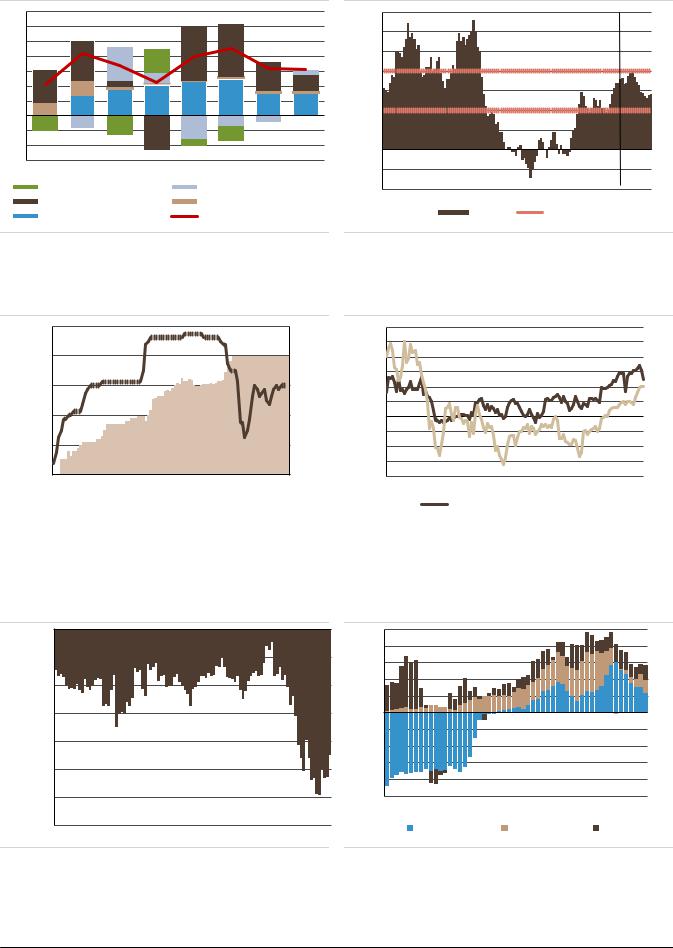
Figure 66: GDP growth and contributions |
Figure 67: Inflation outlook |
7 |
|
|
|
7 |
|
|
|
forecast |
|
6 |
|
|
|
6 |
fo |
|
|
|
|
|
|
|
|
|
|
|
|||
5 |
|
|
|
|
|
|
|
|
|
|
|
|
5 |
|
|
|
|
|
|
4 |
|
|
|
|
|
|
|
|
|
|
|
|
|
|
|
|
|
|
|
3 |
|
|
|
4 |
|
|
|
|
|
2 |
|
|
|
3 |
|
|
|
|
|
1 |
|
|
|
|
|
|
|
|
|
|
|
|
2 |
|
|
|
|
|
|
0 |
|
|
|
|
|
|
|
|
|
|
|
|
|
|
|
|
|
|
|
(1) |
|
|
|
1 |
|
|
|
|
|
(2) |
|
|
|
0 |
|
|
|
|
|
(3) |
|
|
|
|
|
|
|
|
|
|
|
|
(1) |
|
|
|
|
|
|
2013 |
2015 |
2017 |
2019F |
|
|
|
|
|
|
|
|
|
|
|
|
||||
Inventories |
|
Net exports |
|
(2) |
|
|
|
|
|
Fixed investments |
Government consumption |
Jan-09 |
Jan-11 |
Jan-13 |
Jan-15 |
Jan-17 |
Jan-19 |
||
Private consumption |
GDP growth |
|
|
Inflation |
|
Target band |
|
||
|
|
|
|
|
|
||||
Source: CSO, Haver, UBS |
|
|
|
Source: CSO, NBH, Haver, UBS |
|
|
|
||
Figure 68: FX swaps and Bubor |
Figure 69: Credit and deposit growth |
2,500 |
|
|
0.00 |
30% |
|
|
|
|
|
2,000 |
|
|
0.05 |
25% |
|
|
|
|
|
|
|
0.10 |
20% |
|
|
|
|
|
|
|
|
|
15% |
|
|
|
|
|
|
|
|
|
0.15 |
|
|
|
|
|
|
1,500 |
|
|
10% |
|
|
|
|
|
|
|
|
|
|
|
|
|
|
||
|
|
|
0.20 |
5% |
|
|
|
|
|
1,000 |
|
|
0.25 |
0% |
|
|
|
|
|
|
|
|
0.30 |
-5% |
|
|
|
|
|
500 |
|
|
-10% |
|
|
|
|
|
|
|
|
0.35 |
|
|
|
|
|
||
|
|
|
-15% |
|
|
|
|
|
|
|
|
|
|
|
|
|
|
|
|
0 |
|
|
0.40 |
-20% |
|
|
|
|
|
30-Dec- |
28-Jul- |
23-Feb- |
21-Sep- |
Jan-08 |
Jan-10 |
Jan-12 |
Jan-14 |
Jan-16 |
Jan-18 |
2016W |
2017W |
2018W |
2018W |
|
Private sector deposit growth, % y/y |
|
|||
|
|
|
|
|
|
||||
|
|
FX swap stock outstanding |
|
3m Bubor, %, inverted, r.s |
|
|
Private sector credit growth, % y/y |
|
|
|
|
|
|
||||
|
|
|
|
|
|
|
|
|
|
|
|
|
|
|
|
|
|
Source: NBH, Haver, UBS |
|
|
|
Source: NBH, Haver, UBS |
||||
Figure 70: Cash budget balance, 12m MA, HUF bn
0
(500)
(1,000)
(1,500)
(2,000)
(2,500)
(3,000)
(3,500)
Jan-10 Jan-11 Jan-12 Jan-13 Jan-14 Jan-15 Jan-16 Jan-17 Jan-18
Source: Ministry of Finance, Haver, UBS
Figure 71: Extended basic balance, % of GDP
10% |
|
8% |
|
6% |
|
4% |
|
2% |
|
0% |
|
-2% |
|
-4% |
|
-6% |
|
-8% |
|
-10% |
|
Q1-2005 Q1-2008 Q1-2011 Q1-2014 |
Q1-2017 |
Current account Capital account |
FDI |
Source: NBH, Haver, UBS
EMEA Economic Perspectives 9 November 2018 |
37 |

vk.com/id446425943
Figure 72: HUNGARY
|
2013 |
2014 |
2015 |
2016 |
2017 |
2018F |
2019F |
2018F |
|
|
|
|
|
|
|
|
|
Economic Activity and Employment |
|
|
|
|
|
|
|
|
GDP, local currency bn |
30247 |
32592 |
34324 |
35420 |
38183 |
41059 |
43771 |
46482 |
GDP, USD bn |
134 |
139 |
119 |
121 |
137 |
152 |
163 |
185 |
GDP per capita, USD |
13307 |
13715 |
11778 |
12352 |
13963 |
15560 |
16710 |
19073 |
Real GDP growth, % |
2.1 |
4.2 |
3.4 |
2.2 |
4.0 |
4.5 |
3.2 |
3.1 |
Private consumption, % y/y |
0.2 |
2.8 |
3.6 |
4.2 |
4.7 |
5.0 |
3.0 |
3.0 |
Government consumption, % y/y |
4.2 |
5.0 |
1.0 |
0.8 |
0.2 |
1.0 |
1.0 |
1.0 |
Gross Fixed Capital formation, % y/y |
9.8 |
12.3 |
1.9 |
-10.6 |
16.8 |
16.0 |
9.0 |
5.0 |
Exports, % y/y |
4.2 |
9.1 |
8.5 |
3.4 |
7.1 |
7.0 |
5.0 |
4.5 |
Imports, % y/y |
4.5 |
11.0 |
6.4 |
2.9 |
9.7 |
8.5 |
6.0 |
4.5 |
Unemployment rate, % |
10.2 |
7.7 |
6.8 |
5.1 |
4.2 |
3.7 |
3.5 |
3.4 |
Industrial Production (%) |
1.8 |
7.6 |
7.5 |
1.2 |
4.9 |
3.5 |
4.0 |
4.0 |
Prices, interest rates and money |
|
|
|
|
|
|
|
|
CPI inflation, % y/y (average) |
1.7 |
-0.2 |
0.3 |
0.4 |
2.3 |
2.9 |
3.3 |
3.0 |
CPI inflation, % y/y (year-end) |
0.4 |
-0.9 |
0.9 |
1.8 |
2.1 |
3.4 |
2.8 |
3.1 |
Broad money M2, % y/y (end-year) |
4.4 |
9.4 |
7.4 |
7.5 |
9.9 |
13.0 |
8.0 |
7.0 |
Domestic private credit, % y/y |
-5.4 |
-0.8 |
-10.5 |
-0.9 |
4.2 |
14.0 |
15.0 |
7.0 |
Domestic bank credit/GDP |
51.0 |
46.6 |
39.5 |
37.1 |
36.2 |
38.0 |
41.0 |
41.5 |
Policy rate, % (end-year) |
3.00 |
2.10 |
1.35 |
0.90 |
0.90 |
0.90 |
1.00 |
1.75 |
10 year bond yield, % (year-end) |
5.84 |
3.60 |
3.30 |
3.16 |
2.04 |
3.60 |
3.70 |
4.00 |
USD/HUF (year-end) |
220.9 |
259.4 |
287.2 |
296.2 |
261.9 |
278.3 |
260.2 |
242.3 |
EUR/HUF (year-end) |
297.0 |
314.9 |
313.1 |
311.0 |
310.0 |
320.0 |
320.0 |
315.0 |
Fiscal accounts |
|
|
|
|
|
|
|
|
General government budget balance, % GDP |
-2.6 |
-2.6 |
-1.9 |
-1.7 |
-2.0 |
-2.3 |
-1.8 |
-1.6 |
Revenue, % GDP |
46.7 |
46.8 |
48.2 |
44.9 |
44.5 |
45.5 |
45.0 |
44.5 |
Expenditure, % GDP |
49.3 |
49.4 |
50.1 |
46.5 |
46.5 |
47.8 |
46.8 |
46.1 |
of which interest expenditure, % GDP |
4.5 |
4.0 |
3.5 |
3.2 |
2.7 |
2.5 |
2.2 |
2.3 |
Primary balance, % GDP |
1.9 |
1.4 |
1.6 |
1.6 |
0.8 |
0.2 |
0.4 |
0.7 |
Public sector debt (gross),% GDP |
77.1 |
76.6 |
76.7 |
76.0 |
73.6 |
72.5 |
70.0 |
68.0 |
of which domestic public debt, % GDP |
45.0 |
45.9 |
50.3 |
54.7 |
56.5 |
58.4 |
57.4 |
57.1 |
of which external public debt,% GDP |
32.3 |
30.1 |
26.4 |
21.3 |
17.1 |
14.1 |
12.6 |
10.9 |
% domestic public debt held by non-residents |
45.9 |
41.1 |
31.4 |
26.3 |
22.7 |
22.0 |
22.0 |
21.0 |
Public debt held by the central bank, % GDP |
0.5 |
0.5 |
0.1 |
0.1 |
0.1 |
0.1 |
0.1 |
0.1 |
Balance of payments |
|
|
|
|
|
|
|
|
Trade balance, USD bn |
4.4 |
2.8 |
4.5 |
5.1 |
2.1 |
0.4 |
-0.6 |
-0.1 |
Exports, USD bn |
93.3 |
98.1 |
87.1 |
88.9 |
96.6 |
107.9 |
113.3 |
125.3 |
Imports, USD bn |
88.9 |
95.3 |
82.6 |
83.8 |
94.5 |
107.5 |
114.0 |
125.4 |
Current account balance, USD bn |
5.2 |
2.1 |
3.5 |
7.8 |
4.5 |
2.5 |
1.7 |
3.1 |
as % of GDP |
3.8 |
1.5 |
2.9 |
6.5 |
3.3 |
1.6 |
1.1 |
1.7 |
Foreign direct investment (net), USD bn |
1.5 |
3.9 |
1.3 |
2.6 |
1.8 |
3.0 |
2.4 |
4.4 |
Total FX reserves, USD bn |
46.5 |
42.0 |
33.1 |
25.8 |
27.6 |
27.6 |
30.8 |
33.8 |
Foreign exchange reserves excl gold, USD bn |
49.6 |
42.0 |
33.0 |
25.8 |
27.5 |
26.3 |
29.5 |
32.5 |
Total FX reserves, % GDP |
34.6 |
30.3 |
27.8 |
21.3 |
20.2 |
18.2 |
18.9 |
18.3 |
Total external debt, % GDP |
117.8 |
117.1 |
108.7 |
97.0 |
85.0 |
81.0 |
77.0 |
73.0 |
Net International Investment Position, % GDP |
-92.4 |
-80.3 |
-67.2 |
-68.6 |
-62.0 |
-51.0 |
-48.0 |
-45.0 |
Credit ratings |
|
|
|
|
|
|
|
|
Moody's |
Ba1 |
Ba1 |
Ba1 |
Baa3 |
Baa3 |
Baa3 (sta) |
n/a |
n/a |
S&P |
BB |
BB |
BB |
BBB- |
BBB- |
BBB- (pos) |
n/a |
n/a |
Fitch |
BB+ |
BB+ |
BB+ |
BBB- |
BBB- |
BBB- (pos) |
n/a |
n/a |
Source: NBH, CSO, IMF, EuroStat, Haver, UBS estimates
EMEA Economic Perspectives 9 November 2018 |
38 |