


vk.com/id446425943
Kazakhstan
We expect GDP growth to ease from 4.1% in 2017 to 3.1% in 2020
Banking sector clean-up and recapitalisation well underway
After picking up to an estimated 4.1%y/y in 2017, GDP growth is likely to gradually cool to 3.8%y/y this year (+4.2%y/y in H1'18) and to 3.5% and 3.1% in 2019-20. The surge in oil output after the launch of the giant Kashagan field is levelling off, so growth is going to be driven more by the non-oil sectors. Consumption in 2019 is likely to be supported by the 50% hike in minimum wage, some public-sector salary increases, and further growth in credit to households.
Higher oil exports helped to reduce the current account deficit from -6.5% of GDP in 2016 to -3.4% in 2017 and we expect a gap of under 1% in 2018, gradually widening to 1.5% by 2020 if oil prices are flat. The KZT, however, remains sensitive to the RUB volatility and capital outflows; the NBK sold $0.5bn in September to stabilise the exchange rate. Based on UBS's weak-USD view and our expectations of a firmer RUB/USD in 2018, we forecast KZT/USD at 345-350 in 2019-20. The fiscal stimulus rolled out in 2015-2017 to cushion the impact of falling oil prices and a recession in Russia, and the bailout of banks, widened the government budget deficit to 6.5% of GDP in 2017. Higher oil prices and lower spending needs this year have likely lifted the budget into a surplus of c. 1.5% of GDP and we expect the government budget to stay in small surplus in 2019-20. This should also allow it to replenish the National Oil Fund assets (currently at $56.3bn, down from a $77bn peak in 2014).
In 2017, the government and the NBK allocated c. 6% of GDP to a package of measures to clean up, re-capitalise and further consolidate the long-ailing banking sector. A merger of the two largest banks was completed in 2018 (with the state injecting 4.5% of GDP into the Problem Loan Fund to take over non-performing loans), and the NBK provided KZT 650bn in long-term loans to another five large banks, to invest in NBK notes. Over 2017-18, the NBK has also been withdrawing licences from smaller players for breaking regulatory requirements. New legislation was also passed to strengthen the NBK's supervisory powers. The banking system clean-up has not yet produced a rebound in private-sector credit, although a declining overall credit stock reflects bad asset write-downs, while credit to households is growing at c. 15% y/y. Earlier this year the government also launched a subsidised mortgage program "7-20-25".
Following the KZT sell-off in H2 2018, sparked by the RUB weakness and capital outflows in a relatively thin FX market, the NBK raised the base rate by 25bps to 9.25%. With the KZT remaining weak despite the rise in oil prices and against the background of rising global interest rates, we think the NBK may need to hike again to 9.5% in December. We forecast inflation to decline only gradually, from an average of 6% in 2018 to 5.6%y/y in 2019 and 5.4%y/y in 2020. Reaching the 4% inflation target by the end of 2020 will likely be challenging if wage growth continues to accelerate. Maintaining the interest differential with USD rates is also desirable to promote deposit de-dollarisation. Therefore, we think that in the absence of a significant withdrawal of fiscal support from the economy or a KZT rally, the NBK will have only limited room to cut rates in 2019-20, to 8.75%. The NBK liquidity injections into the banking system and still-stagnant credit growth contribute to the KZT liquidity surplus, keeping the interbank market rates near the bottom of the 9.25% +/-1% interest rate corridor; thus, further tightening may take form of narrowing the corridor.
Boost to GDP growth from oil output increase fading, private consumption growth picking up
Higher oil exports closed fiscal and external gaps and should allow for replenishment of the National Oil Fund
Government spent 6% of GDP on bank-sector clean-up and support; credit growth is yet to rebound
Rising global interest rates and faster wage growth to limit room for interest rate cuts
EMEA Economic Perspectives 9 November 2018 |
46 |
vk.com/id446425943
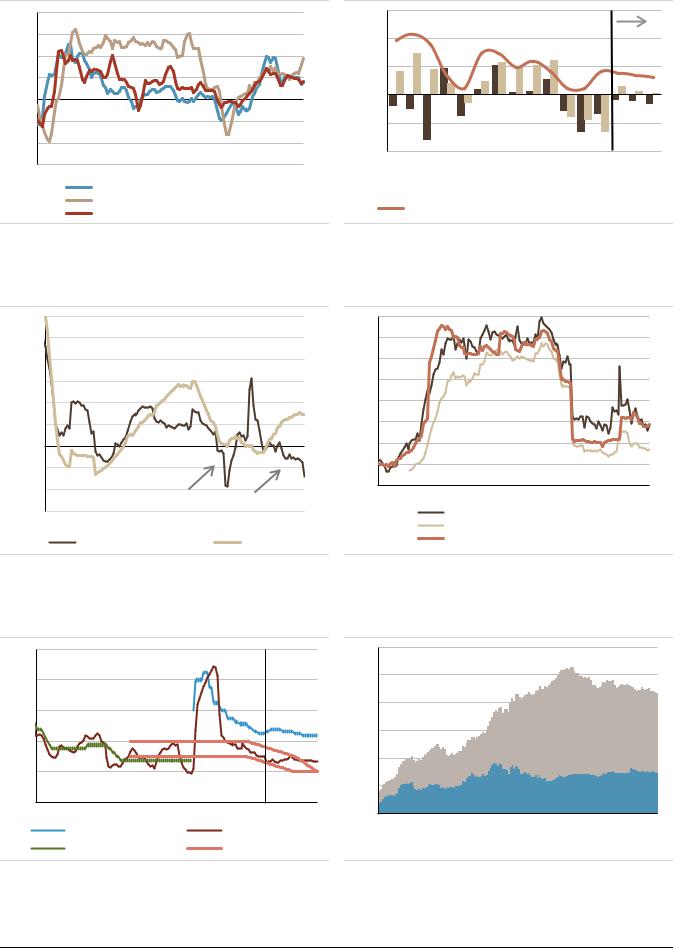
Figure 93: IP growth moderating, consumption picking up
20 |
% y/y, 3m MA |
|
|
|
|
|
15 |
|
|
|
|
||
|
|
|
|
|
|
|
10 |
|
|
|
|
|
|
5 |
|
|
|
|
|
|
0 |
|
|
|
|
|
|
(5) |
|
|
|
|
|
|
(10) |
|
|
|
|
|
|
(15) |
|
|
|
|
|
|
Mar/09 |
Nov/10 |
Jul/12 |
Mar/14 |
Nov/15 |
Jul/17 |
|
|
|
IP |
|
|
|
|
|
|
Retail sales |
|
|
|
|
|
|
Short-term economic indicator, %y/y |
||||
Source: Haver, UBS
Figure 94: External and fiscal imbalances closing
15 |
|
|
|
|
|
|
|
% |
|
|
|
|
|
|
|
10 |
|
|
|
|
|
|
Forecast |
|
|
|
|
|
|
|
|
5 |
|
|
|
|
|
|
|
0 |
|
|
|
|
|
|
|
(5) |
|
|
|
|
|
|
|
(10) |
|
|
|
|
|
|
|
2005 |
2007 |
2009 |
2011 |
2013 |
2015 |
2017 |
2019F |
 C/A balance, % of GDP
 Budget balance, % of GDP (incl Oil Fund accumulation) Real GDP growth, %
Source: Haver, UBS
Figure 95: Credit rebound driven by household loans |
Figure 96: Bank non-performing loans |
60% |
|
|
|
|
40% |
|
|
|
|
|
50% |
|
|
|
|
35% |
|
|
|
|
|
40% |
|
Bank loans, %y/y |
|
|
30% |
|
|
|
|
|
|
|
|
|
|
|
|
|
|
||
30% |
|
|
|
|
25% |
|
|
|
|
|
20% |
|
|
|
|
20% |
|
|
|
|
|
10% |
|
|
|
|
15% |
|
|
|
|
|
0% |
|
|
|
|
10% |
|
|
|
|
|
|
|
|
|
|
|
|
|
|
|
|
-10% |
|
|
|
|
5% |
|
|
|
|
|
|
|
|
|
|
|
|
|
|
|
|
-20% |
|
|
|
|
0% |
|
|
|
|
|
|
|
|
|
Apr-07 |
Apr-09 |
Apr-11 |
Apr-13 |
Apr-15 |
Apr-17 |
|
|
|
bad asset writedowns |
||||||||
-30% |
|
|
|
Overdue loans as % of total |
|
|||||
|
|
|
|
|
|
|
||||
Jan-08 |
Jul-09 |
Jan-11 Jul-12 Jan-14 |
Jul-15 |
Jan-17 |
Jul-18 |
|
90+ days overdue loans as % total |
|||
|
Nonbanking Legal Entities |
|
Individuals |
|
Provisions, % of total loans |
|
||||
|
|
|
|
|
|
|
||||
Source: NBK, Haver, UBS Source: NBK, Haver, UBS
Figure 97: Limited room for policy rate cuts Figure 98: National Oil Fund and NBK reserves
20 |
% |
|
|
|
|
|
|
|
|
|
|
120 |
|
|
|
|
|
|
|
|
|
|
|
|
|
16 |
|
|
|
|
|
|
|
|
|
|
|
100 |
|
|
|
|
|
|
|
|
|
|
|
|
|
12 |
|
|
|
|
|
|
|
|
|
|
|
80 |
|
|
|
|
|
|
|
|
|
|
|
|
|
8 |
|
|
|
|
|
|
|
|
|
|
|
60 |
|
|
|
|
|
|
|
|
|
|
|
|
|
|
|
|
|
|
|
|
|
|
|
|
|
40 |
4 |
|
|
|
|
|
|
|
|
|
|
|
|
|
|
|
|
|
|
|
|
|
|
|
|
20 |
0 |
|
|
|
|
|
|
|
|
|
|
|
0 |
09 |
10 |
11 |
12 |
13 |
14 |
15 |
16 |
17 |
18 |
19 |
20 |
|
|
|
NBK base rate |
|
|
|
Headline inflation, %y/y |
|
|||||
NBK refinancing rate |
NBK target range |
$bn
06 |
07 |
08 |
09 |
10 |
11 |
12 |
13 |
14 |
15 |
16 |
17 |
18 |
|||
|
|
NBK gross international reserves |
|
|
National Oil Fund |
||||||||||
|
|
|
|
||||||||||||
|
|
|
|
||||||||||||
Source: Haver, NBK, UBS |
Source: Haver, UBS |
EMEA Economic Perspectives 9 November 2018 |
47 |

vk.com/id446425943
Figure 99: KAZAKHSTAN
|
2013 |
2014 |
2015 |
2016 |
2017 |
2018F |
2019F |
2020F |
|
|
|
|
|
|
|
|
|
Economic Activity and Employment |
|
|
|
|
|
|
|
|
GDP, local currency bn |
35999 |
39676 |
40884 |
46971 |
52028 |
60065 |
65235 |
69623 |
GDP, USD bn |
237 |
221 |
184 |
137 |
160 |
175 |
185 |
200 |
GDP per capita, USD |
13789 |
12712 |
10435 |
7658 |
8772 |
9479 |
9894 |
10530 |
Real GDP growth, % |
6.0 |
4.2 |
1.2 |
1.1 |
4.1 |
3.8 |
3.5 |
3.1 |
Private consumption, % y/y |
10.6 |
1.1 |
1.8 |
1.2 |
1.5 |
3.7 |
3.0 |
2.6 |
Government consumption, % y/y |
1.7 |
9.8 |
2.4 |
2.3 |
2.1 |
-10.0 |
12.0 |
3.0 |
Gross Fixed Capital formation, % y/y |
5.5 |
4.4 |
4.2 |
3.0 |
4.0 |
4.5 |
4.0 |
4.5 |
Exports, % y/y |
2.7 |
-2.5 |
-4.1 |
-4.5 |
2.2 |
6.5 |
2.3 |
2.0 |
Imports, % y/y |
7.8 |
-4.0 |
-0.1 |
-2.0 |
-4.5 |
2.5 |
4.1 |
2.5 |
Unemployment rate, % |
5.2 |
5.0 |
5.0 |
5.0 |
4.9 |
4.9 |
4.8 |
4.8 |
Industrial Production (%) |
1.3 |
0.2 |
-1.7 |
-2.5 |
8.4 |
4.7 |
4.3 |
3.7 |
Prices, interest rates and money |
|
|
|
|
|
|
|
|
CPI inflation, % y/y (average) |
5.8 |
6.6 |
6.7 |
14.6 |
7.4 |
6.0 |
5.6 |
5.4 |
CPI inflation, % y/y (year-end) |
4.6 |
7.3 |
13.8 |
8.5 |
7.0 |
5.3 |
5.6 |
5.3 |
Broad money M2, % y/y (end-year) |
1.5 |
-8.2 |
8.0 |
46.2 |
7.5 |
-5.0 |
10.0 |
7.0 |
Domestic private credit, % y/y |
12.8 |
5.9 |
4.6 |
0.1 |
0.9 |
3.0 |
3.0 |
5.0 |
Domestic bank credit/GDP |
40.9 |
39.1 |
45.0 |
38.6 |
32.6 |
29.7 |
28.2 |
27.7 |
Base rate, % (end-year) |
5.5 |
5.5 |
16.0 |
12.0 |
10.25 |
9.50 |
9.00 |
8.75 |
>5y bond yield, % (year-end)*** |
5.8 |
6.4 |
7.1 |
7.1 |
7.3 |
7.75 |
8.25 |
7.75 |
USD/KZT (year-end) |
153.6 |
182.4 |
339.5 |
333.3 |
331.3 |
360.0 |
345.0 |
350.0 |
EUR/KZT (year-end) |
211.8 |
221.4 |
370.0 |
349.9 |
392.1 |
414.0 |
424.4 |
455.0 |
Fiscal accounts |
|
|
|
|
|
|
|
|
General govt budget balance, % GDP* |
5.2 |
6.1 |
-3.8 |
-4.4 |
-6.5 |
1.5 |
0.6 |
0.3 |
Revenue, % GDP |
21.6 |
23.7 |
13.4 |
12.4 |
14.0 |
18.4 |
17.2 |
18.2 |
Expenditure, % GDP |
16.4 |
17.6 |
17.2 |
16.8 |
20.5 |
16.9 |
16.6 |
17.9 |
of which interest expenditure, % GDP |
0.5 |
0.5 |
0.5 |
1.1 |
0.9 |
0.8 |
0.8 |
0.8 |
Primary balance, % GDP |
5.7 |
6.6 |
-3.3 |
-3.3 |
-5.6 |
2.3 |
1.4 |
1.1 |
Public sector debt (gross),% GDP |
12.9 |
14.6 |
18.8 |
24.7 |
26.3 |
24.2 |
24.5 |
23.9 |
of which domestic public debt, % GDP |
10.1 |
10.7 |
11.5 |
14.5 |
17.2 |
16.0 |
16.0 |
16.0 |
of which external public debt,% GDP |
2.8 |
4.0 |
7.2 |
10.2 |
9.1 |
8.3 |
8.5 |
7.9 |
% general govt debt held by non-residents |
16.4 |
15.7 |
28.0 |
45.0 |
36.4 |
38.0 |
38.0 |
40.0 |
Public debt held by the central bank, % GDP |
0.6 |
1.1 |
0.8 |
0.6 |
0.7 |
0.7 |
0.7 |
0.6 |
Balance of payments |
|
|
|
|
|
|
|
|
Trade balance, USD bn |
34.8 |
36.2 |
12.7 |
9.2 |
17.3 |
27.4 |
28.0 |
26.8 |
Exports, USD bn |
85.6 |
80.3 |
46.5 |
37.3 |
49.5 |
62.9 |
65.6 |
66.7 |
Imports, USD bn |
50.8 |
44.1 |
33.8 |
28.1 |
32.1 |
35.6 |
37.7 |
39.9 |
Current account balance, USD bn |
1.3 |
6.1 |
-5.1 |
-8.9 |
-5.4 |
-1.3 |
-1.9 |
-3.1 |
as % of GDP |
0.5 |
2.8 |
-2.8 |
-6.5 |
-3.4 |
-0.7 |
-1.0 |
-1.5 |
Foreign direct investment (net), USD bn |
8.0 |
4.6 |
3.1 |
13.4 |
3.7 |
4.0 |
4.0 |
4.0 |
Total FX reserves, USD bn |
24.7 |
29.2 |
27.9 |
29.7 |
30.7 |
30.0 |
32.0 |
35.0 |
Foreign exchange reserves excl gold, USD bn |
19.2 |
21.8 |
20.3 |
20.1 |
18.2 |
17.5 |
19.5 |
22.5 |
Total FX reserves, % GDP |
10.4 |
13.2 |
15.1 |
21.6 |
19.3 |
17.1 |
17.3 |
17.5 |
Total external debt, % GDP** |
32.1 |
35.2 |
30.8 |
42.9 |
39.5 |
36.4 |
36.1 |
35.1 |
Net International Investment Position, % GDP |
-14.1 |
-18.2 |
-20.6 |
-20.5 |
-26.3 |
-29.1 |
-30.0 |
-31.4 |
Credit ratings |
|
|
|
|
|
|
|
|
Moody's |
Baa2 |
Baa2 |
Baa2 (st) |
Baa3 (n) |
Baa3 (st) |
Baa3 (st) |
n/a |
n/a |
S&P |
BBB+ |
BBB+ |
BBB (n) |
BBB- (n) |
BBB- (st) |
BBB- (st) |
n/a |
n/a |
Fitch |
BBB+ |
BBB+ |
BBB+ (st) |
BBB (st) |
BBB (st) |
BBB (st) |
n/a |
n/a |
Source: NBK, IMF, Haver, Bloomberg, UBS. *Republican budget + National Oil Fund. **Excluding intercompany debt. ***No 10-year KZT bond available, data is for MEUKAM treasury bills with over 5y maturity.
EMEA Economic Perspectives 9 November 2018 |
48 |

vk.com/id446425943
Ukraine
We expect GDP growth to slow from 3.4% in 2018 to 2.5% in 2019 and 2.8% in 2020.
Key uncertainty is how cooperation with the IMF will proceed around and after presidential and parliamentary elections in 2019.
GDP growth picked up pace to 3.6%y/y in Q2 2018, from 2.5% in 2017, thanks to a rebound in consumption and investment; exports, however, remain soft. We expect growth to slow to 2.5% in 2019 and 2.8% in 2020 as the government had to rein in spending and financial conditions are tightening.
The key uncertainty for investors, in our view, is around economic policies and the cooperation with the IMF in the run-up and after the presidential (March) and parliamentary (October) elections in 2019. We believe the most market-friendly result would be a president willing to continue reforms and maintain a working IMF programme, supported by a ruling coalition in the parliament with a sufficiently wide majority. Current opinion polls, however, suggest a fragmented political landscape, so the outcome remains highly uncertain.
Last month, the authorities and the IMF reached a staff-level agreement on a new 14-month Stand-By Arragement of SDR 2.8bn ($3.9bn). The new SBA will replace the $17.5bn EFF program set to expire next March, out of which only SDR 6.2bn ($8.6bn) has been disbursed. A hike in household heating and gas tariffs and Rada's approval of the 2019 budget were put as pre-conditions. The government approved a 23.5% tariff hike from 1 November, and passed the 2019 budget in the first reading with a deficit of 2.3% of GDP. The IMF mission to discuss the 2019 budget is in Kyiv over 4-9 November. If the budget is passed in line with the IMF recommendations by early December (the Speaker of the State Rada said 22 November was possible), the IMF Executive Board may consider the SBA before Christmas. The NBU expects the first tranche of $1.5bn-1.9bn.
We assume that the authorities will get one tranche from the new SBA by early 2019, which should help to bring the NBU reserves back to the level of early 2018. More importantly, the agreement with the IMF should allow the government to draw on other official creditors and the external debt markets (Finance Ministry recently issued a $2bn Eurobond and state gas company Naftogaz also announced plans to issue), to line up foreign financing before a peak in external debt repayments in 2019-20. We think that the authorities will likely struggle to meet the requirements for further SBA tranches in the electoral period, so we don’t anticipate a sustained improvement in the external financing picture until 2020 when we would expect the newly elected President and government to re-engage with the Fund.
Weaker UAH and risks to external financing due to the IMF program extension delays caused the NBU to hike rates by a cumulative 450bps from October 2017 to 18%. We expect inflation to end 2018 near 10%y/y due to higher tariffs and the exchange-rate weakness, and to decline to the upper range of the 5%+/-1% inflation target only in 2020. We expect a tightening labour market to put upward pressure on wages, the UAH to again come under pressure to depreciate in 2019, and we see some risks of a fiscal slippage in 2019. Therefore we expect the NBU to continue to keep a tight policy stance (and potentially even hike further in the near term) until late 2019, returning the key rate back to 14.5% only by the end of 2020.
Tighter fiscal and monetary stance to cool GDP growth in 2019
Approaching presidential and parliamentary elections raise uncertainty about government economic policies
We expect the new SBA to help tide the government over increased external debt repayments in 2019 but don't expect a sustained improvement in the external financing until after the 2019 elections
The NBU will likely have to keep a tight policy stance into 2020
EMEA Economic Perspectives 9 November 2018 |
49 |
vk.com/id446425943
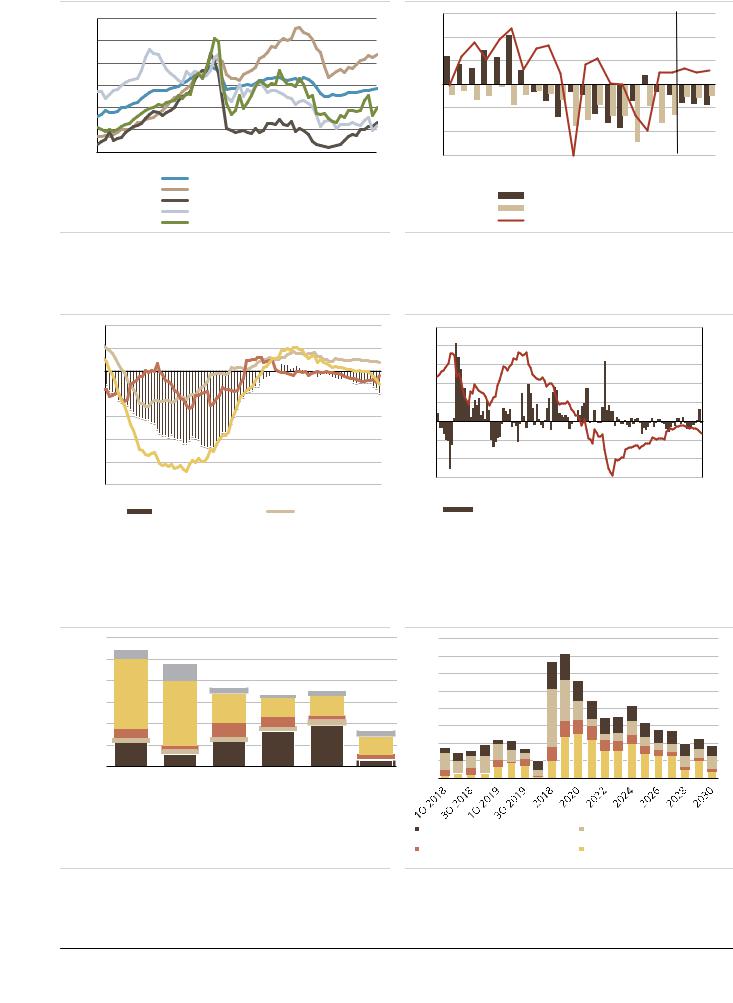
Figure 100: Domestic demand driving the recovery |
Figure 101: Real GDP growth, fiscal and external balances |
150 |
|
|
|
|
|
|
|
15 |
|
|
|
|
|
|
|
|
|
Index, seas. adj., 2007=100 |
|
|
|
10 |
||||
130 |
|
|
|
|
|
|
|
|
|
|
|
|
|
|
|
|
|
110 |
|
|
|
|
|
|
|
5 |
90 |
|
|
|
|
|
|
|
0 |
70 |
|
|
|
|
|
|
|
(5) |
50 |
|
|
|
|
|
|
|
(10) |
30 |
|
|
|
|
|
|
|
(15) |
2001 |
2003 |
2005 |
2007 |
2009 |
2011 |
2013 |
2015 |
2017 |
GDP
Household consumption
Fixed nvestment
Exports
Imports
|
|
|
|
|
|
|
|
|
|
|
|
|
|
|
|
|
|
|
UBS |
|
|
|
|
|
|
|
|
|
|
|
|
|
|
|
|
|
|
|
|
|
forecast |
||
1999 |
2000 |
2001 |
2002 |
2003 |
2004 |
2005 |
2006 |
2007 |
2008 |
2009 |
2010 |
2011 |
2012 |
2013 |
2014 |
2015 |
2016 |
2017 |
2018F |
2019F |
2020F |
|
|
|
|
|
|
C/A, % of GDP |
|
|
|
|
|
|
|
|
|
||||||
|
|
|
|
|
|
Budget balance, % of GDP |
|
|
|
|
|
||||||||||
|
|
|
|
|
|
Real GDP growth, % |
|
|
|
|
|
|
|
||||||||
Source: Haver, UBS Source: Haver, IMF, UBS
Figure 102: Basic balance deterioration driven by C/A gap Figure 103: NBU reserves started to decline
10 |
|
|
|
USD bn, 12m sum |
5 |
$ mn |
|
|
|
|
|
|
$ bn |
45 |
||
5 |
|
|
|
4 |
|
|
|
|
|
|
40 |
|||||
|
|
|
|
|
|
|
|
|
|
|
|
|
|
|||
0 |
|
|
|
|
|
3 |
|
|
|
|
|
|
|
|
|
35 |
|
|
|
|
|
|
|
|
|
|
|
|
|
|
|
|
|
(5) |
|
|
|
|
|
2 |
|
|
|
|
|
|
|
|
|
30 |
|
|
|
|
|
1 |
|
|
|
|
|
|
|
|
|
25 |
|
|
|
|
|
|
|
|
|
|
|
|
|
|
|
|
||
(10) |
|
|
|
|
|
0 |
|
|
|
|
|
|
|
|
|
20 |
|
|
|
|
|
|
|
|
|
|
|
|
|
|
|
||
(15) |
|
|
|
|
|
(1) |
|
|
|
|
|
|
|
|
|
15 |
(20) |
|
|
|
|
|
(2) |
|
|
|
|
|
|
|
|
|
10 |
|
|
|
|
|
|
|
|
|
|
|
|
|
|
|
|
|
(25) |
|
|
|
|
|
(3) |
|
|
|
|
|
|
|
|
|
5 |
|
|
|
|
|
Jan/08 |
Jul/09 |
Jan/11 |
Jul/12 |
Jan/14 |
Jul/15 |
Jan/17 |
Jul/18 |
|
|||
Jan-11 |
Jul-12 |
Jan-14 |
Jul-15 |
Jan-17 |
Jul-18 |
|
||||||||||
|
|
|
NBU interventions, USD bn (+ means USD selling) (lhs) |
|
||||||||||||
|
C/A balance |
|
FDI |
|
|
|
|
|
||||||||
|
|
Debt securities |
|
Basic balance |
|
|
|
NBU gross reserves, USD bn (rhs) |
|
|
|
|
|
|
|||
|
|
|
|
|
|
|
|
|
Source: Haver, UBS |
|
|
|
Source: NBU, Haver, UBS |
||||
Figure 104: Service schedule of FX-denominated ext debt* Figure 105: Estimated government debt schedule*
6,000 USD mn
5,000 |
|
|
|
|
|
4,000 |
|
|
|
|
|
3,000 |
|
|
|
|
|
2,000 |
|
|
|
|
|
1,000 |
|
|
|
|
|
0 |
|
|
|
|
|
2018Q3 |
2018Q4 |
2019Q1 |
2019Q2 |
2019Q3 |
2019Q4 |
400 bn, UAH |
350 |
300 |
250 |
200 |
150 |
100 |
50 |
0 |

 Direct investment: intercompany lending

 Other sectors (inc. guaranteed by state)

 Deposit-taking corporations, except the central bank
 Central bank
 Government
Source: NBU, UBS. *Including interest
Internal debt: service payments |
Internal debt: redemption |
External debt: service payments |
External debt: redemption |
Source: Ministry of Finance, UBS. *As of 1 Oct 2018, incl payments up to 1 Oct.
EMEA Economic Perspectives 9 November 2018 |
50 |
vk.com/id446425943
Figure 106: UKRAINE
|
2013 |
2014 |
2015 |
2016 |
2017 |
2018F |
2019F |
2020F |
|
|
|
|
|
|
|
|
|
Economic Activity and Employment |
|
|
|
|
|
|
|
|
GDP, local currency bn |
1465 |
1587 |
1989 |
2385 |
2983 |
3417 |
3795 |
4220 |
GDP, USD bn |
181 |
134 |
91 |
93 |
112 |
121 |
129 |
139 |
GDP per capita, USD |
3979 |
2951 |
2129 |
2192 |
2644 |
2862 |
3070 |
3302 |
Real GDP growth, % |
0.0 |
-6.6 |
-9.8 |
2.4 |
2.5 |
3.4 |
2.5 |
2.8 |
Unemployment rate, (avg)% |
8.0 |
9.4 |
9.6 |
9.9 |
10.0 |
9.5 |
9.3 |
9.0 |
Industrial Production (%) |
-4.3 |
-10.1 |
-13.0 |
2.8 |
0.4 |
1.5 |
2.0 |
2.5 |
Prices, interest rates and money |
|
|
|
|
|
|
|
|
CPI inflation, % y/y (average) |
-0.3 |
12.1 |
48.7 |
13.9 |
14.4 |
11.6 |
8.8 |
6.8 |
CPI inflation, % y/y (year-end) |
-0.2 |
24.9 |
43.3 |
12.4 |
13.7 |
9.5 |
8.0 |
6.0 |
Broad money M2, % y/y (end-year) |
17.5 |
5.4 |
4.0 |
10.9 |
8.0 |
10.0 |
9.0 |
10.0 |
Domestic private credit, % y/y |
12.9 |
11.3 |
-2.9 |
-1.9 |
1.1 |
15.0 |
8.0 |
10.0 |
Domestic bank credit/GDP |
82.3 |
95.3 |
75.8 |
70.3 |
58.7 |
58.9 |
57.3 |
56.6 |
Key policy rate, % (end-year) |
6.50 |
14.00 |
22.00 |
14.00 |
14.50 |
18.00 |
17.00 |
14.50 |
UAH/USD (year-end) |
8.2 |
15.8 |
24.0 |
27.2 |
28.1 |
28.5 |
30.2 |
30.6 |
UAH/EUR (year-end) |
11.4 |
19.1 |
26.2 |
28.6 |
33.2 |
33.1 |
37.4 |
39.8 |
Fiscal accounts |
|
|
|
|
|
|
|
|
General government budget balance, % GDP* |
-6.7 |
-12.1 |
-4.4 |
-8.1 |
-6.4 |
-2.5 |
-2.8 |
-2.3 |
of which interest expenditure, % GDP |
2.5 |
3.3 |
4.4 |
4.1 |
3.7 |
3.9 |
4.1 |
4.1 |
Primary balance, % GDP |
-2.3 |
-1.2 |
3.1 |
1.9 |
0.8 |
1.4 |
1.6 |
1.6 |
Public sector debt (gross),% GDP |
39.9 |
65.4 |
79.1 |
80.9 |
71.8 |
67.9 |
65.2 |
64.4 |
of which domestic public debt, % GDP |
19.4 |
26.6 |
26.6 |
28.9 |
25.7 |
25.4 |
25.7 |
25.4 |
of which external public debt,% GDP |
20.5 |
38.8 |
52.4 |
52.0 |
46.1 |
42.5 |
39.5 |
39.0 |
% domestic public debt held by non-residents |
4.8 |
4.7 |
4.4 |
1.0 |
0.7 |
1.0 |
0.6 |
1.5 |
Public debt held by the central bank, % GDP |
59.4 |
69.5 |
77.2 |
57.2 |
48.1 |
46.0 |
45.0 |
42.0 |
Balance of payments |
|
|
|
|
|
|
|
|
Trade balance, USD bn |
-22.1 |
-7.1 |
-3.5 |
-6.9 |
-9.7 |
-13.0 |
-14.0 |
-17.0 |
Exports, USD bn |
59.1 |
50.6 |
35.4 |
33.6 |
39.7 |
43.0 |
48.0 |
53.0 |
Imports, USD bn |
81.2 |
57.7 |
38.9 |
40.5 |
49.4 |
56.0 |
62.0 |
70.0 |
Current account balance, USD bn |
-16.5 |
-4.6 |
1.6 |
-1.3 |
-2.4 |
-4.7 |
-5.2 |
-6.0 |
as % of GDP |
-9.2 |
-3.4 |
1.8 |
-1.4 |
-2.2 |
-3.9 |
-4.0 |
-4.3 |
Foreign direct investment (net), USD bn |
4.1 |
0.3 |
3.0 |
3.3 |
2.6 |
2.0 |
2.0 |
3.5 |
Total FX reserves, USD bn |
20.4 |
7.5 |
13.3 |
15.5 |
18.8 |
18.2 |
17.0 |
22.0 |
Foreign exchange reserves excl gold, USD bn |
18.8 |
6.6 |
12.4 |
14.6 |
17.7 |
17.1 |
15.9 |
20.9 |
Total FX reserves, % GDP |
11.3 |
5.6 |
14.6 |
16.6 |
16.8 |
15.1 |
13.1 |
15.8 |
Total external debt, % GDP |
78.7 |
103.0 |
129.3 |
120.5 |
102.9 |
101.0 |
96.7 |
93.7 |
Net International Investment Position, % GDP |
-37.1 |
-37.6 |
-36.1 |
-29.1 |
-31.3 |
-35.2 |
-39.2 |
-43.5 |
Credit ratings |
|
|
|
|
|
|
|
|
Moody's |
Caa1 |
Caa3 |
Caa3 |
Caa3 (st) |
Caa2 (p) |
Caa2 (p) |
n/a |
n/a |
S&P |
B- |
CCC- |
B- |
B- (st) |
B- (st) |
B- (st) |
n/a |
n/a |
Fitch |
B- |
CCC |
CCC |
B- (st) |
B- (st) |
B- (st) |
n/a |
n/a |
Source: NBU, State Statistics Service, IMF, IIF, UBS. *Including Naftogaz and bank recapitalisation
EMEA Economic Perspectives 9 November 2018 |
51 |