

A maximin strategy (pessimistic approach). Assumes that the expectation will do the worst thing for the person in question. EX:
person A analyses the strategy to confess and sees that if B confesses A will get either 10 or 5 years.
If he expects B not to confess A will have 1 year or be free.
Of 2 bad outcomes A chooses the best – 5 years – to confess
The same for B – the least bad – 5 years.
They are in lower right corner.
Maximax strategy (optimistic approach). Ex:
A expects that B will do the best possible thing for A.
They meet once more in the same corner.
Given the behavior of the rival the person can do no better.
Hash equilibrium (low-right corner).
Cournot model / duopoly (2 firms in industry) 1830s.
We assume that 2 firms are identical and can’t collude.
Initially there is only 1 firm in the market and a new one enters. The new one decreases the price => it sells a certain output.
The existing firm takes these price and output as given and the only thing it can do is to ↓ price and output. The new firm in turn ↓ price again and ↑ output. The old firm again takes it as given and ↓ output.
N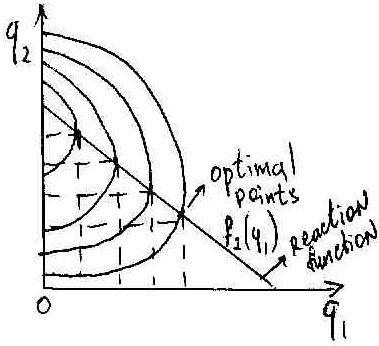 ew
firm
aggressive style, old one retreats. Equilibrium
when both firms have equal market share
– Cournot equilibrium.
ew
firm
aggressive style, old one retreats. Equilibrium
when both firms have equal market share
– Cournot equilibrium.
Reaction function – the set of tangent (optimal) points.
Isoprofit curve – shows all the combinations of the 2 firms that yield the same level of profit to one of the firms.
Isoprofit curve and the reaction function of firm 2.
Profit ↑ as we move left.
As we move left output of firm 1 = 0 => firm 2 – monopolist.
Isoprofit curve and the reaction function of firm 2.
Profit ↑ as we move d
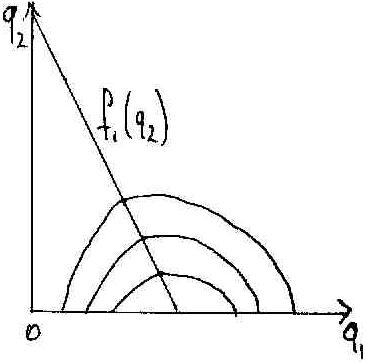 own.
own.As we move down, the firm 2’s output = 0=> firm 1 – monopolist.
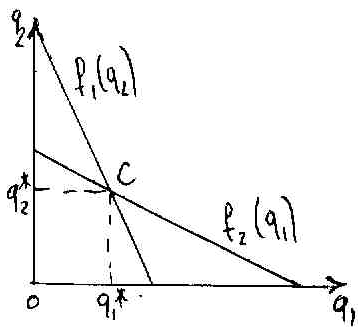
Cournot equilibrium.
Optimum q2 for F2 will be the function of beliefs concerning the output of F1.
C – point when the market is shared – cournot equilibrium.
 - optimum choices.
Market equilibrium in different market structures.
C
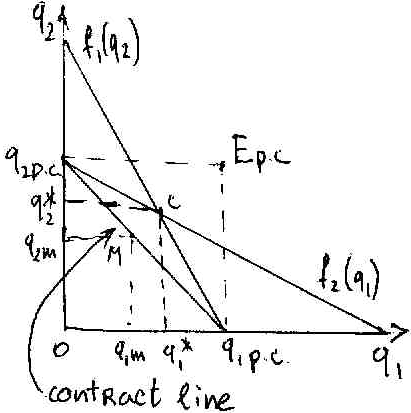 – Cournot equilibrium.
Contract line – firms collude and become a monopoly.
Output under monopoly<Output under duopoly<Output under perfect competition.
The final output of the industry and of two firms is now the lowest.
Algebraic explanation of the Cournot model.
![]()
|
![]()
|![]()
If the costs are intro into the analysis the equilibrium quantities and output will be:
Stackelberg model (quantity leadership model).
2 firms are considered, but not identical. Firm1 is a leader, a dominant one, Firm2 – follower, who builds up the strategy according to the behavior of Firm1. Firm2 has a reaction function.
The leader doesn’t react to the steps of the Firm2. But he recognizes that it reacts to his behavior.
![]() For the leader there won’t be a reaction
function:
For the leader there won’t be a reaction
function:
w
 e
shall combine reaction function of Firm2 with isoprofit of Firm1.
e
shall combine reaction function of Firm2 with isoprofit of Firm1.Firm1 dominates, Firm2 reacts, at point S both MAX their profits.
In Stackelberg model the market is not equally shared. Dominant produce more and have more power, the second produces less. Firm1 – leader in Q.
Contestable markets model.
If the costs of entry to an industry and exit from industry are very low, then there is always a high possibility of the numerous new firms appearance on the market. The market will lose its oligopolistic structure and will become competitive.