Varian Microeconomics Workout
.pdf
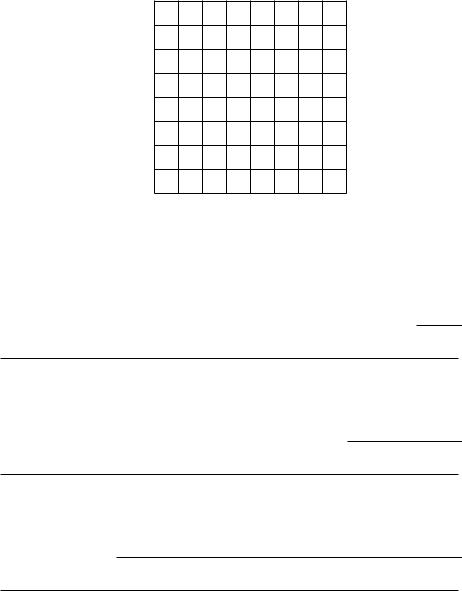
(c) Use black ink to sketch in the indi®erence curve along which Harry's utility is 12. Use red ink to sketch in the indi®erence curve along which Harry's utility is 6. (Hint: Is there anything about Harry Mazzola that reminds you of Mary Granola?)
French fries
8
6
4
2
0 |
2 |
4 |
6 |
8 |
|
|
|
Corn chips |
|
(d) At the point where Harry is consuming 5 units of corn chips and 2 units of french fries, how many units of corn chips would he be willing to
trade for one unit of french fries? |
|
. |
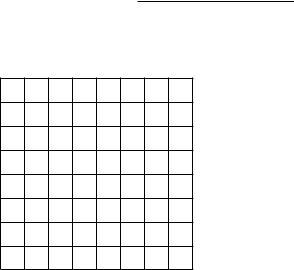
4.8 (1) Vanna Boogie likes to have large parties. She also has a strong preference for having exactly as many men as women at her parties. In fact, Vanna's preferences among parties can be represented by the utility function U(x; y) = minf2x ¡ y; 2y ¡ xg where x is the number of women and y is the number of men at the party. On the graph below, let us try to draw the indi®erence curve along which Vanna's utility is 10.
(a) Use pencil to draw the locus of points at which x = y. What point
on this gives Vanna a utility of 10? |
|
Use blue ink to draw |
the line along which 2y ¡ x = 10. When minf2x ¡ y; 2y ¡ xg = 2y ¡ x,
there are (more men than women, more women than men)?
Draw a squiggly red line over the part of the blue line for which U(x; y) = minf2x ¡ y; 2y ¡ xg = 2y ¡ x. This shows all the combinations that Vanna thinks are just as good as (10; 10) but where there are (more
men than women, more women than men)? Now draw a blue line along which 2x ¡ y = 10. Draw a squiggly red line over the part of this new blue line for which minf2x ¡ y; 2y ¡ xg = 2x ¡ y. Use pencil to shade in the area on the graph that represents all combinations that Vanna likes at least as well as (10; 10).

(b) Suppose that there are 9 men and 10 women at Vanna's party. Would Vanna think it was a better party or a worse party if 5 more men came
to her party? |
|
. |
(c) If Vanna has 16 women at her party and more men than women, and if she thinks the party is exactly as good as having 10 men and 10
women, how many men does she have at the party? If Vanna has 16 women at her party and more women than men, and if she thinks the party is exactly as good as having 10 men and 10 women, how many men
does she have at her party? .
(d) Vanna's indi®erence curves are shaped like what letter of the alpha-
bet? |
|
|
|
. |
|
y |
|||
|
20 |
|
|
|
|
|
|
|
|
15
10
5
0 |
5 |
10 |
15 |
20 |
|
|
|
|
x |
4.9 (0) Suppose that the utility functions u(x; y) and v(x; y) are related by v(x; y) = f(u(x; y)). In each case below, write \Yes" if the function f is a positive monotonic transformation and \No" if it is not. (Hint for calculus users: A di®erentiable function f(u) is an increasing function of u if its derivative is positive.)
(a) f(u) = 3:141592u. |
|
|
. |
(b) f(u) = 5; 000 ¡ 23u. |
|
. |
|
|
|||
(c) f(u) = u ¡ 100; 000. |
|
. |

(d) f(u) = log10 u. |
|
. |
|||
|
|||||
(e) f(u) = ¡e¡u. |
|
|
. |
||
(f) f(u) = 1=u. |
|
|
|
. |
|
(g) f(u) = ¡1=u. |
|
|
. |
||
4.10 (0) Martha Modest has preferences represented by the utility function U(a; b) = ab=100, where a is the number of ounces of animal crackers that she consumes and b is the number of ounces of beans that she consumes.
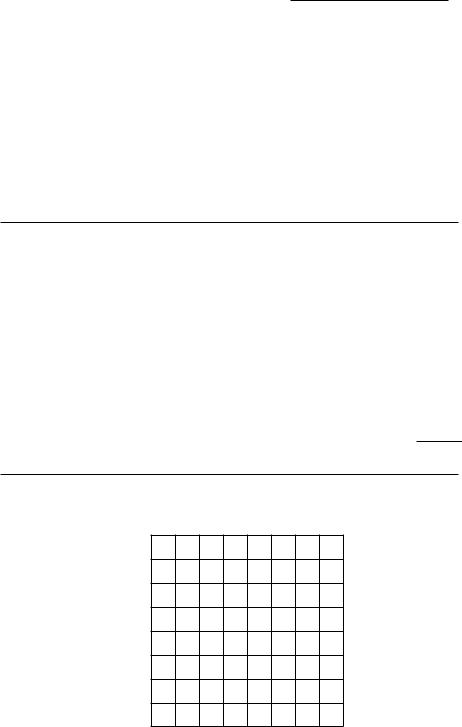
(a) On the graph below, sketch the locus of points that Martha ¯nds indi®erent to having 8 ounces of animal crackers and 2 ounces of beans. Also sketch the locus of points that she ¯nds indi®erent to having 6 ounces of animal crackers and 4 ounces of beans.
Beans
8
6
4
2
0 |
2 |
4 |
6 |
8 |
|
|
Animal crackers |
||
(b) Bertha Brassy has preferences represented by the utility function V (a; b) = 1; 000a2b2, where a is the number of ounces of animal crackers that she consumes and b is the number of ounces of beans that she consumes. On the graph below, sketch the locus of points that Bertha ¯nds indi®erent to having 8 ounces of animal crackers and 2 ounces of beans. Also sketch the locus of points that she ¯nds indi®erent to having 6 ounces of animal crackers and 4 ounces of beans.

Beans
8
6
4
2
0 |
2 |
4 |
6 |
8 |
|
|
Animal crackers |
||
(c) Are Martha's preferences convex? |
|
Are Bertha's? |
.
(d) What can you say about the di®erence between the indi®erence curves you drew for Bertha and those you drew for Martha?
.
(e) How could you tell this was going to happen without having to draw the curves?
.
4.11 (0) Willy Wheeler's preferences over bundles that contain nonnegative amounts of x1 and x2 are represented by the utility function
U(x1; x2) = x21 + x22.
(a) Draw a few of his indi®erence curves. What kind of geometric ¯g-
ure are they? |
|
|
Does Willy have |
|
convex preferences? |
|
|
. |
|

x2
8
6
4
2
0 |
2 |
4 |
6 |
8 |
|
|
|
|
|
|
|
|
|
x1 |
|
||
|
|
|
|
|
|
|
|
|
|
|
|
|
|
|
|
|
|
|
|
|
|
|
|
|
|
|
|
|
|
|
|
|
|
|
|
|
|
|
|
|
|
|
|
|

home runs, then A = S +D+T +H +W and B = S +W +2D+3T +4H.) Let N be the number of times the batter bats. Then his index of runs created in the season is de¯ned to be AB=N and will be called his RC.
(a) In 1987, George Bell batted 649 times. He had 39 walks, 105 singles, 32 doubles, 4 triples, and 47 home runs. In 1987, Wade Boggs batted 656 times. He had 105 walks, 130 singles, 40 doubles, 6 triples, and 24 home runs. In 1987, Alan Trammell batted 657 times. He had 60 walks, 140 singles, 34 doubles, 3 triples, and 28 home runs. In 1987, Tony Gwynn batted 671 times. He had 82 walks, 162 singles, 36 doubles, 13 triples, and 7 home runs. We can calculate A, the number of hits plus walks, B the number of total bases, and RC, the runs created index for each of these players. For Bell, A = 227, B = 408, RC = 143. For Boggs, A = 305, B = 429, RC = 199. For Trammell, A = 265, B = 389, RC = 157. For
Gwynn, A = |
|
, B = |
|
, RC = |
|
. |
(b) If somebody has a preference ordering among these players, based only on the runs-created index, which player(s) would she prefer to Trammell?
.
(c) The di®erences in the number of times at bat for these players are small, and we will ignore them for simplicity of calculation. On the graph below, plot the combinations of A and B achieved by each of the players. Draw four \indi®erence curves," one through each of the four points you have plotted. These indi®erence curves should represent combinations of A and B that lead to the same number of runs-created.
Number of total bases
480
400
320
240
160
80
0 |
60 |
120 |
180 |
240 |
300 |
360 |
|
|
|
Number of hits plus walks |
|||

4.14 (0) This problem concerns the runs-created index discussed in the preceding problem. Consider a batter who bats 100 times and always either makes an out, hits for a single, or hits a home run.
(a) Let x be the number of singles and y be the number of home runs in 100 at-bats. Suppose that the utility function U(x; y) by which we evaluate alternative combinations of singles and home runs is the runscreated index. Then the formula for the utility function is U(x; y) =
.
(b) Let's try to ¯nd out about the shape of an indi®erence curve between singles and home runs. Hitting 10 home runs and no singles would give
him the same runs-created index as hitting |
|
singles and no home |
runs. Mark the points (0; 10) and (x; 0), where U(x; 0) = U(0; 10).
(c) Where x is the number of singles you solved for in the previous part, mark the point (x=2; 5) on your graph. Is U(x=2; 5) greater than or less
than or equal to U(0; 10)? |
|
Is this consistent with the |
batter having convex preferences between singles and home runs?
.
Home runs
20
15
10
5
0 |
5 |
10 |
15 |
20 |
|
|
|
|
Singles |

You have studied budgets, and you have studied preferences. Now is the time to put these two ideas together and do something with them. In this chapter you study the commodity bundle chosen by a utility-maximizing consumer from a given budget.
Given prices and income, you know how to graph a consumer's budget. If you also know the consumer's preferences, you can graph some of his indi®erence curves. The consumer will choose the \best" indi®erence curve that he can reach given his budget. But when you try to do this, you have to ask yourself, \How do I ¯nd the most desirable indi®erence curve that the consumer can reach?" The answer to this question is \look in the likely places." Where are the likely places? As your textbook tells you, there are three kinds of likely places. These are: (i) a tangency between an indi®erence curve and the budget line; (ii) a kink in an indi®erence curve; (iii) a \corner" where the consumer specializes in consuming just one good.
Here is how you ¯nd a point of tangency if we are told the consumer's utility function, the prices of both goods, and the consumer's income. The budget line and an indi®erence curve are tangent at a point (x1; x2) if they have the same slope at that point. Now the slope of an indi®erence curve
at (x1; x2) is the ratio ¡MU1(x1; x2)=MU2(x1; x2). (This slope is also known as the marginal rate of substitution.) The slope of the budget line
is ¡p1=p2. Therefore an indi®erence curve is tangent to the budget line
at the point (x1; x2) when MU1(x1; x2)=MU2(x1; x2) = p1=p2. This gives us one equation in the two unknowns, x1 and x2. If we hope to solve
for the x's, we need another equation. That other equation is the budget equation p1x1 + p2x2 = m. With these two equations you can solve for (x1; x2).¤
A consumer has the utility function U(x1; x2) = x21x2. The price of good 1 is p1 = 1, the price of good 2 is p2 = 3, and his income is 180. Then,
MU1(x1; x2) = 2x1x2 and MU2(x1; x2) = x21. Therefore his marginal rate of substitution is ¡MU1(x1; x2)=MU2(x1; x2) = ¡2x1x2=x21 = ¡2x2=x1.
This implies that his indi®erence curve will be tangent to his budget line when ¡2x2=x1 = ¡p1=p2 = ¡1=3. Simplifying this expression, we have 6x2 = x1. This is one of the two equations we need to solve for the two unknowns, x1 and x2. The other equation is the budget equation. In this case the budget equation is x1 + 3x2 = 180. Solving these two equations in two unknowns, we ¯nd x1 = 120 and x2 = 20. Therefore we know that
¤ Some people have trouble remembering whether the marginal rate of substitution is ¡MU1=MU2 or ¡MU2=MU1. It isn't really crucial to remember which way this goes as long as you remember that a tangency happens when the marginal utilities of any two goods are in the same proportion as their prices.
the consumer chooses the bundle (x1; x2) = (120; 20).
For equilibrium at kinks or at corners, we don't need the slope of the indi®erence curves to equal the slope of the budget line. So we don't have the tangency equation to work with. But we still have the budget equation. The second equation that you can use is an equation that tells you that you are at one of the kinky points or at a corner. You will see exactly how this works when you work a few exercises.
A consumer has the utility function U(x1; x2) = minfx1; 3x2g. The price of x1 is 2, the price of x2 is 1, and her income is 140. Her indi®erence curves are L-shaped. The corners of the L's all lie along the line x1 = 3x2. She will choose a combination at one of the corners, so this gives us one of the two equations we need for ¯nding the unknowns x1 and x2. The second equation is her budget equation, which is 2x1 + x2 = 140. Solve these two equations to ¯nd that x1 = 60 and x2 = 20. So we know that the consumer chooses the bundle (x1; x2) = (60; 20).
When you have ¯nished these exercises, we hope that you will be able to do the following:
²Calculate the best bundle a consumer can a®ord at given prices and income in the case of simple utility functions where the best a®ordable bundle happens at a point of tangency.
²Find the best a®ordable bundle, given prices and income for a consumer with kinked indi®erence curves.
²Recognize standard examples where the best bundle a consumer can a®ord happens at a corner of the budget set.
²Draw a diagram illustrating each of the above types of equilibrium.
²Apply the methods you have learned to choices made with some kinds of nonlinear budgets that arise in real-world situations.
5.1(0) We begin again with Charlie of the apples and bananas. Recall
that Charlie's utility function is U(xA; xB) = xAxB. Suppose that the price of apples is 1, the price of bananas is 2, and Charlie's income is 40.
(a) On the graph below, use blue ink to draw Charlie's budget line. (Use a ruler and try to make this line accurate.) Plot a few points on the indi®erence curve that gives Charlie a utility of 150 and sketch this curve with red ink. Now plot a few points on the indi®erence curve that gives Charlie a utility of 300 and sketch this curve with black ink or pencil.
