

10 WinDali Simulation Interface |
67 |
10 WinDali Simulation Interface
When you start the simulation program you will see the following screen (not all windows will be expanded):
Figure 14. Simulation Program.
The items in the program are:
•Plot Window 1 and 2, where results are plotted. You can add as many plots as you want. Normally only Plot Window 1 is open, but you can display number 2 by pressing 
•Curve Window, where the variables you can plot will be displayed. If both plot 1 and 2 are visible, then the first column checkboxes select curves in plot 1 and the second column selects curves in plot 2.
•Message Window, which has two pages:
o Solver, where messages from the solver are displayed.
oDebug, where debug messages from the model are displayed.
•Data window where you can inspect the numerical values of the selected variables. You bring up the data window by pressing 
•Online parameters where you can change parameters during the simulation (see chapter 10.2).
WinDali |
Morten Juel Skovrup |

68 10 WinDali Simulation Interface
The look of the Simulation Interface program will change according to the model that is loaded. As default the following pages will be created:
General
TStart |
Start time for simulation |
Tend |
End time for simulation |
Initial state |
The state the simulation should start in |
Save data to ASCII |
Saves data to an ASCII or a binary file. When you start the simulation, a |
or binary file |
dialog where you can select what to save will appear. If you save to a |
|
binary file you can use the Post Process application to display the data |
|
when you have finished – see chapter 12 |
Save All Data |
Saves all data |
Only plotted data |
Saves only data which is plotted (see below) |
Plot result |
If not selected no data will be plotted. If you save data to disk, and you are |
|
not interested in the plots, this will speed up the simulation. |
Max points on a |
Decides how many points a curve can contain. Each point on a curve is |
curve |
stored in memory during simulation. If you work with very long |
|
simulations you could eventually fill up the computer memory, if this |
|
number is too large. When this number is reached, the program starts to |
|
delete old points when a new point arrives. Note that if you do not save |
|
data to disk you will lose old data when this number is reached. |
Remember points |
If unchecked the points on curves you are not watching (i.e. unchecked |
|
curves in the curve window) will not be stored. |
Only plot at X pct. |
If checked then points are only changed if the slope of the curve changes |
change |
more that the percentage specified. |
Plot every X point |
If for example 10 then only every tenth point will be plottet |
Repeat simulation |
Specifies the number of times the simulation should be repeated. Together |
|
with Update initial values (see later) you can use this to get a periodic |
|
stationary solution. |
Infinite simulation |
If checked then the simulation runs until you press Stop. The plot window |
|
size defines the time range shown in the plot windows. |
Real time |
If checked then the simulation will be run in real time. You can also |
simulation |
specify how often the screen (plots and data) should be updated. When |
|
running real time simulations, you can control the speed of the simulation |
|
by adjusting the slider. The maximum speed depends on the screen update |
|
value you specify (it equals 1000·the screen update value). A speed of 1 |
|
means that one simulated second will take 1 second in real time. A speed |
|
of 1000 means that 1000 simulated seconds will take 1 second in real time. |
|
The max speed will also depend on how fast the solver is able to actually |
|
solve the equations, so the value of the speed slider is not always accurate. |
Messages |
Decides how to display messages from the solver (debug messages will |
|
always be added to the Message Window). |
|
• None, no messages are displayed (if you after a simulation change |
|
Messages from None to Display you will be able to see debug |
|
messages). |
|
• Screen, messages are shown on screen |
|
• File, messages are saved to a file you specify. |
WinDali |
Morten Juel Skovrup |

10 WinDali Simulation Interface |
69 |
Solver
Use external static… |
Use an external static equations solver to solve the static equations at the |
|
initial point, and to solve the static equations the first time after a state |
|
shift. This functionality is included because the solver included in |
|
WinDali has a fast but not always stable static equations solver. |
|
Sometimes it is necessary to solve the static equations the first time by |
|
using the more stable (but also slower) external equation solver. After |
|
the first solution is obtained, the internal static equation solver is |
|
normally sufficient. |
External solver |
A list of external solvers that can be used |
Use fixed sample |
If checked the solver will be forced to create a solution at the sample |
time |
time you specify – i.e. if you specify a sample time of 10 seconds, then |
|
the solver will make a solution at Time=10, Time=20 etc. but it might |
|
also produce solutions in between the samples. |
The contents of the Solver page also depends on the solver you have loaded (see 10.4).
Initial
This page will only be created if the model has dynamic variables. The page allows you to change the default initial values for the dynamic variables.
The program automatically creates a checkbox called Update initial values, that when checked:
•Updates the initial values to the last solution point in the simulation when the simulation ends.
•Updates the initial state to the state the model was in, when the simulation ended.
Guesses
The Guesses page will automatically be created if the model contains static variables. The page allows you to change the default guesses for the static variables in the different states.
The program automatically creates a checkbox called Update guesses, that when checked updates the guesses on the static variables in all states. The guesses in a state are updated to the first solution found when the model was in that state.
The page also has a checkbox called “No model guess”, which if checked prevent the loaded model from providing any guesses it might want to set (i.e. calls to SetGuess from the model are prevented).
Results
If the model includes extra variables that are not plotted, their value will be displayed on this page when the simulation stops.
Cases
- see chapter 10.3
WinDali |
Morten Juel Skovrup |
70 10 WinDali Simulation Interface
10.1 Menu commands
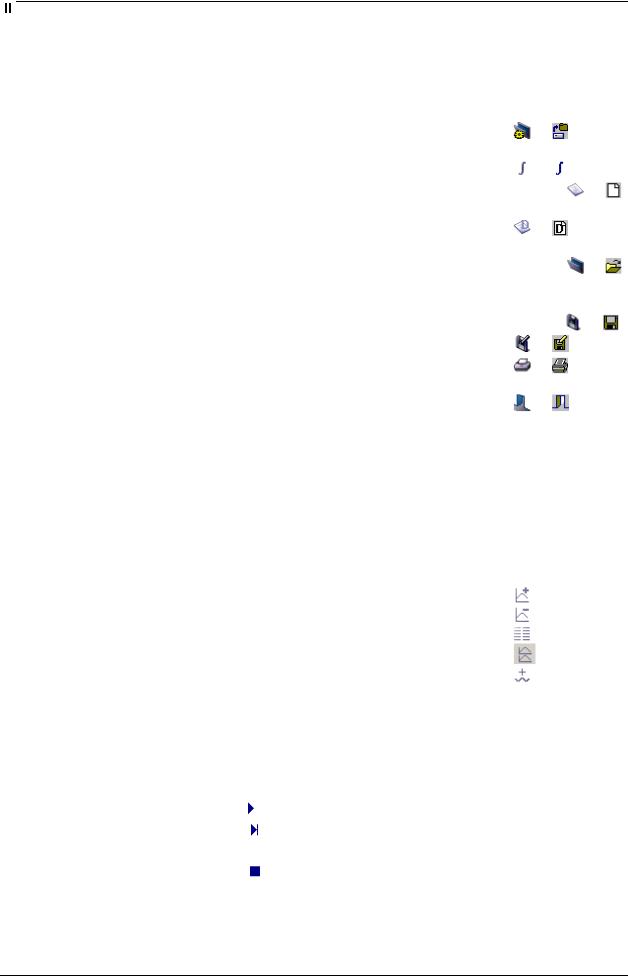
File menu
Item |
Explanation |
Shortcut/toolbar |
|
Open Model |
Open a new model. The icon on the toolbar keeps a list over |
or |
|
|
previously opened models. |
|
|
Open Solver |
Loads a new Solver. |
or |
|
New |
Clears the filename that the user previously has saved the |
Ctrl+N, |
or |
|
settings under. |
|
|
Default |
Load the settings from the model-file and ignore if a default |
or |
|
|
settings-file exists (see below) |
|
|
Open |
Open a settings file. A settings file includes all information |
Ctrl+O, |
or |
|
of the parameters the user can change in the Simulation |
|
|
|
program. Settings files have extension .set |
|
|
Save |
Save settings. |
Ctrl+S, |
or |
Save as |
Save settings with a new file name. |
or |
|
Print Report |
Print report of a simulation. The report can contain settings |
or |
|
|
and plots. The print will contain the current date and time. |
|
|
Exit |
Exit the simulation program. |
or |
|
If you save a settings file with the same name as the model file (but with extension .set) this file will be loaded as default when the model is loaded.
The Plot, Edit, Draw, View and Format menus are explained in the accompanying help file (select the Help|Plot menu), except for the following items in the plot menu:
Plot menu
Item |
|
Explanation |
|
|
|
|
Shortcut/toolbar |
|
Add plot |
|
Add a new plot page |
|
|||||
Delete plot |
Delete a plot page |
|
||||||
Data window |
Show/hide data window |
|
||||||
Second plot |
Show/hide the second plot on a page |
|
||||||
Create curve |
Create a curve by combining two existing curves (phase |
|
||||||
|
|
|
plot) |
|
|
|
|
|
Next plot |
Move to next plot |
F9 |
||||||
Previous plot |
Move to previous plot |
F10 |
||||||
Simulation menu |
|
|
|
|
|
|||
Item |
|
Explanation |
Shortcut/toolbar |
|
|
|||
Start |
|
Start simulation |
F2 / |
|
|
|||
Step |
|
Make one step |
F3 / |
|
|
|||
Pause |
|
Pause the simulation |
F4 / |
|
|
|
|
|
|
|
|
||||||
Stop |
|
Stop simulation |
F5 / |
|
|
|||
WinDali |
Morten Juel Skovrup |
10 WinDali Simulation Interface |
71 |
Tools menu
Environment options |
See below |
Create distributable copy |
See chapter 13 |
Configure tools |
Allow you to add program items to the Tools menu. |
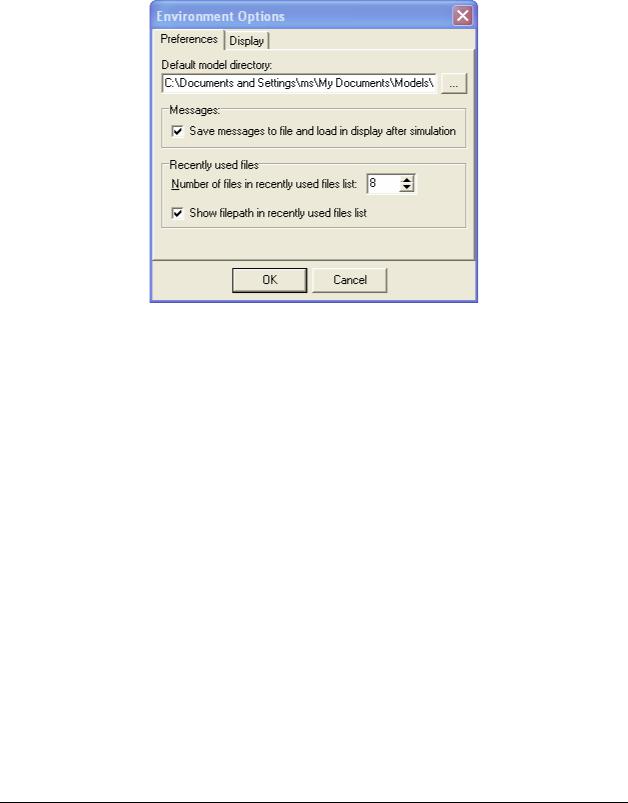
The environments options dialog allows you to customize the Simulation Program.
Preferences |
|
Figure 15. Environment Options. |
|
|
|
Default model directory |
Default location of your models |
|
Save messages to file |
|
Makes the simulation run faster. If the solver (Dali.sol) encounters |
and load in display after |
problems it will react by outputting a lot of information. If you |
|
simulation |
|
choose to display messages while the simulation runs (option |
|
|
unchecked) then the simulation might be very slow. |
Display |
|
|
Colored checkboxes |
Makes the checkboxes in the Curve Window the same color as the |
|
|
curves. |
|
Toolbar images |
Can be: |
|
|
|
Default: Default windows icons Blue: |
|
|
More colorful icons |
WinDali |
Morten Juel Skovrup |