

Assembly Language Step by Step 1992
.pdfSeveral of the general-purpose registers (BX, BP, SP, SI, and DI) may contain an offset address. This offset address may be used in combination with any of the segment registers to pinpoint any one of the 1,048,576 bytes in the mega-byte address space of the 8086/8088. All you need to do is specify which two registers are to be used together, with the segment register first and the general-purpose register second. For example:
SS : SP
SS : BP
ES : DI
DS : SI
CS : BX
Register Halves
General-purpose registers AX, BX, CX, and DX have an important property: they can be cut in half. Actually, assemblers recognize special names for the two halves of these four registers. The A, B, C, and D are retained, but instead of the X, a half is specified with an "H" for "High half or an "L" for "Low half." Each register half is one byte (eight bits) in size, allowing the entire register to be 16 bits in size, or one word.
Thus, making up the 16-bit register AX you have byte-sized register halves AH and AL; within BX there is BH and BL, and so on. One nice thing about this arrangement is that you can read and change one half of a 16-bit number without disturbing the other half.
This means that if you place the 16-bit hexadecimal value 76E9H into register AX, you can read the byte-sized value 76H from register AH, and OE9H from register AL. Better still, if you then store the value OAH into register AL and then read back register AX, you'll find that the original value of 76E9H has been changed to 760AH.
Being able to treat the AX, BX, CX, and DX registers as 8-bit halves can be extremely handy in situations where you're manipulating a lot of 8-bit quantities. Each register half can be considered a separate register, leaving you twice the number of places to put things while your program works. As you'll see later on, finding a place to stick a value in a pinch is one of the great challenges facing assembly-language programmers.
Keep in mind that this dual nature involves only general-purpose registers AX, BX, CX, and DX. The other general-purpose registers SP, BP, SI, and DI, are not similarly equipped. There are no SIH and SIL 8-bit registers, for example, as convenient as that would sometimes be.
The Instruction Pointer
Yet another type of register lives inside the 8086/8088 CPU. The instruction pointer (usually called IP) is in a class by itself. IP is far more of a specialist than are any of the segment registers. IP can do only one thing: it contains the offset address of the next machine instruction to be executed.
While executing a program, the CPU uses IP to keep track of where it is. Each time an instruction is executed, IP is incremented by some number of bytes. The number of
bytes is the size of the instruction just executed. The net result is to bump IP further into
memory, so that it points to the start of the next instruction to be executed. Instructions come in different sizes, ranging typically from one to six bytes. (Some of the more arcane forms of the more arcane instructions may be even larger.) The CPU is careful to increment IP by just the right number of bytes, so that it does in fact end up pointing to the start of the next instruction, and not merely into the middle of the last instruction.
If IP contains the offset address of the next machine instruction, where is the segment address? The segment address is kept in the code segment register CS. Together, CS and IP contain the full 20-bit address of the next machine instruction to be executed.
The full 20-bit address of the next machine instruction to be executed is kept CS:IP. A code segment is an area of memory where machine instructions are stored. The steps and tests of which a program is made are contained in code segments. There may be many code segments in a program, but small programs like the ones in this book will most likely have only one. The current code segment is that code segment whose segment address is currently stored in code segment register CS. At any given time, the machine instruction currently being executed exists within the current code segment.
Typically, large programs are divided up into chunks, with each chunk considered to be part of a separate code segment. Switching from one code segment to another is done with a class of instructions called branching instructions, which I'll be covering in Chapter 9.
IP is notable in being the only register that can neither be read nor written to directly. It's possible to obtain the current value of IP, but the method involves some trickery that will have to wait until we discuss branching instructions in Chapter 9.
The Flags Register
There is one additional type of register inside the CPU: the Flags register. The Flags register is 16 bits in size, and most of those 16 bits are single-bit registers called flags. Each of these individual flags has a name, like CF, DF, OF, and so on.
When your program performs a test, what it tests is one or another of the single-bit flags in the Flags register. Since a single bit may contain one of only two values, 1 or 0, a test in assembly language is truly a two-way affair: either a flag is set to 1 or it isn't. If the flag is set to 1, the program takes one action; if the flag is set to 0, the program takes a different action.
We're concentrating on memory addressing at the moment, so for now I'll simply promise to go into flag lore in more detail at more appropriate moments later in the book.
Reading and Changing Registers with DEBUG
The DOS DEBUG utility provides a handy window into the CPU's hidden world of registers. How DEBUG does this is the blackest of all black arts and I can't begin to explain it in an introductory text. For now, just consider DEBUG a magic box.
Looking at the registers from DEBUG doesn't even require that you load a program into DEBUG. Simply run DEBUG, and at the dash prompt, type R. The display will look something very close to this:
-r |
|
|
|
AX=0000 BX=0000 CX=0000 DX=0000 |
SP=FFEE |
BP=0000 SI=0000 DI=0000 |
|
DS=1980 ES=1980 SS=1980 CS=1980 |
IP=0100 |
NV UP El PL NZ NA PO NC |
|
1980:0100 389A5409 |
CMP [BP+SI+0954],BL |
||
SS:0954=8A |
|
|
|
I say "something very close" because details of the display will vary depending on what resident programs you have loaded in memory, which version of DOS you're using, and so on. What will vary will be the values listed as present in the various registers, and the machine instruction shown in the third line of the display (Here, CMP [BP+SI+0954], BL).
What will not vary is the fact that every CPU register has its place in the display, along with its current value shown to the right of an equal sign. The series of characters NV UP El PL NZ NA PO NC are a summary of the current values of the flags in the flags register.
The display shown above is that of the registers when no program has been loaded. All of the general-purpose registers except for SP have been set to 0, and all of the segment registers have been set to the value 1980H. These are the default conditions set up by DEBUG in the CPU when no program has been loaded. (The 1980H value will probably
be different for you—it represents the first available segment in memory above DOS, and where that segment falls depends on what else exists in memory both above and below DOS.)
Changing a register is done very simply, again using DEBUG's R command. To change the value of AX, type R AX:
-R AX
AX:0000
:OA7B
DEBUG will respond by displaying the current value of AX, and then, on the following line, a colon prompt. DEBUG will then wait for you to either enter a new numeric value for AX or press Enter. If you press Enter, the current value of the register will not be changed. In the example shown above, I typed OA7B (you needn't type the H indicating hex) and then pressed Enter.
Once you do enter a new value and then press Enter, DEBUG does nothing to verify the change. To see the change to register AX, you must display all the registers again using the R command:
-r
AX=OA7B |
BX=0000 |
CX=0000 DX=0000 |
SP=FFEE |
BP=0000 SI=0000 01=0000 |
||
DS-1980 |
ES=1980 |
SS=1980 CS=1980 |
IP=0100 |
|
NV UP EI PL NZ NA PO NC |
|
1980:0100 389A5409 |
CMP [BP+SI+0954],BL |
SS:0954=8A |
||||
Take a few minutes to practice entering new values for the general-purpose registers, then display the registers as a group to verify that the changes were made. While exploring you might find that the IP register can be changed, even though I said earlier that it can't be changed directly. The key word is directly-, DEBUG knows all the dirty tricks.
Inspecting the Video Refresh Buffer with DEBUG
One good way to help your knowledge of memory addressing sink in is to use DEBUG to take a look at some interesting places in the PC's memory space.
One easy thing to do is look at the PC's video display adapter's refresh buffer. A video refresh buffer is a region of memory with a difference: any characters written to buffer memory are instantly displayed on the computer screen. This screen refresh feature is accomplished electrically through special use of the information that comes out of the memory data pins. Precisely how it is done is outside the scope of this book. For now, simply understand that writing a character to your display screen can be done by writing the ASCII code for that character into the correct address in the video refresh buffer portion of memory.
As with any memory location anywhere within the PC, the video refresh buffer has a segment address. What that segment address is depends on the kind of display installed in the PC. There are two possibilities: if your PC has a color screen, the segment address of the video refresh buffer is 0B800H; if your PC has a monochrome screen, the segment address is 0B000H.
It takes two bytes in the buffer to display a character. The first of the two (that is, first in memory) is the ASCII code of the character itself. For example, an "A" would require the ASCII code 41H; a "B" would require the ASCII code 42H, and so on. (The full ASCII code set is shown in Appendix B.) The second of the two bytes is the character's attribute. Think of it this way: the ASCII code says what character to display and the attribute says how to display it. The attribute dictates the color of a character and its background cell on a color screen. On a monochrome screen, the attribute specifies if a character is underlined or displayed in reverse video. (Reverse video is a character display mode that shows dark characters on a light background, rather than the traditional light character on a dark or black background.) Every character byte has an attribute byte and every attribute byte has its character byte; neither can exist alone.
The very first character/attribute pair in the video refresh buffer corresponds to the character you see in the upper-left corner of the screen. The next character/attribute pair in the buffer is the character at the second position on the top line of the screen, and so on. I've drawn a diagram of the relationship between characters on the screen and byte values in the video refresh buffer, in Figure 5.4.
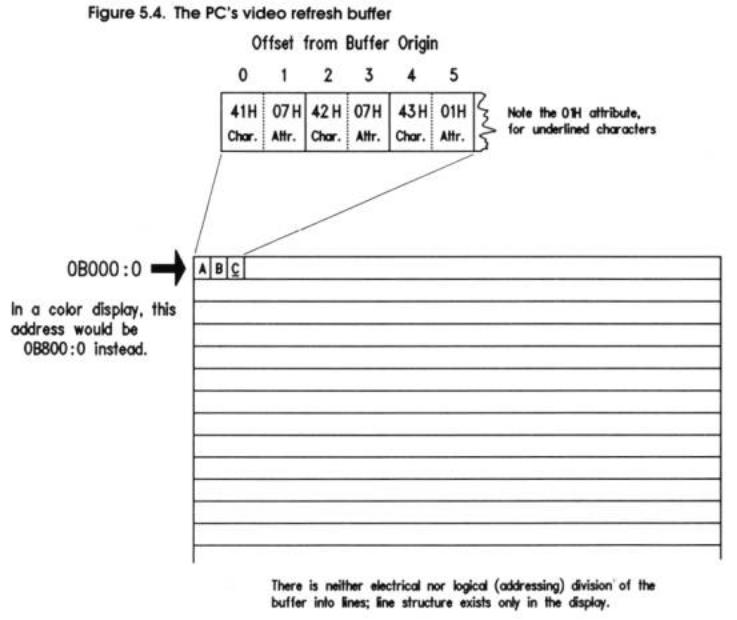
In Figure 5.4, the three letters "ABC" are displayed in the upper-left corner of the screen. Notice that the "C" is underlined. The screen shown in Figure5.4 is monochrome. The video refresh buffer therefore begins at 0B000:0. The byte located at address 0B000:0 is ASCII code 41H, corresponding to the letter "A." The byte at address 0B00:0001 is the corresponding attribute value of 07H. The value 07H as an attribute dictates normal text in both color and monochrome displays, where normal means white characters on a black background.
The byte at 0B000:0005 is also an attribute byte, but its value is 01H. On a monochrome display, 01H makes the corresponding character underlined. On a color display, 01H makes the character blue on a black background.
There is nothing about the video refresh buffer to divide it into the lines you see on the display. The first 160 characters (80 ASCII codes plus their 80 attribute bytes) are shown as the first line, and the next set of 160 characters is shown on the next line down, and so
on.
You might rightfully ask what ASCII code is in the video refresh buffer for locations on the screen that show no character at all. The answer, of course, is that there is a character in every "empty" space: the space character, whose ASCII code is 20H.
You can inspect the memory within the video refresh buffer directly through DEBUG, by following these steps:
1.Clear the screen by entering CLS at the DOS prompt and then pressing Enter.
2.Invoke DEBUG.
3.Enter the segment address of your video refresh buffer into the ES register by using the R command. Remember: Color screens use the 0B800H segment address, while monochrome screens use the 0B000H segment address. Note that 0B800H must be entered into DEBUG as "B800," without the leading zero. TASM and MASM must have that leading zero, and DEBUG cannot have it. Sadly, no one ever said that all parts of this business had to make perfect sense.
4.Enter D ES:0 to dump the first 128 bytes of the video refresh buffer.
5.Enter the D command (by itself) a second time to dump the next 128 bytes of the video refresh buffer.
What you'll see should look a lot like the session dump shown below:
C:\ASM>debug -r |
es ES 1980 :b800 -d es:0 |
20 07 20 07 20 07 |
|||||||||
B800:0000 20 07 |
20 07 20 |
07 |
20 |
07-20 07 |
|||||||
B800:0010 20 07 |
20 07 20 |
07 |
20 |
07-20 07 |
20 07 20 07 20 07 ........ |
||||||
B800:0020 20 |
07 |
20 07 20 |
07 |
20 |
07-20 |
07 |
20 07 |
20 |
07 |
20 |
07 ........ |
B800:0030 20 |
07 |
20 07 20 |
07 |
20 |
07-20 |
07 |
20 07 |
20 |
07 |
20 |
07 ........ |
B800:0040 20 |
07 |
20 07 20 |
07 |
20 |
07-20 |
07 |
20 07 |
20 |
07 |
20 |
07 ........ |
B800:0050 20 |
07 |
20 07 20 |
07 |
20 |
07-20 |
07 |
20 07 |
20 |
07 |
20 |
07 |
B800:0060 |
20 07 |
20 |
07 20 07 |
20 07-20 07 |
20 07 |
20 07 |
20 07 ........ |
|
B800:0070 |
20 07 |
20 |
07 20 07 |
20 07-20 07 |
20 07 |
20 07 |
20 07 ........ |
|
-d |
|
|
|
|
|
|
|
|
B800:0080 |
20 07 |
20 |
07 20 07 |
20 07-20 07 |
20 07 |
20 07 |
20 07 ........ |
|
B800:0090 |
20 07 |
20 |
07 20 07 |
20 07-20 07 |
20 07 |
20 07 |
20 07 ........ |
|
B800:00A0 |
43 07 |
3A |
07 5C 07 |
41 07-53 07 |
4D 07 |
3E 07 |
64 07 C.:.\A.S.M.>.d. |
|
B800:00B0 65 07 62 07 75 07 |
67 07-20 |
07 |
20 07 |
20 07 20 07 |
||||
e.b.u.g..... |
20 07 |
20 |
07 20 07 |
20 07-20 |
07 |
20 07 |
20 07 |
20 07 |
B800:0000 |
||||||||
B800:0000 |
20 07 |
20 |
07 20 07 |
20 07-20 |
07 |
20 07 |
20 07 |
20 07 ........ |
B800:OOEO |
20 07 |
20 |
07 20 07 |
20 07-20 |
07 |
20 07 |
20 07 |
20 07 ........ |
8800:OOFO 20 07 20 07 20 07 20 07-20 07 20 07 20 07 20 07 ........
The first 80 character/attribute pairs are the same: 20H/07H, which display as plain ordinary blank space. When you execute the CLS command on most machines, the screen is cleared, and the DOS prompt reappears on the second line from the top of the screen, not the top line. The top line is typically left blank, as is the case here.
You'll see in the second block of 128 dumped bytes the DOS prompt and the invocation of DEBUG in lowercase. Keep in mind when reading DEBUG hex dumps that any character not readily displayed as one of the standard ASCII letters, numbers, or punctuation marks is represented as a period character. This is why the 07H attribute character on the right portion of DEBUG's display is shown as a period character, since the ASCII code 07H has no displayable equivalent.
You can keep dumping further into the video refresh buffer by pressing DEBUG's D command repeatedly.
Reading the BIOS Revision Date
Another interesting item that's easy to locate in your PC is the revision date in the ROM BIOS. Read-only memory (ROM) chips are special memory chips that retain their contents when power to the PC is turned off. The BIOS (Basic Input/ Output System) is a collection of assembly-language routines that perform basic services for the PC: disk handling, video handling, printer handling, etc. The BIOS is kept in ROM at the very top of the PC's megabyte of address space.
The BIOS contains a date, indicating when it was declared finished by its authors. This date is always at the same address, and can be easily displayed using DEBUG's D command. The address of the date is 0FFFF:0005. The DEBUG session is shown below. Note again that the hex number 0FFFFH must be entered without its leading zero:
-d ffff:0005 |
|
|
30 34 2F-33 30 2F 38 37 00 FC BB |
04/30/87... |
||||||||
FFFF:0000 |
|
00 00 00 |
||||||||||
FFFF:0010 00 00 |
00 |
00 00-00 |
00 |
00 00 |
00 |
00 00 |
00 |
..... |
||||
FFFF:0020 00 |
00 |
00 00 00 |
00 |
00-00 |
00 |
00 |
00 |
00 |
00 |
00 00 |
00 |
..... |
FFFF:0030 00 |
00 |
00 00 00 |
00 |
00-00 |
00 |
00 |
00 |
00 |
00 |
00 00 |
00 |
..... |
FFFF:0040 |
00 00 00 00 |
00 |
00 00 |
00-00 00 |
00 |
00 |
00 |
00 00 |
00 |
FFFF:0050 |
00 00 00 00 |
00 |
00 00 |
00-00 00 |
00 |
00 |
00 |
00 00 |
00 |
FFFF:0060 |
00 00 00 00 |
00 |
00 00 |
00-00 00 |
00 |
00 |
00 |
00 00 |
00 |
FFFF:0070 00 00 00 00 00 00 00 00-00 00 00 00 00 00 00 00 FFFF:0080 00 00 00 00 00
One peculiarity of DEBUG illustrated here is that when you begin a hex dump of memory at an address that is not evenly divisible by 16, DEBUG spaces the first byte of the dump over to the right so that paragraph boundaries still fall at the left margin. Another rather peculiar thing to keep in mind while looking at the dump shown above is that only the first line of memory shown in the dump really exists. The segment 0FFFFH begins only sixteen bytes before the end of the 8086/8088's megabyte of memory space. (See Figure 5.2 for a good illustration of this.) The byte at 0FFFF:000F is the last byte in memory. Addresses from 0FFFF:00l0 to 0FFFF:0FFFF would require more than 20 address bits to express, so they simply don't exist. DEBUG won't tell you that, it'll just give you endless pages of zeroes for memory beyond the 8086/8088 megabyte pale. (Several readers have told me that certain versions of DEBUG take a different approach: DEBUG "wraps" their display around to the bottom of memory instead, and begins displaying bytes at 0000:0000 once it runs out of high memory. It's something to watch out for, and if memory "beyond" the FFFF:000F point are not zeroes, you're in fact seeing such a wrap to low memory.)
Transferring Control to Machine Instructions in ROM
So far we've looked at locations in memory as containers for data. All well and good—but memory contains machine instructions as well. A very effective illustration of a machine instruction at a particular address is also provided by the ROM BIOS—and right next door to the BIOS revision date, at that.
The machine instruction in question is located at address 0FFFF:0. Recall that, by convention, the next machine instruction to be executed is the one whose address is stored in CS:IP. Run DEBUG. Load the value 0FFFFH into code segment register CS, and 0 into instruction pointer IP. Then dump memory at 0FFFF:0:
-r cs
CS 1980 :ffff -r ip IP 0100 :0
-r
AX=0000 BX=0000 CX=0000 DX=0000 SP=FFEE BP=0000 SI=0000 01=0000 DS=1980 ES=1980 SS=1980 CS=FFFF IP=0000 NV UP El PL NZ NA PO NC
FFFFr0000 |
EA5BE000F0 |
JMP F000:E05B |
-d cs:0 |
|
|
FFFF:0000 |
EA 5B EO 00 FO 30 34 2F-33 30 2F 38 37 00 FC B8 .[...04/30/87... |
|
FFFF:0010 |
00 00 00 00 00 00 00 00-00 00 00 00 00 00 00 00 ................ |
|
FFFF:0020 |
00 00 00 00 00 00 00 00-00 00 00 00 00 00 00 00 ................ |
|
FFFF:0030 |
00 00 00 00 00 00 00 00-00 00 00 00 00 00 00 00 ................ |
|
FFFF:0040 |
00 00 00 00 00 00 00 00-00 00 00 00 00 00 00 00 ................ |
|
FFFF:0050 |
00 00 00 00 00 00 00 00-00 00 00 00 00 00 00 00 ................ |
|
FFFF:0060 |
00 00 00 00 00 00 00 00-00 00 00 00 00 00 00 00 ................ |
|
FFFF:0070 |
00 00 00 00 00 00 00 00-00 00 00 00 00 00 00 00 ................ |
|
Look at the third line of the register display, which we've been ignoring up until now. To the right of the address display is this series of five bytes: EA5BE000F0.
These five bytes make up the machine instruction we want. Notice that the first line of the memory dump begins with the same address, and, sure enough, shows us the same five bytes.
Trying to remember what machine instruction EA5BE000F0 is would try anyone's intellect, so DEBUG is a good sport and translates the five bytes into a more readable representation of the machine instruction. We call this process of translating binary machine codes back into human-readable, assembly-language mnemonics unassembly or, more commonly, disassembly.
JMP F000:E05B.
What this instruction does, quite simply, is tell the CPU to "jump" to the address 0F000:0E05B and begin executing the machine instructions located there. If we execute the machine instruction at CS:IP, that's what will happen: the CPU will jump to the address 0F000:OE05B and begin executing whatever machine instructions it finds there. All PC's have a JMP instruction at address 0FFFF:0. The address to which that JMP instruction jumps will be different for different makes and models of PC. This is why on your machine you won't necessarily see the exact five bytes EA5BE000F0, but whatever five bytes you find at 0FFFF:0, they will always begin with 0EAH. The 0EAH byte specifies that this instruction will be a JMP instruction. The remainder of the machine instruction is the address to which the CPU must jump. If that address as given in the machine instruction looks a little scrambled, well, it is.. but that's the way the 86-family of CPUs do things. We'll return to the issue of funny-looking addresses a little later. DEBUG has a command, G (for Go) that begins execution at the address stored in