

Beginning Microsoft Word Business Documents - From Novice To Professional (2006)
.pdf36 |
C H A P T E R 2 ■ C R E A T I N G A B U S I N E S S P L A N |
Figure 2-30. The Table Properties dialog box
To change text alignment, open the Cell tab, shown in Figure 2-31, and specify text alignment properties. You can choose Top, Center, or Bottom. If you want to change text wrapping within cells, click the Options button. Specify whether you want text to wrap to the next line or to fit on one line. Click OK.
Figure 2-31. The Cell tab of the Table Properties dialog box
C H A P T E R 2 ■ C R E A T I N G A B U S I N E S S P L A N |
37 |
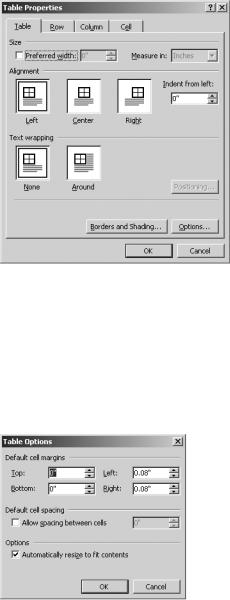
To change the table alignment, open the Table tab in the Table Properties dialog box, as shown in Figure 2-32. Select how you want Word to align the table on the page. For more control, you can specify a left indentation for the table.
Figure 2-32. The Table tab of the Table Properties dialog box
You also have the option of wrapping document text around the table. For business plans, you should turn text wrapping off.
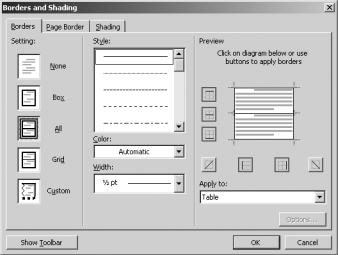
You can specify margins for text within the cell and padding between the cells. This allows you to space your data nicely across the page. To access these controls, as shown in Figure 2-33, click the Options button.
Figure 2-33. Options for specifying cell margins and padding
38 |
C H A P T E R 2 ■ C R E A T I N G A B U S I N E S S P L A N |
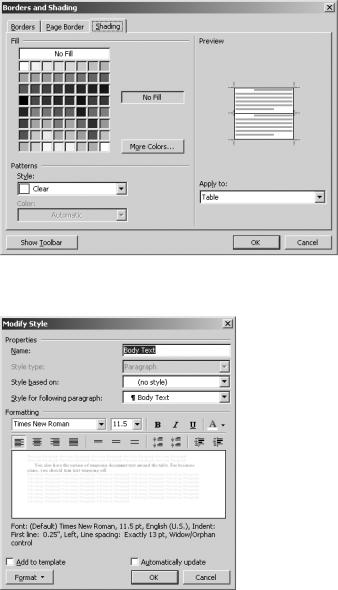
If you want to add borders or shading to cells, click the Borders and Shading button. On the Borders tab, select the border style, color, and width. There are border presets
that will apply the border style you choose to specific areas of the table. Or, you can click in the diagram on the right to specify where you want the borders to appear, as shown in Figure 2-34.
Figure 2-34. Adding borders to a table
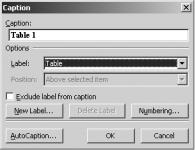
To specify shading, open the Shading tab (see Figure 2-35). Select the color you would like to apply from the color chart. For more options, click More Colors. In the Patterns sections, you can select a shading pattern. Finally, click OK.
To change a table that you’ve AutoFormatted, click in the table. Click Table Table AutoFormat. In the Table AutoFormat dialog box, click Modify. In the Modify Style dialog box, enter a new name for the table style, as shown in Figure 2-36. Then use the controls to change the table formats. When you’re done, click OK and close the Table AutoFormat dialog box.
C H A P T E R 2 ■ C R E A T I N G A B U S I N E S S P L A N |
39 |
Figure 2-35. Adding shading to table cells
Figure 2-36. The Modify Style dialog box
40 |
C H A P T E R 2 ■ C R E A T I N G A B U S I N E S S P L A N |
Adding Captions to Your Tables
You may want to add a caption to your table. The caption helps you identify the table when you refer to it in your business plan.
To insert a caption, select your table. Click Insert Reference Caption. In the Label box, select the type of label. Then specify the position of the label. Enter the caption text in the box labeled Caption. Finally, click OK (see Figure 2-37).
Figure 2-37. The Caption dialog box
Word inserts the caption as a field. The numbering updates automatically if you add more captions or rearrange captioned objects.
Generating Charts from Table Data
The easiest way to create a chart in your business plan is to use existing data that is contained within a table in your document.
To create a chart based on table data, select the chart by clicking inside it. Then click Table Select Table.
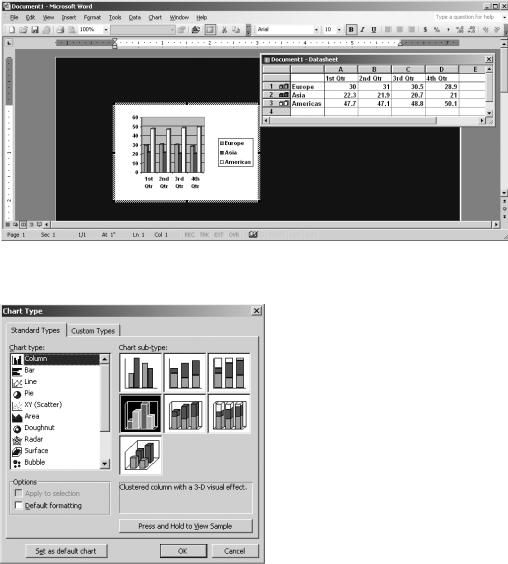
Once you have selected the entire table, click Insert Picture Chart. Word launches Microsoft Graph, which automatically creates a chart based on your table. Additionally, Word adds two new menus, Data and Chart, to the menubar, as shown in Figure 2-38.
These menus will help you manipulate your chart.
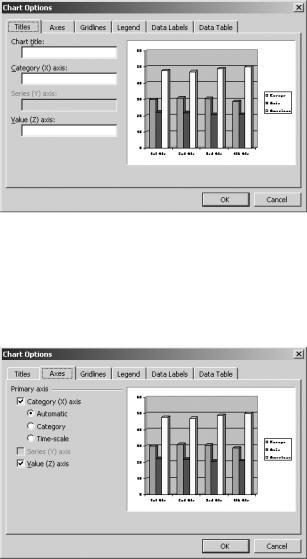
The default chart type is a column chart. But you can change that. To do so, select your chart. Then click Chart Chart Type. The Chart Type dialog box provides you with a number of different chart styles, as you see in Figure 2-39. Simply select the type of chart you would like and click OK. Word returns you to your document and updates the chart automatically.
C H A P T E R 2 ■ C R E A T I N G A B U S I N E S S P L A N |
41 |
Figure 2-38. Inserting a chart
Figure 2-39. The Chart Type dialog box
When you create a chart, Word automatically opens a data sheet where you can modify the information represented in the chart. The first column of the data sheet contains the data series. These are the items that are plotted on the graph. The first row of the data sheet contains the categories. The categories appear along the horizontal axis of the chart. The cells where the rows and columns intersect contain the values.
You can change the way your chart represents the data. Simply choose Data and select Series in Columns or Series in Rows.
42 |
C H A P T E R 2 ■ C R E A T I N G A B U S I N E S S P L A N |
Specifying Chart Options
A good chart will have a clear title, a legend, and labels. You can specify these elements by selecting your chart and then clicking Chart Chart Options. Available options will vary, depending on the type of chart.
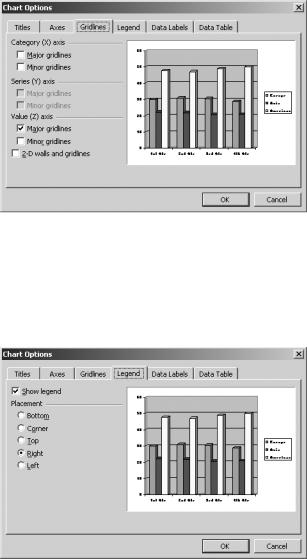
On the Titles tab, shown in Figure 2-40, you can specify a title for the entire chart and titles for the axes. Changes appear immediately in the preview section.
Figure 2-40. The Titles tab of the Chart Options dialog box
On the Axes tab, you can change the labels that appear along each axis (see Figure 2-41). This can prove handy if space is limited. However, be careful not to sacrifice the chart’s clarity.
Figure 2-41. The Axes tab of the Chart Options dialog box
C H A P T E R 2 ■ C R E A T I N G A B U S I N E S S P L A N |
43 |
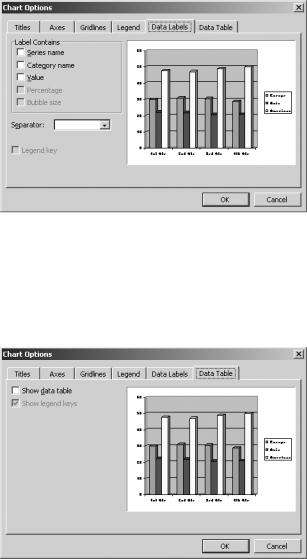
On the Gridlines tab, shown in Figure 2-42, you can specify what gridlines you want to add to the chart, which can make it easier to read a chart.
Figure 2-42. The Gridlines tab of the Chart Options dialog box
Word automatically inserts a legend in your chart. The Legend tab, shown in Figure 2-43, allows you to change the position of the legend. You can also opt to remove the legend from the chart.
Figure 2-43. The Legend tab of the Chart Options dialog box
The Data Labels tab lets you add additional labels to your chart (see Figure 2-44). These labels can bring more clarity to the chart. However, they can also make the chart seem cluttered.
44 |
C H A P T E R 2 ■ C R E A T I N G A B U S I N E S S P L A N |
Figure 2-44. The Data Labels tab of the Chart Options dialog box
The Data Table tab, shown in Figure 2-45, lets you include the table upon which the chart is based in the chart. You may want to use this feature if the data table is on a different page, or if it isn’t clear that the table is related to the chart.
Figure 2-45. The Data Table tab of the Chart Options dialog box
Finally, you have the option of changing the formatting of specific elements of the chart. Simply right-click an element within the chart. Word presents you with appropriate formatting options. The options will vary widely, depending on the type of chart and the chart element you selected.

C H A P T E R 2 ■ C R E A T I N G A B U S I N E S S P L A N |
45 |
Adding Captions to Charts
As with tables, you may want to add a caption to your chart. The caption helps you identify the table when you refer to it in your business plan.
To insert a caption, select the chart. Click Insert Reference Caption. In the Label box, select the type of label, as shown in Figure 2-46. Then specify the position of the label. Enter the caption text in the box labeled Caption. Finally, click OK.
Figure 2-46. The Caption dialog box
Word inserts the caption as a field. The numbering updates automatically if you add more captions or rearrange captioned objects.
Working with Headers and Footers
You should add a header and/or footer to your business plan. While you can use these sections to list important information, use them sparingly.
You should include page numbers in the footer to ensure that the business plan can be reordered easily should someone separate the pages. You should not number the cover page. However, if the table of contents runs over one page, you may want to number it.
To number the table of contents, place your cursor at the top of the first page. Click View Header and Footer. Click the Page Setup button on the Header and Footer toolbar. Use the controls to specify the distance from the edge of the paper (see Figure 2-47). In the Preview section, select This point forward. Click OK.
Scroll down and click within the footer box. On the Formatting toolbar, click the Right Alignment button. Then on the Header and Footer toolbar, click the Insert Page Number button. Click the Format Page Number button. In the Page Number Format dialog box, shown in Figure 2-48, select the number format. For a table of contents, use lowercase Roman numerals. Under Page numbering, select Start at and use the controls to select “i.” Click OK.