

Chapter 1: Introduction to UML
contractor doing the job decided to "wing it" and work without plans. You'd want some blueprints to follow so you can plan and structure the addition before you start working. Odds are, the addition will last longer this way. You wouldn't want the whole thing to come crashing down with the slightest rain.
Models do the same thing for us in the software world. They are the blueprints for systems. A blueprint helps you plan an addition before you build it; a model helps you plan a system before you build it. It can help you be sure the design is sound, the requirements have been met, and the system can withstand even a hurricane of requirement changes.
As you gather requirements for your system, you'll take the business needs of the users and map them into requirements that your team can use and understand. Eventually, you'll want to take these requirements and generate code from them. By formally mapping the requirements to the code, you can ensure that the requirements are actually met by the code, and that the code can easily be traced back to the requirements. This process is called modeling. The result of the modeling process is the ability to trace the business needs to the requirements to the model to the code, and back again, without getting lost along the way.
Visual modeling is the process of taking the information from the model and displaying it graphically using a standard set of graphical elements. A standard is vital to realizing one of the benefits of visual modeling: communication. Communication between users, developers, analysts, testers, managers, and anyone else involved with a project is the primary purpose of visual modeling. You could accomplish this communication using nonvisual (textual) information, but on the whole, humans are visual creatures. We seem to be able to understand complexity better when it is displayed to us visually as opposed to written textually. By producing visual models of a system, we can show how the system works on several levels. We can model the interactions between the users and a system. We can model the interactions of objects within a system. We can even model the interactions between systems, if we so desire.
After creating these models, we can show them to all interested parties, and those parties can glean the information they find valuable from the model. For example, users can visualize the interactions they will make with the system from looking at a model. Analysts can visualize the interactions between objects from the models. Developers can visualize the objects that need to be developed and what each one needs to accomplish. Testers can visualize the interactions between objects and prepare test cases based on these interactions. Project managers can see the whole system and how the parts interact. And chief information officers can look at high−level models and see how systems in their organization interact with one another. All in all, visual models provide a powerful tool for showing the proposed system to all of the interested parties.
Systems of Graphical Notation
One important consideration in visual modeling is what graphical notation to use to represent various aspects of a system. This notation needs to be conveyed to all interested parties or the model will not be very useful. Many people have proposed notations for visual modeling. Some of the popular notations that have strong support are Booch, Object Modeling Technology (OMT), and UML.
Rational Rose supports these three notations; however, UML is a standard that has been adopted by the majority of the industry as well as the standards' governing boards such as ANSI and the Object Management Group (OMG).
9
Chapter 1: Introduction to UML
Booch Notation
The Booch method is named for its inventor, Grady Booch, at Rational Software Corporation. He has written several books discussing the needs and benefits of visual modeling, and has developed a notation of graphical symbols to represent various aspects of a model. For example, objects in this notation are represented by clouds, illustrating the fact that objects can be almost anything. Booch's notation also includes various arrows to represent the types of relationships between objects. We will discuss these types of objects and relationships in Chapter 4, "Use Cases and Actors." Figure 1.5 is a sampling of the objects and relationships represented in the Booch notation.
Figure 1.5: Examples of symbols in the Booch notation
Object Management Technology (OMT)
The OMT notation comes from Dr. James Rumbaugh, who has written several books about systems analysis and design. In an aptly titled book, Object−Oriented Modeling and Design (Prentice Hall, 1990), Rumbaugh discusses the importance of modeling systems in real−world components called objects. OMT uses simpler graphics than Booch to illustrate systems. A sampling of the objects and relationships represented in the OMT notation follows in Figure 1.6.
10

Chapter 1: Introduction to UML
Figure 1.6: Examples of symbols in the OMT notation
Unified Modeling Language (UML)
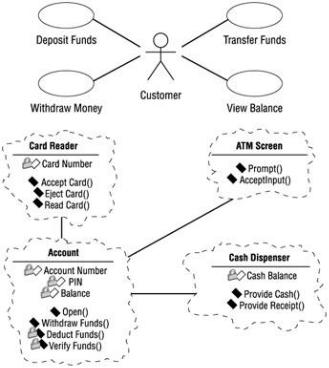
UML notation comes from a collaborative effort of Grady Booch, Dr. James Rumbaugh, Ivar Jacobson, Rebecca Wirfs−Brock, Peter Yourdon, and many others. Jacobson is a scholar who has written about capturing system requirements in packages of transactions called use cases. We will discuss use cases in detail in Chapter 4. Jacobson also developed a method for system design called Object−Oriented Software Engineering (OOSE) that focused on analysis. Booch, Rumbaugh, and Jacobson, commonly referred to as the "three amigos," all work at Rational Software Corporation and focus on the standardization and refinement of UML. UML symbols closely match those of the Booch and OMT notations, and also include elements from other notations. Figure 1.7 shows a sample of UML notation.
11