

01 POWER ISLAND / 02 H2+NH3 / IEA 2022 NetZeroby2050-ARoadmapfortheGlobalEnergySector
.pdf2.7.2Bioenergy and land use change
Modern forms of bioenergy play a key role in achieving net zero emissions in the NZE. Bioenergy is a versatile renewable energy source that can be used in all sectors, and it can often make use of existing transmission and distribution infrastructure and end user equipment. But there are constraints on expanding the supply of bioenergy: with finite potential for bioenergy production from waste streams, there are possible trade offs between expanding bioenergy production, achieving sustainable development goals and avoiding conflicts with other land uses, notably food production.
The level of bioenergy use in the NZE takes account of these constraints: bioenergy demand in 2050 is around 100 EJ. The global sustainable bioenergy potential in 2050 has been assessed to be at least 100 EJ (Creutzig, 2015) and recent assessments estimate a potential between 150 170 EJ when integrating relevant UN Sustainable Development Goals (Frank, 2021; IPCC, 2019; IPCC, 2014; Wu, 2019). However, there is a high degree of uncertainty over the precise levels of this potential. Using modelling developed in co operation with IIASA, here we examine the implications for achieving net zero CO2 emissions by 2050 if the available levels of sustainable bioenergy were to be lower. We also examine what would need to be done to achieve large reductions in emissions from agriculture, forestry and other land use (AFOLU).
Ensuring a sustainable supply of bioenergy
Most liquid biofuels produced today come from dedicated bioenergy crops such as sugarcane, corn or oil crops, often known as conventional biofuels. The expanded use of feedstocks and arable land to produce these biofuels can conflict with food production. In the NZE, there is a shift towards the use of sustainable, certified agricultural products and wood. Biofuel production processes in the NZE use advanced conversion technologies coupled with CCUS where possible (see section 3.3.2). The emphasis is also on advanced bioenergy feedstocks, including waste streams from other processes, short rotation woody crops and feedstocks that do not require the use of arable land. Advanced bioenergy accounts for the vast majority of bioenergy supply in the NZE by 2050. The use of conventional energy crops for biofuel production grows from around 9 EJ in 2020 to around 11 EJ in 2030, but then falls by 70% to 3 EJ in 2050 (including feedstocks consumed in the biofuel production processes).
Advanced bioenergy feedstocks that do not require land include organic waste streams from agriculture and industry, and woody residues from forest harvesting and wood processing. Investment in comprehensive waste collection and sorting in the NZE unlocks around 45 EJ of bioenergy supply from various organic waste streams which is primarily used to produce biogases and advanced biofuels (Figure 2.28). Woody residues from wood processing and forest harvesting provide a further 20 EJ of bioenergy in 2050 in the NZE – less than half of current best estimates of the total sustainable potential. Bioenergy can also be produced
90 |
International Energy Agency | Special Report |
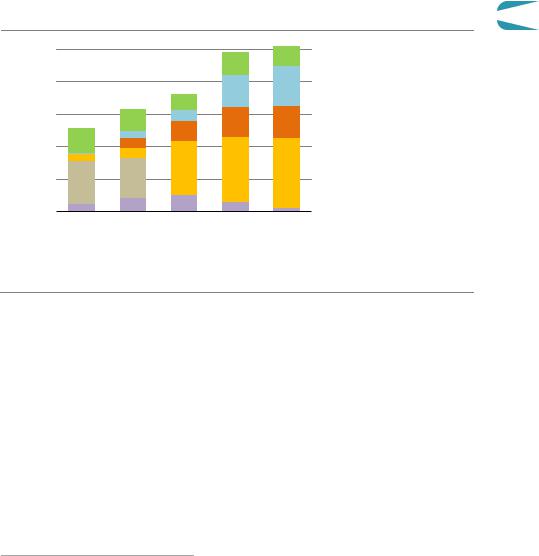
from dedicated short rotation woody crops (25 EJ of bioenergy supply in 2050).21 Sustainably managed forestry fuelwood or plantations22 and tree plantings integrated with agricultural production via agroforestry systems that do not conflict with food production or biodiversity provide just over 10 EJ of bioenergy in 2050.
Figure 2.28
EJ |
100 |
|
80
60
40
20
2010
Global bioenergy supply by source in the NZE |
2 |
 Forestry plantings
 Short rotation woody crops
 Forest and wood residues
 Organic waste streams
 Traditional use of biomass
 Conventional bioenergy crops
2020 |
2030 |
2040 |
2050 |
IEA. All rights reserved.
Bioenergy use increases by around 60% between 2020 and 2050,
while shifting away from conventional feedstocks and the traditional use of biomass
Note: Organic waste streams include agricultural residues, food processing, industrial and municipal organic waste streams; they do not require land area.
Source: IEA analysis based on IIASA data.
The total land area dedicated to bioenergy production in the NZE increases from 330 million hectares (Mha) in 2020 to 410 Mha in 2050. In 2050, around 270 Mha is forest, representing around one quarter of the total area of global managed forests, and around 5% of total forest area. There is 130 Mha of land used for short rotation advanced bioenergy crops in 2050 and 10 Mha for conventional bioenergy crops. There is no overall increase in cropland use for bioenergy production in the NZE from today’s level and no bioenergy crops are developed on forested land in the NZE.23 As well as allowing a much greater level of bioenergy crop production on marginal lands, woody energy crops can produce twice as much bioenergy per hectare as conventional bioenergy crops.
21Woody short rotation coppice crops grown on crop land, pasture land or marginal lands not suited to food crops.
22Sustainable forestry management ensures that the carbon stock and carbon absorption capability of the forest is expanded or remains unchanged.
23Of the 140 Mha land used for bioenergy crops in 2050, 70 Mha are marginal lands or land currently used for livestock grazing and 70 Mha are cropland. There is a 60 Mha increase in cropland use for woody crops to 2050 in the NZE but this is offset by a reduction in cropland use for producing conventional biofuel feedstocks.
Chapter 2 | A global pathway to net-zero CO emissions in 2050 |
91 |
IEA. All rights reserved.

Total land use for bioenergy in the NZE is well below estimated ranges of potential land availability that take full account of sustainability constraints, including the need to protect biodiversity hotspots and to meet the UN Sustainable Development Goal 15 on biodiversity and land use. The certification of bioenergy products and strict control of what land can be converted to expand forestry plantations and woody energy crops nevertheless is critical to avoid land use conflict issues. Certification is also critical to ensure the integrity of CO2 offsets (see Chapter 1), the use of which should be carefully managed and restricted to sectors that lack alternative mitigation options. A related land use issue is how to tackle emissions that arise from outside the energy sector (Box 2.3).
Box 2.3 Balancing emissions from land use, agriculture and forestry
To limit the global temperature rise, all sources of GHG emissions need to decline to close to zero or to be offset with CDR. The energy sector accounted for around three quarters of total GHG emissions in recent years. The largest source of GHG emissions other than the energy sector is agriculture, forestry and other land use (AFOLU), which produced between 10 12 Gt CO2 eq net GHG emissions in recent years.24 CO2 emissions from AFOLU were around 5 6 Gt CO2, and nitrous oxide and methane emissions were around 5 6 Gt CO2 eq (IPCC, 2019).
Options to reduce emissions from AFOLU and enhance removals include: halting deforestation; improving forest management practices; instituting farming practices that increase soil carbon levels; and afforestation. A number of companies have recently expressed interest in these sorts of nature based solutions to offset emissions from their operations (see Chapter 1). For afforestation, converting around 170 Mha (roughly half the size of India) to forests would sequester around 1 Gt CO2 annually by 2050.
Achieving net zero energy related and industrial process CO2 emissions by 2050 in the NZE does not rely on any offsets from outside the energy sector. But commensurate action on AFOLU would help limit climate change. The energy sector transformation in the NZE would reduce CO2 emissions from AFLOU in 2050 by around 150 Mt CO2 given the switch away from conventional crops and the increase in short rotation advanced bioenergy crop production on marginal lands and pasture land. To reduce emissions from AFOLU further would require reducing deforestation by two thirds by 2050, instituting improved forest management practices and planting around 250 Mha of new forests. The combined impact of these changes would reduce CO2 emissions from AFOLU to zero by 2040 and absorb 1.3 Gt CO2 annually by 2050. In this case, cumulative AFOLU CO2 emissions between 2020 and 2050 would be around 40 Gt CO2.
Non CO2 emissions from livestock, as well as other agricultural emissions, may be more difficult to mitigate given the link between livestock production and nitrous oxide and methane emissions. Changes to farming practices and technology improvements,
24 AFOLU emissions are emissions from anthropogenic activities and do not include CO2 emissions removal from the atmosphere by natural land sinks.
92 |
International Energy Agency | Special Report |

including changes to animal feed, could help to reduce these emissions, but it may be necessary to use afforestation to offset these emissions entirely. An alternative could be to reduce these emissions by reducing the demand for livestock products. For example, we estimate that reducing meat consumption in households with the highest levels of per capita consumption today to the global average level would reduce GHG emissions
by more than 1 Gt CO2 eq in 2050. Lower demand for livestock products would reduce 2 the pasture needed globally for livestock by close to 200 Mha and the cropland that is
used to grow feed for livestock by a further 80 Mha.
Are net zero emissions by 2050 possible without expanding land use forbioenergy?
Estimates of the global sustainable bioenergy potential are subject to a high degree of uncertainty, in particular over the extent to which new land area could sustainably be converted to bioenergy production. As a result, the NZE takes a cautious approach to bioenergy use, with consumption in 2050 (100 EJ) well below the latest estimates that integrate relevant SDGs, which suggest a potential between 150 170 EJ. But it is possible that the land available to provide sustainable bioenergy is even more limited. Here we explore the implications for emissions of restricting land use for dedicated bioenergy crops and forestry plantations to around 330 Mha, which is what is used today.
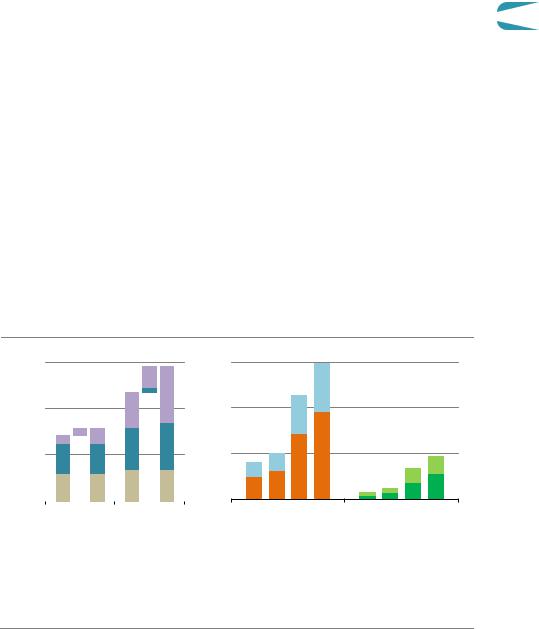
Figure 2.29 Impact on electricity demand and ability to achieve net-zero emissions by 2050 without expanded bioenergy land use
Bioenergy use |
Electricitydemand |
Solar PVand wind |
120 |
80 |
32 |
90 |
60 |
24 |
EJ |
ThousandTWh |
ThousandGW |
60 |
40 |
16 |
30 |
20 |
8 |
NZE |
Without expanding bioenergy land use |
|
IEA. All rights reserved.
Achieving net-zero emissions without expanding bioenergy land use would require a further 3 200 TWh from solar PV and wind, increasing capacity in the NZE by nearly 10%
Limiting land use to 330 Mha would reduce available bioenergy supply in 2050 by more than 10 EJ. This would mostly take the form of a reduction in the availability of short rotation woody energy crops, which are mainly used in the NZE in place of fossil fuels to provide high temperature heat for industrial processes and for electricity generation. Without bioenergy,
Chapter 2 | A global pathway to net-zero CO emissions in 2050 |
93 |
IEA. All rights reserved.
it is likely that hydrogen and synthetic methane would be used instead, and their production would require around 70 Mt of hydrogen in 2050 (15% more than in the NZE). If this were to be produced through the use of electrolysis it would require around 750 GW of electrolyser capacity and increase electricity demand in 2050 by around 3 200 TWh (Figure 2.29).
The additional electricity that would be needed could be produced using renewables, which would require an additional 1 700 GW of wind and solar PV capacity and almost 350 GW of additional battery capacity in 2050. Annual capacity additions during the 2030s would need to be 160 GW higher than in the NZE. The additional wind, solar, battery and electrolyser capacity, together with the electricity networks and storage needed to support this higher level of deployment would cost more than USD 5 trillion by 2050. This is USD 4.5 trillion more than would be needed if the use of bioenergy were to be expanded as envisaged in the NZE, and would increase the total investment needed in the NZE by 3%. While it might therefore be possible still to achieve net zero emissions in 2050 without expanding land use for bioenergy, this would make the energy transition significantly more expensive.
2.7.3CCUS applied to emissions from fossil fuels
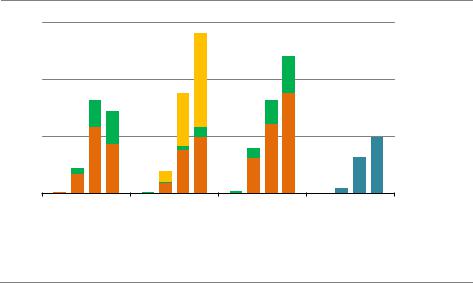
A total of 7.6 Gt CO2 is captured in 2050 in the NZE, almost 50% of which is from fossil fuel combustion, 20% is from industrial processes, and around 30% is from bioenergy use with CO2 capture and DAC (Figure 2.30). The use of CCUS with fossil fuels provides almost 70% of the total growth in CCUS to 2030 in the NZE. Yet the prospects for the rapid scaling up of CCUS are very uncertain for economic, political and technical reasons. Here we look at the implications for reaching net zero emissions in 2050 if fossil fuel CCUS does not expand beyond existing and planned projects.
Figure 2.30 CCUS by sector and emissions source in the NZE
Gt CO2
3 |
Electricity |
Industry |
Fuel supply |
DAC |
|
|
|
|
|
2 |
|
|
|
|
CO2 source
 Atmosphere
 Industrial processes
  Bioenergy
  Fossil fuels
1
2020 |
2030 |
2040 |
2050 |
2020 |
2030 |
2040 |
2050 |
2020 |
2030 |
2040 |
2050 |
2020 |
2030 |
2040 |
2050 |
IEA. All rights reserved.
Fossil fuel emissions account for almost 70% of total CO2 capture in 2030 and almost 50% in 2050
Note: DAC = direct air capture.
94 |
International Energy Agency | Special Report |
Are net zero emissions by 2050 possible without fossil fuel based CCUS?
Fossil fuel based CCUS applications comprise most of the CCUS projects added to 2030 in the NZE. These projects help to reduce risks for other non fossil fuel CCUS applications that are essential to reach net zero. In view of the challenges that fossil fuel based CCUS projects face, we have constructed a Low CCUS Case (LCC) in which no new fossil fuel CCUS projects are
developed beyond those already under construction or approved for development. In the 2 LCC, CO2 emissions captured from fossil fuels are only around 150 Mt in 2050, compared with
3 600 Mt in 2050 in the NZE.
In industry, the lack of new fossil fuel CCUS projects leads in the LCC to 1.2 Gt of additional CO2 emissions compared with the NZE in 2050. It would be necessary to use alternative technologies to eliminate these emissions in order to achieve net zero by 2050. A number of technologies that are at the prototype stage of development would be needed, such as electric cement kilns or electric steam crackers for high value chemicals production (see Box 2.4). Assuming that these technologies could be demonstrated and deployed at scale, this would increase electricity demand by around 2 400 TWh and hydrogen demand in industry by around 45 Mt in 2050. It would also be necessary to replace the 145 Mt of hydrogen that is produced in the NZE from fossil fuels equipped with CCUS. Provision of this 190 Mt of hydrogen through electrolysis would require an additional 2 000 GW capacity of electrolysers in 2050 (almost 60% more than in the NZE) and an additional 9 000 TWh of electricity (Figure 2.31).
Figure 2.31 Impacts of achieving net-zero emissions by 2050 without
Thousand TWh
expanded fossil fuel-based CCUS
60 |
Electricitydemand |
|
Capacity |
||||
|
|
|
|
|
GW |
30 |
|
|
|
|
|
|
|
|
|
40 |
|
|
|
|
|
Thousand |
20 |
|
|
|
|
|
|||
|
|
|
|
|
|
||
20 |
|
|
|
|
|
|
10 |
|
|
|
|
|
|
||
|
|
|
|
|
|
||
|
|
NZE LCC |
NZE |
LCC |
|
|
NZE LCC NZE LCC |
|
NZE LCC NZE LCC |
||||||||
2030 |
|
|
2050 |
|
|
2030 |
2050 |
2030 |
2050 |
||||||||
Electricityfor: |
|
|
|
|
Capacity: |
|
|
|
|
|
|
||||||
|
|
Hydrogen |
|
|
Industry |
|
Other |
|
|
Solar PV |
|
Wind |
|
Electrolysers |
|
Batteries |
|
|
|
|
|
|
|
|
|
|
|
||||||||
|
|
|
|
|
|
|
|
|
|
||||||||
IEA. All rights reserved.
Failure to deploy fossil fuel-based CCUS would significantly increase electricity demand and require much more solar, wind and electrolyser capacity
Note: LCC = Low CCUS Case where CCUS applied to fossil fuels is restricted to projects under construction or approved for development today.
Chapter 2 | A global pathway to net-zero CO emissions in 2050 |
95 |
IEA. All rights reserved.

Box 2.4 Technology innovation in the NZE
Innovation is key to developing new clean energy technologies and advancing existing ones. The importance of innovation increases as we get closer to 2050 because existing technologies will not be able to get us all the way along the path to net zero emissions. Almost 50% of the emissions reductions needed in 2050 in the NZE depend on technologies that are at the prototype or demonstration stage, i.e. are not yet available on the market (see Chapter 4).
After a new idea makes its way from the drawing board to the laboratory and out into the world, there are four key stages in the clean energy innovation pipeline (IEA, 2020d). But the pathway to maturity can be long and success is not guaranteed.
Prototype.A concept is developed into a design and then into a prototype for a new device, e.g. a furnace that produces steel with pure hydrogen instead of coal.
Demonstration. The first examples of a new technology are introduced at the size of a full scale commercial unit, e.g. a system that captures CO2 emissions from cement plants.
Marketuptake.The technology is being deployed in a number of markets. However, it either has a cost and performance gap with established technologies (e.g. electrolysers for hydrogen production) or it is competitive but there are still barriers, such as integration with existing infrastructure or consumer preferences, to reaching its full market potential (e.g. heat pumps). Policy attention is needed in both cases to stimulate wider diffusion to reduce costs and to overcome existing barriers, with more of the costs and risks being borne gradually by the private sector.
Maturity. The technology has reached market stability, and new purchases or installations are constant or even declining in some environments as newer technologies start to compete with the stock of existing assets, e.g. hydropower turbines.
Innovation is critical in the NZE to bring new technologies to market and to improve emerging technologies, including for electrification, CCUS, hydrogen and sustainable bioenergy. The degree of reliance on innovation in the NZE varies across sectors and along the various steps of the value chains involved (Figure 2.32).
Electrification.Almost 30% of the 170 Gt CO2 cumulative emissions reductions from the use of low emissions electricity in the NZE comes from technologies that are currently at prototype or demonstration stage, such as electricity based primary steel production or electric trucks.
Hydrogen.Not all steps of the low carbon hydrogen value chain are available on the market today. The majority of demand technologies, such as hydrogen based steel production, are only at the demonstration or prototype stage. These deliver more than 75% of the cumulative emissions reductions in the NZE related to hydrogen.
96 |
International Energy Agency | Special Report |
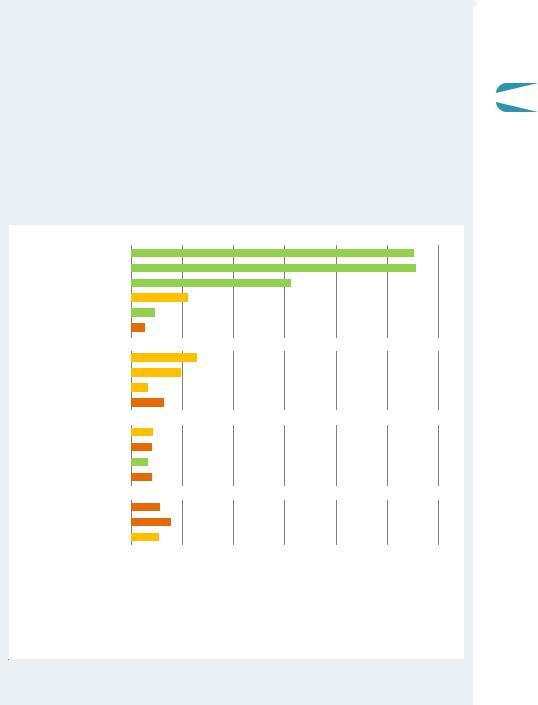
CCUS. Around 55% of the cumulative emissions reductions that come from CCUS in
the NZE are from technologies that are at the demonstration or prototype stage |
|
today. While CO2 capture has been in use for decades in certain industrial and fuel |
|
transformation processes, such as ammonia production and natural gas processing, |
|
it is still being demonstrated at a large scale in many of the other possible |
2 |
applications. |
Bioenergy. Around 45% of the cumulative emissions reductions in the NZE related to sustainable bioenergy come from technologies that are at the demonstration or prototype stage today, mainly for the production of biofuels.
Figure 2.32 Cumulative CO2 emissions reductions for selected technologies by maturity category in the NZE
Electricity
Solar PV
Wind
Electric cars
Electric trucks
Heat pumps
Electrified primary steel
CCUS
Cement
Fossil CCUS power
Steel
DACS
Hydrogen basedfuels
Trucks
Shipping
Cars
Steel
Bioenergy
Biomass CCUS power
Bio FT with CCUS
Bio FT
20 |
40 |
60 |
80 |
100 |
120 |
|||
|
Market uptake |
|
|
Demonstration |
|
Prototype |
Gt CO |
|
|
|
|
|
|
||||
|
|
|
|
|
||||
|
|
|
|
|
||||
IEA. All rights reserved.
CCUS, hydrogen and bioenergy technologies are less mature than electrification. Most technologies for heavy industry and trucks are at early stages of development.
Notes: Bio FT = Biomass gasification with Fischer Tropsch synthesis. Maturity levels are the technology design at the most advanced stage.
Chapter 2 | A global pathway to net-zero CO emissions in 2050 |
97 |
IEA. All rights reserved.
In the electricity sector, it would be necessary to produce an additional 11 300 TWh of electricity for industry and fuel transformation and to replace virtually all of the electricity generated from fossil fuel powered plants equipped with CCUS in 2050 in the NZE. Using renewables, this would require an additional 7 000 GW of wind and solar PV capacity in 2050. This is around 30% more than in the NZE, and would mean that annual capacity additions of solar PV and wind during the 2030s would need to reach 1 300 GW (300 GW more than in the NZE). To accommodate this additional level of variable renewables and to provide the flexibility that is available from fossil fuel CCUS equipped plants in the NZE, around 660 GW more battery capacity would be needed in 2050 (20% more than in the NZE in in 2050), together with additional 110 GW of other dispatchable capacity.
Reducing the rate of adding CCUS at existing coal and gas fired generation plants in the LCC would also raise the risk of stranded assets. We estimate that up to USD 90 billion of existing coal and gas fired capacity could be stranded in 2030 and up to USD 400 billion by 2050. Investment in fossil fuel based CCUS in the NZE to 2050 is around USD 650 billion, which would be avoided in the LCC. But additional investment is required in the LCC for extra wind, solar and electrolyser capacity, for electricity based routes in heavy industry, and for expanded electricity networks and storage to support this higher level of deployment. As a result, the additional cumulative investment to reach net zero emissions in 2050 in the LCC is USD 15 trillion higher than in the NZE.
Failure to develop CCUS for fossil fuels would also be likely to delay or prevent the development of other CCUS applications. Without fossil fuel based CCUS, the number of users and the volumes of the CO2 transport and storage infrastructure deployed around industrial clusters would be reduced. Fewer actors and more limited pools of capital would be available to incur the high upfront costs of infrastructure, as well as other risks associated with the initial roll out of CCUS infrastructure clusters. In addition, there would be fewer spill over learning and cost reduction benefits from developing fossil fuel based CCUS, making the successful demonstration and scale up of more nascent CCUS technologies much less likely. A delay in the development of other CCUS technologies would have a major impact on the prospect of getting to net zero emissions in 2050. For example, CCUS is the only scalable low emissions option to remove CO2 from the atmosphere and to almost eliminate emissions from cement production. If progress in these technologies were delayed and could not be deployed at scale, then achieving net zero emissions by 2050 would be vastly more difficult.
98 |
International Energy Agency | Special Report |

Chapter 3
Sectoral pathways to net-zero emissions by 2050
S U M M A R Y
Fossil fuel use falls drastically in the Net Zero Emissions Scenario (NZE) by 2050, and no new oil and natural gas fields are required beyond those that have already been approved for development. No new coal mines or mine extensions are required. Low emissions fuels – biogases, hydrogen and hydrogen based fuels – see rapid growth. They account for almost 20% of global final energy in 2050, compared with 1% in 2020. More than 500 Mt of low carbon hydrogen is produced in 2050, of which about 60% is produced using electrolysis that accounts for 20% of global electricity generation in 2050. Liquid biofuels provide 45% of global aviation fuel in 2050.
Electricity demand grows rapidly in the NZE, rising 40% from today to 2030 and more than two and a half times to 2050, while emissions from generation fall to net zero in aggregate in advanced economies by 2035 and globally by 2040. Renewables drive the transformation, up from 29% of generation in 2020 to 60% in 2030 and nearly 90% in 2050. From 2030 to 2050, 600 GW of solar PV and 340 GW of wind are added each year. The least efficient coal plants are phased out by 2030 and all unabated coal by 2040. Investment in electricity grids triples to 2030 and remains elevated to 2050.
In industry, emissions drop by 20% to 2030 and 90% to 2050. Around 60% of heavy industry emissions reductions in 2050 in the NZE come from technologies that are not ready for market today: many of these use hydrogen or CCUS. From 2030, all new industry capacity additions are near zero emissions. Each month from 2030, the world equips 10 new and existing heavy industry plants with CCUS, adds 3 new hydrogen based industrial plants and adds 2 GW of electrolyser capacity at industrial sites.
In transport, emissions drop by 20% to 2030 and 90% to 2050. The initial focus is on increasing the operational and technical efficiency of transport systems, modal shifts, and the electrification of road transport. By 2030, electric cars account for over 60% of car sales (4.6% in 2020) and fuel cell or electric vehicles are 30% of heavy truck sales (less than 0.1% in 2020). By 2035, nearly all cars sold globally are electric, and by 2050 nearly all heavy trucks sold are fuel cell or electric. Low emissions fuels and behavioural changes help to reduce emissions in long distance transport, but aviation and shipping remain challenging and account for 330 Mt CO2 emissions in 2050.
In buildings, emissions drop by 40% to 2030 and more than 95% to 2050. By 2030, around 20% of the existing building stock worldwide is retrofitted and all new buildings comply with zero carbon ready building standards. Over 80% of the appliances sold are the most efficient models available by 2025 in advanced economies and by the mid 2030s worldwide. There are no new fossil fuel boilers sold from 2025, except where they are compatible with hydrogen, and sales of heat pumps soar. By 2050, electricity provides 66% of energy use in buildings (33% in 2020). Natural gas use for heating drops by 98% in the period to 2050.
Chapter 3 | Sectoral pathways to net-zero emissions by 2050 |
99 |
IEA. All rights reserved.