

01 POWER ISLAND / 02 H2+NH3 / IEA 2022 NetZeroby2050-ARoadmapfortheGlobalEnergySector
.pdf3.1Introduction
The Net Zero Emissions by 2050 Scenario (NZE) involves a global energy system transformation that is unparalleled in its speed and scope. This chapter looks at how the main sectors are transformed, as well as the specific challenges and opportunities this involves (Figure 3.1). It covers the supply of fossil and low emissions fuels, electricity generation and the three main end use sectors – industry, transport and buildings. For each sector, we set out some key technology and infrastructure milestones on which the NZE depends for its successful delivery. Further we discuss what key policy decisions are needed, and by when, to achieve these milestones. Recognising that there is no single pathway to achieve net zero emissions by 2050 and that there are many uncertainties related to clean energy transitions, in this chapter we also explore the implications of choosing not to rely on certain fuels, technologies or emissions reduction options across the transformation and end use sectors.
Figure 3.1 CO2 emissions by sector in the NZE
15
COGt 10
5
0 |
|
|
|
|
52010 |
2020 |
2030 |
2040 |
2050 |
Power |
Buildings |
Transport |
Industry |
Other |
IEA. All rights reserved.
Emissions fall fastest in the power sector, with transport, buildings and industry seeing steady declines to 2050. Reductions are aided by the increased availability of low-emissions fuels
Note: Other = agriculture, fuel production, transformation and related process emissions, and direct air capture.
3.2Fossil fuel supply
3.2.1Energy trends in the Net Zero Emissions Scenario
Coal use declines from 5 250 million tonnes of coal equivalent (Mtce) in 2020 to 2 500 Mtce in 2030 and to less than 600 Mtce in 2050. Even with increasing deployment of carbon capture, utilisation and storage (CCUS), coal use in 2050 is 90% lower than in 2020
100 |
International Energy Agency | Special Report |
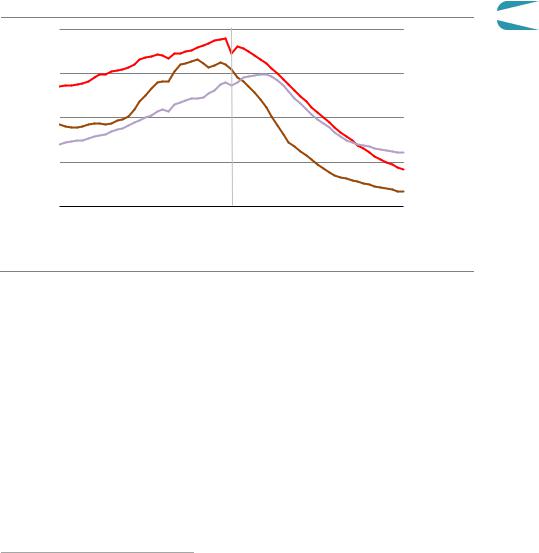
(Figure 3.2). Oil demand never returns to its 2019 peak and it declines from 88 million barrels per day (mb/d) in 2020 to 72 mb/d in 2030 and to 24 mb/d in 2050, a fall of almost 75% between 2020 and 2050. Natural gas quickly rebounds from the dip in demand in 2020 and rises through to the mid 2020s, reaching a peak of around 4 300 billion cubic metres (bcm), before dropping to 3 700 bcm in 2030 and to 1 750 bcm in 2050. By 2050, natural gas use is 55% lower than in 2020.
Figure 3.2 Coal, oil and natural gas production in the NZE |
3 |
||||||
EJ |
200 |
|
Historical |
|
Projected |
|
|
|
|
|
|
|
|
||
|
150 |
|
|
|
|
|
|
|
100 |
|
|
|
|
|
|
|
50 |
|
|
|
|
|
Natural gas |
|
|
|
|
|
|
Oil |
|
|
|
|
|
|
|
|
|
|
|
|
|
|
|
|
Coal |
|
1990 |
2000 |
2010 |
2020 |
2030 |
2040 |
2050 |
|
|
|
|
|
|
|
IEA. All rights reserved. |
Between 2020 and 2050, demand for coal falls by 90%, oil by 75%, and natural gas by 55%
Oil
The trajectory of oil demand in the NZE means that no exploration for new resources is required and, other than fields already approved for development, no new oil fields are necessary. However, continued investment in existing sources of oil production are needed. On average oil demand in the NZE falls by more than 4% per year between 2020 and 2050. If all capital investment in producing oil fields were to cease immediately, this would lead to a loss of over 8% of supply each year. If investment were to continue in producing fields but no new fields were developed, then the average annual loss of supply would be around 4.5% (Figure 3.3). The difference is made up by fields that are already approved for development.
These dynamics are reflected in the oil price in the NZE, which drops to around USD 35/barrel in 2030 and USD 25/barrel in 2050. This price trajectory is largely determined by the operating costs for fields currently in operation, and only a very small volume of existing production would need to be shut in. However, income from oil production in all countries is much lower in the NZE than in recent years,1 and the NZE projects significant stranded
1 Governments may also reduce or eliminate upstream taxes to ensure that production costs are below the oil price to maintain domestic production.
Chapter 3 | Sectoral pathways to net-zero emissions by 2050 |
101 |
IEA. All rights reserved.
capital and stranded value.2 The oil price in the NZE would be sufficient in principle to cover the cost of developing new fields for the lowest cost producers, including those in the Middle East, but it is assumed that major resource holders do not proceed with investment in new fields because doing so would create significant additional downward pressure on prices.
The refining sector also faces major challenges in the NZE. Refinery throughput drops considerably and there are significant changes in product demand. With rapid electrification of the vehicle fleet, there is a major drop in demand for traditional refined products such as gasoline and diesel, while demand for non combusted products such as petrochemicals increases. In recent years, around 55% of oil demand was for gasoline and diesel, but this drops to less than 15% in 2050, while the share of ethane, naphtha and liquefied petroleum gas (LPG) rises from 20% in recent years to almost 60% in 2050. This shift accentuates the drop in oil demand for refiners, and refinery runs fall by 85% between 2020 and 2050. Refiners are used to coping with changing demand patterns, but the scale of the changes in the NZE would inevitably lead to refinery closures, especially for refineries not able to concentrate primarily on petrochemical operations or the production of biofuels.
Figure 3.3 Oil and natural gas production in the NZE
|
Oil |
|
5 |
Natural gas |
mb/d |
125 |
Thousandbcm |
|
|
75 |
3 |
|
||
|
100 |
|
4 |
|
|
50 |
|
2 |
|
|
25 |
|
1 |
|
2010 |
2020 |
2030 |
2040 |
2050 |
2010 |
2020 |
2030 |
2040 |
2050 |
|||||||
|
Middle East |
|
North America |
|
Eurasia |
|
Africa |
|
Asia Pacific |
|
Central and South America |
|
Europe |
|||
|
|
|
|
|
|
|
||||||||||
|
|
|
|
|
|
|
||||||||||
IEA. All rights reserved.
No new oil and natural gas fields are required beyond those already approved for development. Supply is increasingly concentrated in a few major producing countries
Natural gas
No new natural gas fields are needed in the NZE beyond those already under development. Also not needed are many of the liquefied natural gas (LNG) liquefaction facilities currently under construction or at the planning stage. Between 2020 and 2050, natural gas traded as
2 Stranded capital is capital investment in fossil fuel infrastructure that is not recovered over the operating lifetime of the asset because of reduced demand or reduced prices resulting from climate policies. Stranded value is a reduction in the future revenue generated by an asset or asset owner assessed at a given point in time because of reduced demand or reduced prices resulting from climate policies (IEA, 2020a).
102 |
International Energy Agency | Special Report |
LNG falls by 60% and trade by pipeline falls by 65%. During the 2030s, global natural gas demand declines by more than 5% per year on average, meaning that some fields may be closed prematurely or shut in temporarily. Declines in natural gas demand slow after 2040, and more than half of natural gas use globally in 2050 is to produce hydrogen in facilities with CCUS. The large level of hydrogen, also produced using electrolysis, and biomethane in the NZE, means that the decline in total gaseous fuels is more muted than the decline in natural gas. This has important implications for the future of the gas industry (see Chapter 4).
Coal |
3 |
No new coal mines or extensions of existing ones are needed in the NZE as coal demand declines precipitously. Demand for coking coal falls at a slightly slower rate than for steam coal, but existing sources of production are sufficient to cover demand through to 2050. Such a decline in coal demand would have major consequences for employment in coal mining regions (see Chapter 4). There is a slowdown in the rate of decline in the 2040s as coal production facilities are increasingly equipped with CCUS: in the NZE, around 80% of coal produced in 2050 applies CCUS.
3.2.2Investment in oil and gas
Upstream oil and gas investment averages about USD 350 billion each year from 2021 to 2030 in the NZE (Figure 3.4). This is similar to the level in 2020, but around 30% lower than average levels during the previous five years. Once fields under development start production, all of the upstream investment in the NZE is to support operations in existing fields; after 2030, total annual upstream investment is around USD 170 billion each year.
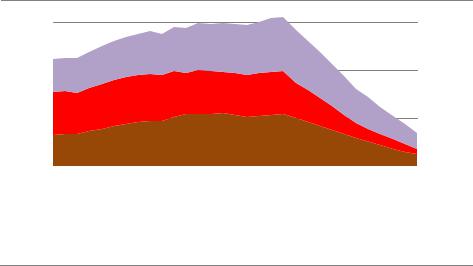
Figure 3.4 Investment in oil and natural gas supply in the NZE
Oil |
Natural gas |
USD (2019) |
600 |
400 |
|
Billion |
|
|
200 |
 Refining
 Transport
Fields
 Existing
 New
New
1991 2001 2011 2021 2031 2041 |
1991 2001 2011 2021 2031 2041 |
2000 2010 2020 2030 2040 2050 |
2000 2010 2020 2030 2040 2050 |
|
IEA. All rights reserved. |
Once fields under development start production, all upstream oil and gas investment is spent on maintaining production at existing fields
Note: Investment in new fields in the 2021 2030 period is for projects that are already under construction or have been approved.
Chapter 3 | Sectoral pathways to net-zero emissions by 2050 |
103 |
IEA. All rights reserved.
3.2.3Emissions from fossil fuel production
Emissions from the supply chains of coal, oil and natural gas fall dramatically in the NZE. The global average greenhouse gas (GHG) emissions intensity of oil production today is just under 100 kilogrammes of carbon dioxide equivalent (kg CO2 eq) per barrel. Without changes, a large proportion of global production would become uneconomic, as CO2 prices are applied to the full value chains of fossil fuels. For example, by 2030 the CO2 price in advanced economies in the NZE is USD 100 per tonne of CO2 (tCO2), which would add USD 10 to the cost of producing each barrel at today’s average level of emissions intensity.
Methane constitutes about 60% of emissions from the coal and natural gas supply chains and about 35% of emissions from the oil supply chain. In the NZE, total methane emissions from fossil fuels fall by around 75% between 2020 and 2030, equivalent to a 2.5 gigatonne of carbon dioxide equivalent (Gt CO2 eq) reduction in GHG emissions (Figure 3.5). Around one third of this decline is a result of an overall reduction in fossil fuel consumption, but the larger share comes from a huge increase in the deployment of emissions reduction measures and technologies, which leads to the elimination of all technically avoidable methane emissions by 2030 (IEA, 2020a).
Figure 3.5 Methane emissions from coal, oil and natural gas in the NZE
Mt methane
120
80
3 600
2 400
Mt CO eq
40 |
|
|
|
|
|
|
|
|
|
|
1 200 |
|
|
|
|
|
|
|
|
|
|
|
|
|
|
2000 |
2005 |
2010 |
2015 |
|
2020 |
2025 |
2030 |
|||||
|
|
|
|
Natural gas |
|
|
Oil |
|
|
Coal |
|
|
|
|
|
|
|
|
|
|
|
||||
|
|
|
|
|
|
|
|
|
||||
IEA. All rights reserved.
Methane emissions from fossil fuels fall by 75% between 2020 and 2030 as result of a concerted global effort to deploy all available reduction measures and technologies
Note: Mt = million tonnes.
Actions to reduce the emissions intensity of existing oil and gas operations in the NZE leads to: the end of all flaring; the use of CCUS with centralised sources of emissions (including to capture natural sources of CO2 that are often extracted with natural gas); and significant electrification of upstream operations (often making use of off grid renewable energy sources).
104 |
International Energy Agency | Special Report |

The NZE inevitably brings significant challenges for fossil fuel industries and those who work in them, but it also brings opportunities. Coal mining declines dramatically in the NZE, but the mining of minerals needed for clean energy transitions increases very rapidly, and mining expertise is likely to be highly valued in this context. The oil and gas industry could play a key role in helping to develop at scale a number of clean energy technologies such as CCUS, low carbon hydrogen, biofuels and offshore wind. Scaling up these technologies and bringing down their costs will rely on large scale engineering and project management capabilities,
qualities that are a good match to those of large oil and gas companies. These issues, 3 including the question of how to help those affected by the major changes implied by the
NZE, are discussed in more detail in Chapter 4.
3.3Low emissions fuel supply
3.3.1Energy trends in the Net Zero Emissions Scenario
Reaching net zero emissions will require low emissions fuels3 where energy needs cannot easily or economically be met by electricity (Figure 3.6). This is likely to be the case for some modes of long distance transport (trucks, aviation and shipping) and of heat and feedstock supply in heavy industry. Some low emissions fuels are effectively drop in, i.e. they are compatible with the existing fossil fuel distribution infrastructure and end use technologies, and require few if any modifications to equipment or vehicles.
Low emissions fuels today account for just 1% of global final energy demand, a share that increases to 20% in 2050 in the NZE. Liquid biofuels meet 14% of global transport energy demand in 2050, up from 4% in 2020; hydrogen based fuels meet a further 28% of transport energy needs by 2050. Low carbon gases (biomethane, synthetic methane and hydrogen) meet 35% of global demand for gas supplied through networks in 2050, up from almost zero today. The combined share of low carbon hydrogen and hydrogen based fuels in total final energy use worldwide reaches 13% in 2050. Hydrogen and ammonia also provide important low emissions sources of power system flexibility and contribute 2% of overall electricity generation in 2050, which is enough to make the electricity sector an important driver of hydrogen demand.
3 Low emissions fuels refer to liquid biofuels, biogas and biomethane, and hydrogen based fuels (hydrogen, ammonia and synthetic hydrocarbon fuels) that do not emit CO2 from fossil fuels directly when used and also emit very little when being produced. For example, hydrogen produced from natural gas with CCUS and high capture rates (90% or higher) is considered a low emissions fuel, but not if produced without CCUS.
Chapter 3 | Sectoral pathways to net-zero emissions by 2050 |
105 |
IEA. All rights reserved.

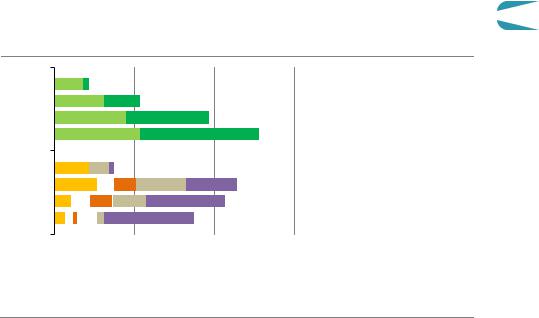
Figure 3.6 Global supply of low-emissions fuels by sector in the NZE
|
|
Liquidbiofuelsin transport |
|
|
|
|
|
|
2020 |
|
|
|
|
|
|
|
Shipping |
2030 |
|
|
|
|
|
|
|
|
|
|
|
|
|
|
|
Aviation |
|
|
|
|
|
|
|
|||
|
|
|
|
|
|
|||
2050 |
|
|
|
|
|
|
|
Road transport |
|
|
|
|
|
|
|
||
|
|
|
|
|
|
|
||
|
|
|
|
|
|
|
|
|
|
|
|
|
|
|
|
|
|
|
Low carbongasesingas grid |
|
|
|
|
|
|
|
2020 |
|
|
|
|
|
|
|
Biomethane |
|
|
|
|
|
|
|||
2030 |
|
|
|
|
|
|
|
Hydrogen |
|
|
|
|
|
|
|||
|
|
|
|
|
|
|||
2050 |
|
|
|
|
|
|
|
Synthetic methane |
|
|
|
|
|
|
|
||
|
|
|
|
|
|
|
||
|
|
|
|
|
|
|
|
|
|
|
|
|
|
|
|
|
|
|
Hydrogen basedfuelsinTFC |
|
|
|
|
|
|
|
2020 |
|
|
|
|
|
|
|
Buildings |
|
|
|
|
|
|
|||
2030 |
|
|
|
|
|
|
|
Industry |
|
|
|
|
|
|
|
||
|
|
|
|
|
|
|
Transport hydrogen |
|
|
|
|
|
|
|
|||
|
|
|
|
|
|
|
|
|
2050 |
|
|
|
|
|
|
|
Transport ammonia |
|
|
|
|
|
|
|||
|
|
|
|
|
|
|||
|
|
|
|
|
|
|
|
Transport synfuels |
|
|
|
|
|
|
|
|
|
|
|
|
|
|
|
|
|
|
10% |
20% |
30% |
40% |
|
||||
IEA. All rights reserved.
Low-emissions fuels in the form of liquid biofuels, biomethane, hydrogen-based fuels help to decarbonise sectors where direct electrification is challenging
Notes: TFC = total final consumption. Low carbon gases in the gas grid refers to the blending of biomethane, hydrogen and synthetic methane with natural gas in a gas network for use in buildings, industry, transport and electricity generation. Synfuels refer to synthetic hydrocarbon fuels produced from hydrogen and CO2. Final energy consumption of hydrogen includes, in addition to the final energy consumption of hydrogen, ammonia and synthetic hydrocarbon fuels, the on site hydrogen production in the industry sector.
3.3.2Biofuels4
Around 10% of the global primary supply of modern bioenergy (biomass excluding traditional uses for cooking) was consumed as liquid biofuels for road transport and 6% was consumed as biogases (biogas and biomethane) to provide power and heat in 2020, with the rest directly used for electricity generation and heating in the residential sector. Supply accelerates sharply in the NZE with liquid biofuels expanding by a factor of almost four and biogases increasing by a factor of six by 2050.
All but about 7% of liquid biofuels for transport are currently produced from conventional crops such as sugarcane, corn and soybeans. Such crops directly compete with arable land that can be used for food production, which limits the scope for expanding output. So most of the growth in biofuels in the NZE comes from advanced feedstocks such as wastes and residues and woody energy crops grown on marginal lands and cropland not suitable for food
4 Liquids and gases produced from bioenergy.
106 |
International Energy Agency | Special Report |
production (see section 2.7.2). Advanced liquid biofuel production technology using woody |
|
|
feedstock expands rapidly over the next decade in the NZE, and its contribution to liquid |
|
|
biofuels jumps from less than 1% in 2020 to almost 45% in 2030 and 90% in 2050 (Figure 3.7). |
|
|
By 2030, production reaches 2.7 million barrels of oil equivalent per day (mboe/d) by 2030, |
|
|
underpinned by biomass gasification using the Fischer Tropsch process (bio FT) and cellulosic |
|
|
ethanol, mostly to produce drop in substitutes for diesel and jet kerosene. Advanced liquid |
|
|
biofuel production increases by an additional 130% to more than 6 mboe/d in 2050, the bulk |
|
|
of which is biokerosene. |
3 |
|
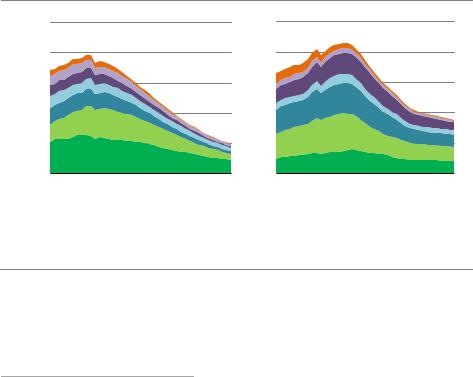
Figure 3.7 Global biofuels production by type and technology in the NZE |
||
|
Liquidbiofuels Gaseous biofuels
2020
2030
2040
2050
2020
2030
2040
2050
 Biogas
 Biomethane
 Conventional ethanol
 Advanced ethanol
 Conventional biodiesel
 Advanced biodiesel and biokerosene with CCUS
5 |
10 |
EJ 15 |
IEA. All rights reserved.
Liquid biofuel production quadruples while that of biogases expands sixfold between 2020 and 2050, underpinned by the development of sustainable biomass supply chains
Notes: EJ = exajoules; CCUS = carbon capture, utilisation and storage. Conventional ethanol refers to production using food energy crops. Advanced ethanol refers to production using wastes and residues and non food energy crops grown on marginal and non arable land. Conventional biodiesel includes fatty acid and methyl esters (FAME) route using food energy crops. Advanced biodiesel includes biomass based Fischer Tropsch and HEFA routes using wastes, residues and non food energy crops grown on marginal and non arable land. Biomethane includes biogas upgrading and biomass gasification based routes.
Production using these feedstocks is mostly under development today. Current output capacity, principally cellulosic ethanol, is about 2.5 thousand barrels of oil equivalent per day (kboe/d). The NZE assumes that projects currently in the pipeline in Japan, the United Kingdom and the United States will bring these technologies to the market within the next few years. The scale up required for all advanced liquid biofuels (including from waste oils) over the next decade is equivalent to building one 55 kboe/d biorefinery every ten weeks (the world’s largest biorefinery has capacity of 28 kboe/d).
The supply of these biofuels after 2030 shifts rapidly in the NZE from passenger vehicles and light trucks, where electrification is increasingly the order of the day, to heavy road freight, shipping and aviation. Ammonia makes inroads into shipping. Advanced liquid biofuels increase their share of the global aviation fuel market from 15% in 2030 to 45% in 2050.
Chapter 3 | Sectoral pathways to net-zero emissions by 2050 |
107 |
IEA. All rights reserved.

Advanced biofuels such as hydrogenated esters and fatty acids (HEFA) and bio FT are able to adjust their product slates (up to a point) from renewable diesel to biokerosene, and existing ethanol plants, especially those that can be retrofitted with CCUS or integrated with cellulosic feedstock, also make a contribution.
The supply of biogases increases even more than liquid biofuels. Injection into gas networks expands from under 1% of total gas volume in 2020 to almost 20% in 2050, reducing the emissions intensity of the network based gas. Biomethane is mostly produced by upgrading biogas produced from anaerobic digestion of feedstocks such as agricultural residues like manure and biogenic municipal solid waste, thereby avoiding methane emissions that would otherwise be released. Due to the dispersed nature of these feedstocks, this assumes the construction of thousands of injection sites and associated distribution lines every year. Biogas and biomethane are also used as clean cooking fuels and in electricity generation in the NZE.
The production of biofuels can be combined with CCUS at a relatively low cost in some biofuel production routes (ethanol, bio FT, biogas upgrading) because the processes involved release very pure streams of CO2. In the NZE, the use of biofuels with CCUS results in annual carbon dioxide removal (CDR) of 0.6 Gt CO2 in 2050, which offset residual emissions in transport and industry.
3.3.3Hydrogen and hydrogen based fuels
Hydrogen use in the energy sector today is largely confined to oil refining and the production of ammonia and methanol in the chemicals industry. Global hydrogen demand was around 90 million tonnes (Mt) in 2020, mainly produced from fossil fuels (mostly natural gas) and emitting close to 900 Mt CO2. Both the amount needed and the production route of hydrogen change radically in the NZE. Demand increases almost sixfold to 530 Mt in 2050, of which half is used in heavy industry (mainly steel and chemicals production) and in the transport sector; 30% is converted into other hydrogen based fuels, mainly ammonia for shipping and electricity generation, synthetic kerosene for aviation and synthetic methane blended into gas networks; and 17% is used in gas fired power plants to balance increasing electricity generation from solar PV and wind and to provide seasonal storage. Overall, hydrogen based fuels5 account for 13% of global final energy demand in 2050 (Figure 3.8).
Ammonia is used today as feedstock in the chemical industry, but in the NZE it is also used as fuel in various energy applications, benefitting from its lower transport cost and higher energy density than hydrogen. Ammonia accounts for around 45% of global energy demand for shipping in 2050 in the NZE. Co firing with ammonia is also a potential early option to reduce CO2 emissions in existing coal fired power plants. The toxicity of ammonia means that its handling is likely to be limited to professionally trained operators, which could restrict its potential.
5 Hydrogen based fuels are defined as hydrogen, ammonia as well as synthetic hydrocarbon fuels produced from hydrogen and CO2.
108 |
International Energy Agency | Special Report |
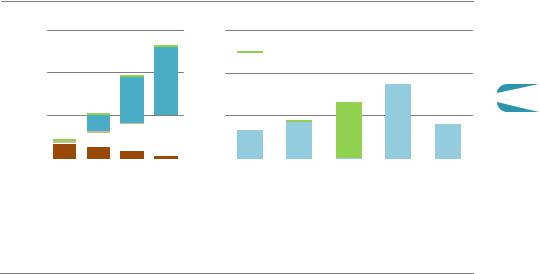
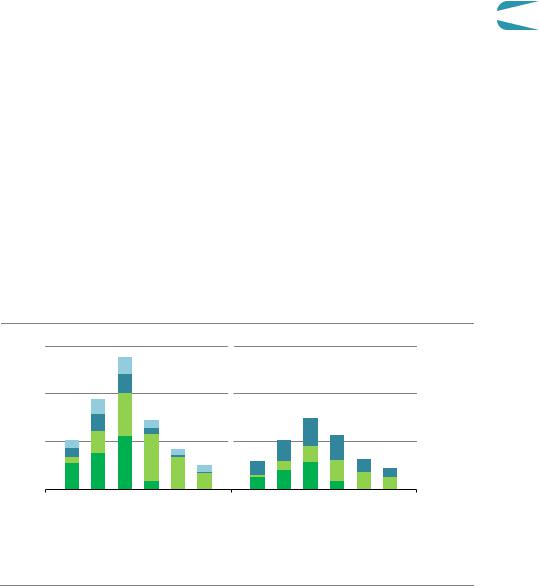
Figure 3.8 Global production of hydrogen by fuel and hydrogen demand by sector in the NZE
600 |
|
|
Hydrogenproduction |
75% |
|
|
|
Shareof hydrogenfuels by sectorin 2050 |
||||||||||||
|
|
|
|
|
|
|
|
|
|
|
|
|
|
|
|
|
|
|
||
Mt |
|
|
|
|
|
|
|
|
|
|
|
|
|
|
|
|
|
|||
400 |
|
|
|
|
|
|
|
50% |
|
|
|
|
|
|
|
|
|
|
|
|
|
|
|
|
|
|
|
|
|
|
|
|
|
|
|
|
|
|
|
||
200 |
|
|
|
|
|
|
|
25% |
|
|
|
|
|
|
|
|
|
3 |
||
|
|
|
|
|
|
|
|
|
|
|
|
|
|
|
|
|
|
|
||
|
|
|
|
|
|
|
|
|
|
|
|
|
|
|
|
|
|
|
||
|
|
|
|
|
|
|
|
|
|
|
|
|
|
|
|
|
|
|
|
|
2020 2030 |
2040 2050 |
|
|
Shipping |
Road |
Aviation Chemicals Iron and |
||||||||||||||
|
|
|
Fossil |
|
|
with CCUS |
|
|
|
|
|
|
transport |
|
|
|
|
steel |
||
|
|
|
Refining CNR |
|
|
Electricity |
|
|
|
|
Synthetic fuels |
|
|
Ammonia |
|
Hydrogen |
||||
|
|
|
|
|
|
|
|
|
|
|
||||||||||
|
|
|
|
|
|
|
|
|
|
|
||||||||||
IEA. All rights reserved.
Hydrogen production jumps sixfold by 2050, driven by water electrolysis and natural gas with CCUS, to meet rising demand in shipping, road transport and heavy industry
Note: Refining CNR = hydrogen by product from catalytic naphtha reforming at refineries.
Synthetic kerosene meets around one third of global aviation fuel demand in 2050 in the NZE. Its manufacture at bioenergy fired power or biofuel production plants requires CO2 captured from the atmosphere. CO2 from these sources can be considered carbon neutral, as it results in no net emissions when the fuel is used. There is scope for the co production of advanced liquid biofuels and synthetic liquid fuels from hydrogen and CO2, with the integration of the two processes reducing the overall liquid fuel production costs. Alongside synthetic liquid fuels, enough synthetic methane is produced from hydrogen and CO2 in 2050 to meet 10% of demand for network supplied gas in the buildings, industry and transport sectors.
By 2050, hydrogen production in the NZE is almost entirely based on low carbon technologies: water electrolysis accounts for more than 60% of global production, and natural gas in combination with CCUS for almost 40%. Global electrolyser capacity reaches 850 gigawatts (GW) by 2030 and 3 600 GW by 2050, up from around 0.3 GW today. Electrolysis absorbs close to 15 000 terawatt hours (TWh), or 20% of global electricity supply in 2050, largely from renewable resources (95%), but also from nuclear power (3%) and fossil fuels with CCUS (2%). Natural gas use for hydrogen production with CCUS is 925 bcm in 2050, or around 50% of global natural gas demand, with 1.8 Gt CO2 being captured.
Scaling up deployment of technologies and related manufacturing capacity will be critical to reducing costs. Water electrolysers are available on the market today and hydrogen production from natural gas with CCUS has been demonstrated at a commercial scale (there are seven plants in operation around the world). The choice between the two depends on
Chapter 3 | Sectoral pathways to net-zero emissions by 2050 |
109 |
IEA. All rights reserved.