

01 POWER ISLAND / 02 H2+NH3 / IEA 2022 NetZeroby2050-ARoadmapfortheGlobalEnergySector
.pdfplants in China is 13 years and 16 years in the rest of Asia, compared to around 35 years in Europe and 40 years in the United States (IEA, 2020e).
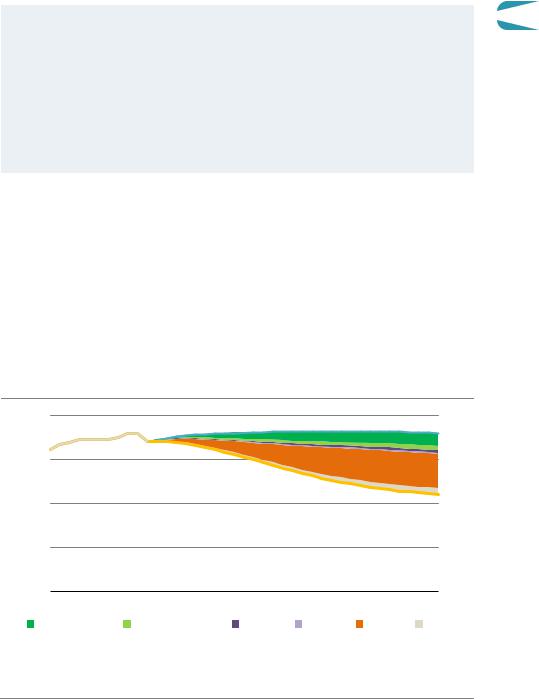
Figure 1.9 Emissions from existing infrastructure by sector and region
Gt CO
25 |
Advancedeconomies |
Emergingmarket anddevelopingeconomies |
|
|
20
15
10
5
2020 |
2030 |
2040 |
2050 |
2020 |
2030 |
2040 |
2050 |
||||||
|
|
Electricity |
|
Industry |
|
|
Transport |
|
Buildings |
|
|
Other |
|
|
|
|
|
|
|
|
|||||||
|
|
|
|
|
|
|
|||||||
IEA. All rights reserved.
Emerging market and developing economies account for three-quarters of cumulative emissions from existing infrastructure through to 2050
1.4Announced Pledges Case
The Announced Pledges Case (APC) assumes that all national net zero emissions pledges are realised in full and on time. It therefore goes beyond the policy commitments incorporated in the STEPS. The aim of the APC is to see how far full implementation of the national net zero emissions pledges would take the world towards reaching net zero emissions, and to examine the scale of the transformation of the energy sector that such a path would require.
The way these pledges are assumed to be implemented in the APC has important implications for the energy system. A net zero pledge for all GHG emissions does not necessarily mean that CO2 emissions from the energy sector need to reach net zero. For example, a country’s net zero plans may envisage some remaining energy related emissions are offset by the absorption of emissions from forestry or land use, or by negative emissions arising from the use of bioenergy or direct capture of CO2 from the air (DAC) with CCUS.6 It is not possible to know exactly how net zero pledges will be implemented, but the design of the APC, particularly with respect to the details of the energy system pathway, has been informed by the pathways that a number of national bodies have developed to support net zero pledges (Box 1.1). Policies in countries that have not yet made a net zero pledge are assumed to be the same as in the STEPS. Non policy assumptions, including population and economic growth, are the same as in the STEPS.
6 For example, in recent economy wide net zero mitigation pathways for the European Union, around 140 210 million tonnes CO2 of emissions from the energy sector remain in 2050, which are offset by CDR from managed land use sinks, and bioenergy and DAC with CCUS (European Commission, 2018).
40 |
International Energy Agency | Special Report |
Box 1.1 |
|
Consultations with national bodies on achieving national net- |
|
|
zero emissions goals |
1 |
|
To help inform its work on net zero pathways, the IEA engaged in extensive consultations |
|||
with experts in academia and national bodies that have developed pathways to support net zero pledges made by governments. This includes groups that have developed net zero emissions pathways for several countries including China, European Union, Japan, United Kingdom and United States, as well as the IPCC. These pathways were not used directly as input for the APC, but the discussions informed our modelling of national preferences and constraints within each jurisdiction and to benchmark the overall level of energy related CO2 emissions reductions that are commensurate with economy wide net zero goals.
1.4.1CO2 emissions
In the APC, there is a small rebound in emissions to 2023, although this is much smaller than the increase that immediately followed the financial crisis in 2008 09. Emissions never reach the previous peak of 36 Gt CO2. Global CO2 emissions fall around 10% to 30 Gt in 2030 and to 22 Gt in 2050. This is around 35% below the level in 2020 and 14 Gt CO2 lower than in the STEPS (Figure 1.10). If emissions continue this trend after 2050, and with a similar level of changes in non energy related GHG emissions, the global average surface temperature rise in 2100 would be around 2.1 °C (with a 50% probability).
Figure 1.10 Global energy-related and industrial process CO2 emissions by scenario and reductions by region, 2010-2050
CO |
40 |
|
|
|
|
|
|
|
|
|
|
STEPS |
|
Gt |
|
|
|
|
|
|
|
|
|
|
|
|
|
|
30 |
|
|
|
|
|
|
20 |
|
|
|
|
APC |
|
|
|
|
|
|
|
|
10 |
|
|
|
|
|
|
2010 |
2020 |
2030 |
2040 |
|
2050 |
|
United States |
European Union |
Japan |
Korea |
China |
Other |
IEA. All rights reserved.
Achieving existing net zero pledges would reduce emissions globally to 22 Gt CO2 in 2050, a major reduction compared with current policies but still far from net-zero emissions
Chapter 1 | Announced net zero pledges and the energy sector |
41 |
IEA. All rights reserved.
The net zero pledges that have been made to date therefore make a major difference to the current trajectory for CO2 emissions. Equally, however, existing net zero pledges fall well short of what is necessary to reach net zero emissions globally by 2050. This highlights the importance of concrete policies and plans to deliver in full long term net zero pledges. It also underlines the value of other countries making (and delivering on) net zero pledges: the more countries that do so, and the more ambitious those pledges are, the more the gap will narrow with what is needed to reach net zero emissions by 2050.
The largest drop in CO2 emissions is in the APC is in the electricity sector with global emissions falling by nearly 60% between 2020 and 2050. This occurs despite a near doubling of electricity demand as energy end uses are increasingly electrified, notably in transport and buildings (Figure 1.11). This compares with a fall in emissions of less than 15% in the STEPS.
Figure 1.11 Global CO2 emissions by sector in the STEPS and APC
CO |
40 |
|
Other |
|
|
||
|
|
||
|
|
Buildings |
|
Gt |
|
|
|
|
|
||
|
|
||
|
|
Transport |
|
|
30 |
|
|
|
|
||
|
|
||
|
|
Industry |
|
|
|
|
|
|
|
|
 Electricity
20
10
2000 |
2010 |
2020 |
2030 |
2040 |
2050 |
2030 |
2040 |
2050 |
|
|
|
|
STEPS |
|
|
APC |
|
IEA. All rights reserved.
Announced net zero pledges would cut emissions in 2050 by 60%
in the electricity sector, 40% in buildings, 25% in industry and just over 10% in transport
The transport and industry sectors see a less marked fall in CO2 emissions to 2050 in the APC, with increases in energy demand in regions without net zero pledges partially offsetting emissions reduction efforts in other regions. Emissions from the buildings sector decline by around 40% between 2020 and 2050, compared with around 5% in the STEPS: fossil fuel use in buildings is mostly to provide heating, and countries that have made pledges account for a relatively high proportion of global heating demand.
Even in regions with net zero pledges, there are some residual emissions in 2050, mainly in industry and transport. This reflects the scarcity of commercially available options to eliminate all emissions from heavy duty trucks, aviation, shipping and heavy industry.
42 |
International Energy Agency | Special Report |
1.4.2Total energy supply
Global total energy supply increases by more than 15% between 2020 and 2050 in the APC, compared with a third in the STEPS (Figure 1.12). Energy intensity falls on average by around 1 2.6% per year to 2050 compared with 2.2% in the STEPS. There is a substantial increase in
energy demand in emerging market and developing economies, where economic and population growth is fastest and where there are fewer net zero pledges, which outweighs the reductions in energy demand in the countries with net zero pledges.
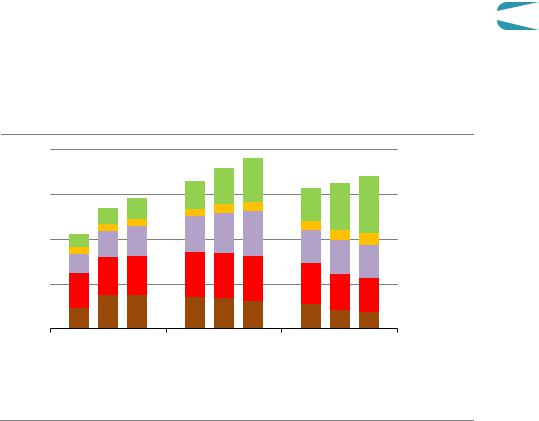
Figure 1.12 Total energy supply by source in STEPS and APC
EJ
800 |
|
Renewables |
|
|
|
|
|
|
|
|
Nuclear |
|
|
|
|
|
|
600 |
|
Natural gas |
|
||
|
||
|
Oil |
|
|
|
|
|
|
|
|
|
Coal |
|
|
|
|
|
400
200
2000 2010 2020 |
2030 2040 2050 |
2030 2040 2050 |
|
STEPS |
APC |
IEA. All rights reserved.
Announced net zero pledges lift renewables in the APC from 12% of total energy supply in 2020 to 35% in 2050, mainly at the expense of coal and oil
The global increase in energy supply in the APC is led by renewables, which increase their share in the energy mix from 12% in 2020 to 35% by 2050 (compared with 25% in 2050 in the STEPS). Solar photovoltaics (PV) and wind in the electricity sector together contribute about 50% of the growth in renewables supply, and bioenergy contributes around 30%. Bioenergy use doubles in industry, triples in electricity generation and grows by a factor of four in transport: it plays an important role in reducing emissions from heat supply and removing CO2 from the atmosphere when it is combined with CCUS. Nuclear maintains its share of the energy mix, its output rising by a quarter to 2030 (compared with a 15% increase in the STEPS), driven by lifetime extensions at existing plants and new reactors in some countries.
Global coal use falls significantly more rapidly in the APC than in the STEPS. It drops from 5 250 million tonnes of coal equivalent (Mtce) in 2020 to 4 000 Mtce in 2030 and 2 600 Mtce in 2050 (compared with 4 300 Mtce in the STEPS in 2050). Most of this decline is due to reduced coal fired electricity generation in countries with net zero pledges as plants are repurposed, retrofitted or retired. In advanced economies, unabated coal fired power plants
Chapter 1 | Announced net zero pledges and the energy sector |
43 |
IEA. All rights reserved.
are generally phased out over the next 10 15 years. China’s coal consumption for electricity declines by 85% between 2020 and 2050 on its path towards carbon neutrality in 2060. These declines more than offset continued growth for coal in countries without net zero pledges. Globally, coal use in industry falls by 25% between 2020 and 2050, compared with a 5% decline in the STEPS.
Oil demand recovers slightly in the early 2020s but never again reaches its historic peak in 2019. It declines to 90 mb/d in the early 2030s and to 80 mb/d in 2050, around 25 mb/d lower than in the STEPS, thanks to a strong push to electrify transport and shifts to biofuels and hydrogen, especially in regions with pledges. Natural gas demand increases from about 3 900 bcm in 2020 to around 4 350 bcm in 2025, but is then broadly flat to 2050 (it continues to grow to around 5 700 bcm in the STEPS).
1.4.3Total final consumption
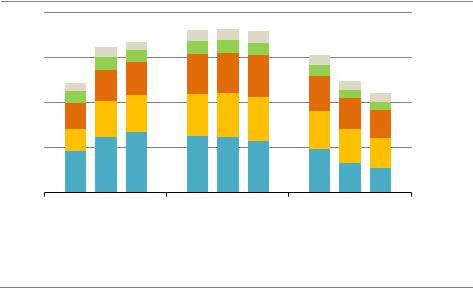
Global energy use continues to grow in all major end use sectors in the APC, albeit substantially more slowly than in the STEPS (Figure 1.13). Total final consumption (TFC) increases by around 20% in 2020 50, compared with a 35% increase globally in the STEPS. Measures to improve energy efficiency play a major role in the APC in reducing demand growth in countries with net zero pledges. Without those efficiency gains, electricity demand growth would make it much harder for renewables to displace fossil fuels in electricity generation. The biggest reduction in energy demand relative to the STEPS is in transport, thanks to an accelerated shift to electric vehicles (EVs), which are around three times as energy efficient as conventional internal combustion engine vehicles.
Figure 1.13 Total final consumption in the APC
200
EJ
150
100
50
 Coal
Coal
Industry Buildings
2020 |
2030 |
2040 |
2050 |
2020 |
2030 |
2040 |
2050 |
||||
|
Oil |
|
Natural gas |
|
Hydrogen |
|
Heat |
||||
|
|
|
|
||||||||
|
|
|
|
||||||||
Transport |
TFCshares |
100%
|
|
|
|
|
|
|
|
|
|
|
75% |
|
|
|
|
|
|
|
|
|
|
|
|
50% |
|
|
|
|
|
|
|
|
|
|
|
|
25% |
|
|
|
|
|
|
|
|
|
|
|
|
|
|
2020 |
2030 |
2040 |
2050 |
2020 |
2030 |
2040 |
2050 |
|
||||
|
Electricity |
|
|
Renewables |
|
Traditional use |
||||||
|
|
|
||||||||||
|
|
|
|
|
|
|
|
|
|
of biomass |
||
IEA. All rights reserved.
Announced net zero pledges lead to a shift away from fossil fuels globally to electricity, renewables and hydrogen. Electricity’s share rises from 20% to 30% in 2050
44 |
International Energy Agency | Special Report |

The fuel mix in final energy use shifts substantially in the APC. By 2050, electricity is the largest single fuel used in all sectors except transport, where oil remains dominant. The
persistence of oil in transport stems partly from the extent of its continued use in countries 1 without net zero pledges, and partly from the difficulty of electrifying substantial parts of the transport sector, notably trucking and aviation. Electricity does make inroads into transport, however, and rapid growth in the uptake of EVs puts oil use into decline after 2030, with EVs accounting for around 35% of global passenger car sales by 2030 and nearly 50% in 2050 in
the APC (versus around 25% in the STEPS in 2050). Electrification in the buildings sector is also much faster in the APC than in the STEPS.
The direct use of renewables expands in all end use sectors globally through to 2050. Modern bioenergy accounts for the bulk of this growth, predominantly through the blending of biomethane into natural gas networks and liquid biofuels in transport. This occurs mainly in regions with net zero pledges. Hydrogen and hydrogen based fuels play a larger role in the APC than in the STEPS, reaching almost 15 exajoules (EJ) in 2050, though they still account for only 3% of total final consumption worldwide in 2050. Transport accounts for more than two thirds of all hydrogen consumption in 2050. In parallel, on site hydrogen production in the industry and refining sectors gradually shifts towards low carbon technologies.
1.4.4Electricity generation
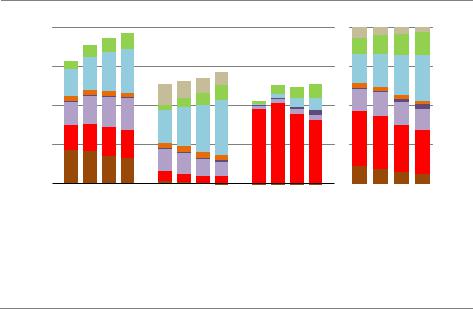
Global electricity generation nearly doubles during the next three decades in the APC, rising from about 26 800 terawatt hours (TWh) in 2020 to over 50 000 TWh in 2050, some 4 000 TWh higher than in the STEPS. Low emissions energy sources provide all the increase. The share of renewables in electricity generation rises from 29% in 2020 to nearly 70% in 2050, compared with about 55% in the STEPS, as solar PV and wind race ahead of all other sources of generation (Figure 1.14). By 2050, solar PV and wind together account for almost half of electricity supply. Hydropower also continues to expand, emerging as the third largest energy source in the electricity mix by 2050. Nuclear power increases steadily too, maintaining its global market share of about 10%, led by increases in China. Natural gas use in electricity increases slightly to the mid 2020s before starting to fall back, while coal’s share of electricity generation falls from around 35% in 2020 to below 10% in 2050. At that point, 20% of the remaining coal fired output comes from plants equipped with CCUS.
Hydrogen and ammonia start to emerge as fuel inputs to electricity generation by around 2030, used largely in combination with natural gas in gas turbines and with coal in coal fired power plants. This extends the life of existing assets, contributes to electricity system adequacy and reduces the overall costs of transforming the electricity sectors in many countries. Total battery capacity also rises substantially, reaching 1 600 gigawatts (GW) in 2050, 70% more than in the STEPS.
Chapter 1 | Announced net zero pledges and the energy sector
45 |
IEA. All rights reserved. |
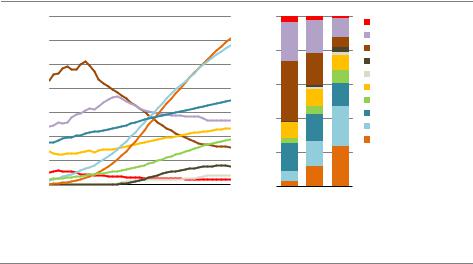
Figure 1.14 Global electricity generation by source in the APC
Thousand TWh
14 |
|
|
|
100% |
Oil |
|
|
|
|
|
|
12 |
|
|
|
|
Unabated natural gas |
|
|
|
80% |
Unabated coal |
|
|
|
|
|
||
10 |
|
|
|
|
Fossil fuels with CCUS |
|
|
|
|
60% |
Hydrogen based |
8 |
|
|
|
Nuclear |
|
6 |
|
|
|
|
Other renewables |
|
|
|
40% |
Hydropower |
|
|
|
|
|
Wind |
|
4 |
|
|
|
|
|
|
|
|
20% |
Solar PV |
|
2 |
|
|
|
|
|
|
|
|
|
|
|
2010 |
2020 |
2030 |
2040 |
2050 |
2020 2030 2050 |
IEA. All rights reserved.
Renewables reach new heights in the APC, rising from just under 30% of electricity supply in 2020 to nearly 70% in 2050, while coal-fired generation steadily declines
Note: Other renewables = geothermal, solar thermal and marine.
46 |
International Energy Agency | Special Report |

Chapter 2
A global pathway to net-zero CO emissions in 2050
S U M M A R Y
The Net Zero Emissions by 2050 Scenario (NZE) shows what is needed for the global energy sector to achieve net zero CO2 emissions by 2050. Alongside corresponding reductions in GHG emissions from outside the energy sector, this is consistent with limiting the global temperature rise to 1.5 °C without a temperature overshoot (with a 50% probability). Achieving this would require all governments to increase ambitions from current Nationally Determined Contributions and net zero pledges.
In the NZE, global energy related and industrial process CO2 emissions fall by nearly 40% between 2020 and 2030 and to net zero in 2050. Universal access to sustainable energy is achieved by 2030. There is a 75% reduction in methane emissions from fossil fuel use by 2030. These changes take place while the global economy more than doubles through to 2050 and the global population increases by 2 billion.
Total energy supply falls by 7% between 2020 and 2030 in the NZE and remains at around this level to 2050. Solar PV and wind become the leading sources of electricity globally before 2030 and together they provide nearly 70% of global generation in 2050. The traditional use of bioenergy is phased out by 2030.
Coal demand declines by 90% to less than 600 Mtce in 2050, oil declines by 75% to 24 mb/d, and natural gas declines by 55% to 1 750 bcm. The fossil fuels that remain in 2050 are used in the production of non energy goods where the carbon is embodied in the product (like plastics), in plants with carbon capture, utilisation and storage (CCUS), and in sectors where low emissions technology options are scarce.
Energy efficiency, wind and solar provide around half of emissions savings to 2030 in the NZE. They continue to deliver emissions reductions beyond 2030, but the period to 2050 sees increasing electrification, hydrogen use and CCUS deployment, for which not all technologies are available on the market today, and these provide more than half of emissions savings between 2030 and 2050. In 2050, there is 1.9 Gt of CO2 removal in the NZE and 520 million tonnes of low carbon hydrogen demand. Behavioural changes by citizens and businesses avoid 1.7 Gt CO2 emissions in 2030, curb energy demand growth, and facilitate clean energy transitions.
Annual energy sector investment, which averaged USD 2.3 trillion globally in recent years, jumps to USD 5 trillion by 2030 in the NZE. As a share of global GDP, average annual energy investment to 2050 in the NZE is around 1% higher than in recent years.
The NZE taps into all opportunities to decarbonise the energy sector, across all fuels and all technologies. But the path to 2050 has many uncertainties. If behavioural changes were to be more limited than envisaged in the NZE, or sustainable bioenergy less available, then the energy transition would be more expensive. A failure to develop CCUS for fossil fuels could delay or prevent the development of CCUS for process emissions from cement production and carbon removal technologies, making it much harder to achieve net zero emissions by 2050.
Chapter 2 | A global pathway to net-zero CO emissions in 2050 |
47 |
IEA. All rights reserved.

2.1Introduction
Achieving a global energy transition that is compatible with the world’s climate goals is unquestionably a formidable task. As highlighted in Chapter 1, current pledges by governments to reduce emissions to net zero collectively cover around 70% of today’s global economic activity and global CO2 emissions. The Announced Pledges Case shows that, if all those pledges were met in full, it would narrow the gap between where we are heading and where we need to be to achieve net zero emissions by 2050 worldwide. But it also shows that the gap would remain large. Meeting all existing net zero pledges in full would still leave 22 gigatonnes (Gt) of energy related and industrial process CO2 emissions globally in 2050, consistent with a temperature rise in 2100 of around 2.1 °C (with a 50% probability).
In this chapter, we examine the energy sector transformation which is embodied in our Net Zero Emissions by 2050 Scenario. First, it provides an overview of the key assumptions and market dynamics underlying the projections, including projected fossil fuel and CO2 prices. It discusses trends in global CO2 emissions, energy use and investment, including the key roles played by efficiency measures, behavioural change, electrification, renewables, hydrogen and hydrogen based fuels, bioenergy, and carbon capture, utilisation and storage (CCUS). Further, it discusses some of the key uncertainties surrounding the global pathway towards net zero emissions related to behavioural change, the availability of sustainable bioenergy, and the deployment of CCUS for fossil fuels. The transformation of specific energy sectors is assessed and discussed in detail in Chapter 3.
2.2Scenario design
The Net Zero Emissions by 2050 Scenario (NZE) is designed to show what is needed across the main sectors by various actors, and by when, for the world to achieve net zero energy related and industrial process CO2 emissions by 2050.1 It also aims to minimise methane emissions from the energy sector. In recent years, the energy sector was responsible for around three quarters of global greenhouse gas (GHG) emissions. Achieving net zero energy related and industrial process CO2 emissions by 2050 in the NZE does not rely on action in areas other than the energy sector, but limiting climate change does require such action. We therefore additionally examine the reductions in CO2 emissions from land use that would be commensurate with the transformation of the energy sector in the NZE, working in co operation with the International Institute for Applied Systems Analysis (IIASA). In parallel with action on reducing all other sources of GHG emissions, achieving net zero CO2 emissions from the energy sector by 2050 is consistent with around a 50% chance of limiting the long term average global temperature rise to 1.5 °C without a temperature overshoot (IPCC, 2018).
1 Unless otherwise stated, carbon dioxide (CO2) emissions in this chapter refer to energy related and industrial process CO2 emissions. Net zero CO2 emissions refers to zero CO2 emissions to the atmosphere, or with any residual CO2 emissions offset by CO2 removal from direct air capture or bioenergy with carbon capture and storage.
48 |
International Energy Agency | Special Report |

The NZE aims to ensure that energy related and industrial process CO2 emissions to 2030 are in line with reductions in 1.5 °C scenarios with no or low or limited temperature overshoot assessed in the IPCC in its Special Report on Global Warming of 1.5 °C.2 In addition, the NZE incorporates concrete action on the energy related United Nations Sustainable Development Goals related to achieving universal energy access by 2030 and delivering a major reduction
in air pollution. The projections in the NZE were generated by a hybrid model that combines 2 components of the IEA’s World Energy Model (WEM), which is used to produce the projections in the annual World Energy Outlook, and the Energy Technology Perspectives
(ETP) model.
Box 2.1 International Energy Agency modelling approach for the NZE
A new, hybrid modelling approach was adopted to develop the NZE and combines the relative strengths of the WEM and the ETP model. The WEM is a large scale simulation model designed to replicate how competitive energy markets function and to examine the implications of policies on a detailed sector by sector and region by region basis. The ETP model is a large scale partial optimisation model with detailed technology descriptions of more than 800 individual technologies across the energy conversion, industry, transport and buildings sectors.
This is the first time this modelling approach has been implemented. The combination of the two models allows for a unique set of insights on energy markets, investment, technologies, and the level and detail of policies that would be needed to bring about the energy sector transformation in the NZE.
Results from the WEM and ETP model have been coupled with the Greenhouse Gas Air Pollution Interactions and Synergies (GAINS) model developed by IIASA (Amann et al., 2011). The GAINS model is used to evaluate air pollutant emissions and resultant health impacts linked to air pollution. For the first time, IEA model results have also been coupled with the IIASA’s Global Biosphere Management Model (GLOBIOM) to provide data on land use and net emissions impacts of bioenergy demand.
The impacts of changes in investment and spending on global GDP in the NZE have been estimated by the International Monetary Fund (IMF) using the Global Integrated Monetary and Fiscal (GIMF) model. GIMF is a multi country dynamic stochastic general equilibrium model used by the IMF for policy and risk analysis (Laxton et al., 2010; Anderson et al., 2013). It has been used to produce the IMF’s World Economic Outlook scenario analyses since 2008.
There are many possible paths to achieve net zero CO2 emissions globally by 2050 and many uncertainties that could affect any of them; the NZE is therefore a path, not the path to net zero emissions. Much depends, for example, on the pace of innovation in new and emerging
2 The IPCC classifies scenarios as “no or limited temperature overshoot”, if temperatures exceed 1.5 °C by less than 0.1 °C but return to less than 1.5 °C in 2100, and as “higher overshoot”, if temperatures exceed 1.5 °C by 0.1 0.4 °C but return to less than 1.5 °C in 2100.
Chapter 2 | A global pathway to net-zero CO emissions in 2050 |
49 |
IEA. All rights reserved.