

01 POWER ISLAND / 02 H2+NH3 / IEA 2022 NetZeroby2050-ARoadmapfortheGlobalEnergySector
.pdf4.3Energy industry
4.3.1Oil and gas
The energy transition envisioned in the NZE involves a major contraction of oil and gas production with far reaching implications for all the companies that produce these fuels. Oil demand falls from around 90 million barrels per day (mb/d) in 2020 to 24 mb/d in 2050, while natural gas demand falls from 3 900 billion cubic metres (bcm) to around 1 700 bcm. No fossil fuel exploration is required in the NZE as no new oil and natural gas fields are required beyond those that have already been approved for development. This represents a clear threat to company earnings, but there are also opportunities. The resources and skills of the oil and gas industry are a good match with some of the new technologies needed to tackle emissions in sectors where reductions are likely to be most challenging, and to produce some of the low emissions liquids and gases for which there is a rapid increase in demand in the NZE (see Chapter 2). By partnering with governments and other stakeholders, the oil and gas industry could play a leading role in developing these fuels and technologies at scale, and in establishing new business models.
The oil and gas industry is highly diverse, and various companies could pursue very different strategies in the transition to net zero emissions. Minimising emissions from core oil and gas operations however should be a first order priority for all oil and gas companies. This includes tackling methane emissions that occur during operations (they fall by 75% between 2020 and 2030 in the NZE) and eliminating flaring. Companies should also electrify operations using renewable electricity wherever possible, either by purchasing electricity from the grid or by integrating off grid renewable energy sources into upstream facilities or transport infrastructure. Producers that can demonstrate strong and effective action to reduce emissions can credibly argue that their oil and gas resources should be preferred over higher emissions options.
Some oil and gas companies may choose to become “energy companies” focused on low emissions technologies and fuels, including renewable electricity, electricity distribution, EV charging and batteries. Several technologies that are critical to the achievement of net zero emissions, such as CCUS, hydrogen, bioenergy and offshore wind, look especially well suited to some of the existing skills, competencies and resources of oil and gas companies.
Carbon capture, utilisation and storage. The oil and gas industry is already the global leader in developing and deploying CCUS. Of the 40 million tonnes (Mt) of CO2 captured today at large scale facilities, around three quarters is captured from oil and gas operations, which often produce concentrated streams of CO2 that are relatively easy and cost effective to capture (IEA, 2020c). The oil and gas industry also has the large scale engineering, pipeline, sub surface and project management skills and capabilities to handle large volumes of CO2 and to help scale up the deployment of CCUS.
160 |
International Energy Agency | Special Report |

Low emissions hydrogen and hydrogen based fuels. Oil and gas companies could contribute to developing and deploying low emissions hydrogen in several ways (IEA, 2019a). Nearly 40% of hydrogen production in 2050 in the NZE is from natural gas in facilities equipped with CCUS, providing an important opportunity for companies and countries to utilise their natural gas resources in a way that is consistent with net zero emissions. Of the total output of 530 Mt of hydrogen in 2050, about 30% is processed into ammonia and synthetic fuels (equivalent to around 7.5 mboe/d). The transformation processes involved have many potential synergies with the skills and equipment used in oil and gas processing and refining. Oil and gas companies also have
long experience of transporting liquids and gases by pipeline and ships. |
4 |
|
Advanced biofuels and biomethane. The production of advanced biofuels grows |
||
|
||
substantially in the NZE, but this depends critically on continued technological |
|
|
innovation. Many oil and gas companies have active R&D programmes in these areas |
|
|
and could become leading producers. Biomethane – a low emissions alternative to |
|
|
natural gas – can be produced in large centralised facilities, which could be a good fit |
|
|
with the knowledge and technical expertise of existing gas producers (IEA, 2020d). |
|
Offshore wind. About 40% of the lifetime costs of a standard offshore wind project involve significant synergies with the offshore oil and gas sector (IEA, 2019b). The oil and gas industry has considerable experience of working in offshore locations, which could be of value in the construction of foundations and subsea structures for offshore wind farms, especially when using vessels during installation and operation. The experience of maintaining safety standards in oil and gas companies could also be helpful during maintenance and inspection of offshore wind farms once they are in operation.
Oil and gas companies are well placed to accelerate the pace of development and deployment of these technologies, and to gain a commercial edge over other companies. In the NZE, investment in low emissions technologies suited to the skills and expertise of oil and gas companies exceeds that in traditional oil and gas operations by 2030. Total capital spending on these technologies and on traditional oil and gas operations averages USD 650 billion per year over 2021 50, just less than annual investment in oil and gas projects between 2016 and 2020 (Figure 4.7).
Not all oil and gas companies will choose to follow a strategy of diversifying into other types of energy. For example, it is far from certain that national oil companies will be charged by their state owners to diversify and develop low emissions energy sources outside their core area of activity; other companies may decide simply to concentrate on supplying oil and natural gas as cleanly and efficiently as possible, and to return income to shareholders. What is clear, however, is that no oil and gas company would be unaffected by the NZE and that all parts of the industry need to decide how to respond (IEA, 2020e).
Chapter 4 | Wider implications of achieving net-zero emissions
161 |
IEA. All rights reserved. |
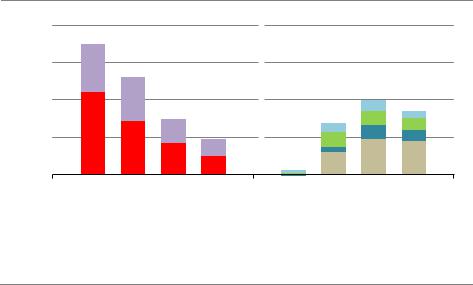
Figure 4.7 Annual average investment in oil and gas and low-emissions technologies with synergies for the oil and gas industry in the NZE
Billion USD (2019)
Oiland natural gas |
Low emissionstechnologies |
800
600
400
200
|
2016 |
2021 |
2031 |
2041 |
|
2016 |
2021 |
2031 |
2041 |
|||||
20 |
|
30 |
40 |
|
50 |
20 |
|
30 |
40 |
|
|
50 |
||
|
Oil |
|
Natural gas |
|
CCUS |
|
Hydrogen |
|
Bioenergy |
|
|
Offshore wind |
||
|
|
|
|
|
|
|||||||||
|
|
|
|
|
|
|||||||||
IEA. All rights reserved.
Investment in low-emissions technologies suited to the skills and expertise of oil and gas companies exceeds investment in traditional operations by 2030
Note: CCUS = carbon capture, utilisation and storage.
4.3.2Coal
The precipitous decline in coal use projected in the NZE would have major implications for the future of mining companies and countries with large existing production capacities. Around 470 million tonnes of coal equivalent (Mtce) of coal used in the NZE in 2050 is in facilities equipped with CCUS (80% of global coal demand in 2050), which prevents an even sharper decline in demand. But no new coal mines or mine extensions are needed in the NZE. Retraining and regional revitalisation programmes would be essential to reduce the social impact of job losses at the local level and to enable workers and communities to find alternative livelihoods. There could also be opportunities to locate new clean energy facilities, including the new processing facilities that are needed for critical minerals, in the areas most affected by mine closures.
For mining companies, however, the contraction in coal demand in the NZE could be offset by the need to increase mining of other raw minerals, including those vital to many clean energy technologies, such as copper, lithium and nickel (IEA, 2021a). Global demand for these critical minerals rises rapidly in the NZE (Figure 4.8). For example, demand for lithium for use in batteries expands by a factor of 30 by 2030, while demand for rare earths, primarily used for making EV motors and wind turbines, increases by a factor of ten by 2030. Critical mineral resources are not always located in the same locations or countries as existing coal mines, but the skills and experience of mining companies will be essential to ensure that the supply of these minerals is able to match demand at reasonable prices. By the 2040s, the size of the global market for these minerals approaches that for coal today.
162 |
International Energy Agency | Special Report |

Figure 4.8
(2019) |
500 |
|
|
Billion USD |
400 |
300 |
|
|
200 |
|
100 |
Global value of coal and selected critical minerals in the NZE
 Coal
Coal
Criticalminerals
 Rare earth
 Silicon
 Manganese
 Cobalt
 Graphite
 Nickel
 Lithium 4
 Copper
2020 |
2030 |
2040 |
2050 |
IEA. All rights reserved.
The market for critical minerals approaches that of coal today in the 2040s
Notes: Includes total revenue for coal and for selected critical minerals used in clean energy technologies. The prices of critical minerals are based on conservative assumptions about cost increases (around a 10% 20% increase from current levels to 2050).
4.3.3Electricity
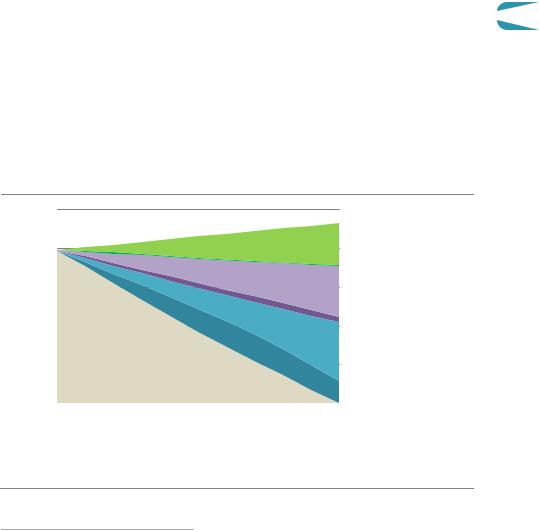
Getting to net zero emissions calls for a massive expansion of the electricity sector to power the needs of a growing global economy, the electrification of end uses that previously used fossil fuels, and the production of hydrogen from electrolysis. While electricity demand increases more than two and a half times, the rapid transformation of the industry means that total electricity supply costs triple from 2020 to 2050 in the NZE, raising average costs per unit of electricity generation modestly (Figure 4.9).
The electricity supply industry also becomes much more capital intensive, accelerating a recent trend. The share of capital in total costs rises from less than 60% in 2020 (already ten percentage points higher than in 2010) to about 80% in 2050. This is largely due to a massive increase in renewable energy and the corresponding need for more network capacity and sources of flexibility, including battery storage. In the late 2020s and 2030s, the upgrading and replacement of existing solar and wind capacity as they come to the end of their operating lives also boosts capital needs.6 New nuclear power capacity additions add further capital spending in the NZE. The rising capital intensity of the electricity industry increases the importance of limiting risk for new investment and ensuring sufficient revenues in all years for grid operators to fund rising investment needs – a point underlined by the financial difficulties experienced by some network companies in 2020 due to depressed electricity demand resulting from the Covid 19 crisis (IEA, 2020f).
6 They typically need replacing after 25 30 years of operation, whereas many conventional hydropower, nuclear and coal plants operate far longer albeit with periodic additional investment.
Chapter 4 | Wider implications of achieving net-zero emissions |
163 |
IEA. All rights reserved.
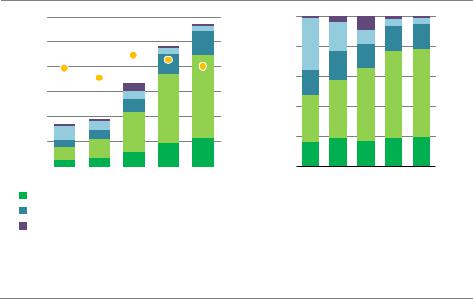
Figure 4.9 Global electricity supply costs by component in the NZE
(2019) |
6 |
|
|
|
|
|
|
5 |
|
|
|
|
|
|
|
USD |
|
|
|
|
|
|
|
4 |
|
|
|
|
|
|
|
Trillion |
|
|
|
|
|
|
|
3 |
|
|
|
|
|
|
|
|
2 |
|
|
|
|
|
|
|
1 |
|
|
|
|
|
|
|
|
|
|
|
|
|
|
|
2010 |
2020 |
2030 |
2040 |
2050 |
|
|
|
Grids |
|
|
|
|
|
|
|
Power plant operations and maintenance |
||||||
|
CO price |
|
|
|
|
|
|
120 |
(2019) |
100% |
|
100 |
80% |
||
MWh |
|||
|
|||
80 |
60% |
||
60 |
per |
||
|
|||
USD |
40% |
||
40 |
|||
|
|
20 |
20% |
|
2010 2020 2030 2040 2050
 Power plant capital recovery
 Fuel
Fuel
 Average cost (right axis)
IEA. All rights reserved.
Electricity system costs triple to 2050, raising average supply costs modestly; the massive growth of renewables makes the industry more capital intensive
Notes: Electricity supply costs include all the direct costs to produce and transmit electricity to consumers. Battery storage systems are included in power plant capital recovery.
The rising share of renewables in the electricity generation mix has important implications for the design of electricity markets. When the shares of solar, wind, other variable renewables and nuclear power reach high levels, available electricity supply at no marginal cost is often above electricity demand, resulting in a wholesale price of electricity that is zero or even negative. By 2050, without changes in electricity market design, about 7% of wind and solar output in the NZE would be above and beyond what can be integrated (and so curtailed), and the share of zero price hours in the year would increase to around 30% in major markets from close to zero today, despite the active use of demand response. If the share of renewables in the electricity generation mix is to rise as envisioned in the NZE, it would therefore be highly desirable to effect significant changes in the design of electricity markets so as to provide signals for investment, including investment in sources of flexibility such as battery storage and dispatchable power plants.
The increase in electricity use inevitably raises associated costs. Operating and maintaining power plants worldwide costs close to USD 1 trillion in 2050 in the NZE, two and a half times the level in 2020. In 2020, upkeep at fossil fuel power plants accounted for USD 150 billion, and renewables required nearly as much, mostly for hydropower. By 2050, the cost of operating and maintaining renewables reaches USD 780 billion, most it needed for wind and solar photovoltaics (PV) as a result of their massive scaling up: offshore wind alone accounts for USD 90 billion.
164 |
International Energy Agency | Special Report |

The sharp reduction of fossil fuel use in the electricity industry and lower fuel prices mean that costs related to fuel and CO2 prices are significantly reduced. This continues a recent trend driven by near record low natural gas prices in many markets. Even with rising CO2 prices over time, the rapid decarbonisation of electricity means that fuel and CO2 make up a declining share of total costs, falling from about one quarter in 2020 to 5% in 2050. The balance of fuel costs shifts towards low emissions sources, mainly nuclear power and bioenergy (including with CCUS), though some still remains related to natural gas and coal used in power plants equipped with CCUS.
One challenge in this context is what to do about the coal fired power plants in operation. In
2020, over 2 100 gigawatts (GW) of power plants worldwide used coal to produce electricity 4 and heat, and they emitted nearly 30% of all energy related CO2 emissions. Options include retrofitting coal fired power plants with CCUS technologies, co firing with biomass or ammonia; repurposing coal plants to focus on providing flexibility; and, where feasible, phasing them out. In the NZE, all unabated coal fired power plants are phased out in advanced economies by 2030 and in emerging market and developing economies by 2040.
As a result, emissions from coal fired power plants fall from 9.8 gigatonnes (Gt) in 2020 to 3.0 Gt in 2030 and to just 0.1 Gt by 2040 (residual emissions from coal with CCUS plants).7
Another challenge is related to the scale of capacity retirements envisaged and associated site rehabilitation, starting with coal. The pace of retirement of coal fired power plants over 2020 50 is nearly triple that of the past decade. Decommissioning at each site can often last a decade and entail significant cost, and may involve closing a mine as well. In some cases, it may be financially attractive to build a renewable energy project on the same site, taking advantage of the grid connection and limiting the cost of rehabilitation. Thousands of natural gas fired and oil fired power plants are also retired by 2050, though these sites are often strategically located on the grid and many are likely to be replaced directly with battery storage systems.
The large fleet of ageing nuclear reactors in advanced economies means their decommissioning increases, despite many reactor lifetime extensions. In the NZE, annual average nuclear retirements globally are 60% higher over the next 30 years than in the last decade. Each nuclear decommissioning project can span decades, with costs ranging from several hundred million dollars to well over USD 1 billion for large reactors (NEA, 2016).
4.3.4Energy consuming industries
The changes in the NZE would have an enormous impact on industries that manufacture vehicles and their material and component suppliers. Around 95% of all the cars and nearly all of the trucks sold worldwide in 2020 were conventional vehicles with an internal combustion engine. In the NZE, about 60% of global car sales in 2030 are EVs, and 85% of
7 A CO2 capture rate of 90% is assumed, though higher rates are technically possible with reduced efficiencies and additional costs (IEA, 2020g).
Chapter 4 | Wider implications of achieving net-zero emissions |
165 |
IEA. All rights reserved.
heavy duty trucks sold in 2040 are EVs or fuel cell vehicles. In the NZE, vehicle component suppliers and vehicle manufacturers alike retool factories, change designs to incorporate batteries and fuel cells, and adjust supply chains to minimise the lifecycle emissions intensities of vehicles. This provides opportunities to redesign existing parts and manufacturing processes to improve efficiency and lower costs.
The rapid increase in EV sales in the NZE requires an immediate scale up of new supply chains for batteries as well as recharging and low emissions refuelling infrastructure. In the NZE, battery production capacity increases to more than 6.5 terawatt hours (TWh) by 2030, compared with less than 0.2 TWh in 2020. Any delay in expanding battery manufacturing capacity would have a detrimental impact on the roll out of EVs and slow cost reductions for other clean energy technologies that benefit in the NZE from having similar manufacturing processes and know how (such as fuel cell vehicles and electrolysers).
In aviation and shipping, liquid low emissions fuels are central to cut emissions. Switching to some of these would have little impact on vessel design: the use of hydrogen based fuels or biofuels in shipping would only require changes to the motor and fuel system, and bio kerosene or synthetic kerosene can operate with existing aircraft. New bunkering and refuelling infrastructure are needed in the NZE, however, and the use of these low emissions fuels also requires new safety and standardisation standards, protocols for permitting, construction and design, as well as international regulation, monitoring, reporting and verification of their production and use.
In heavy industrial sectors – steel, cement and chemicals – most deep emissions reduction technologies are not available on the market today. In the NZE, material producers soon demonstrate near zero emission processes, aided by government risk sharing mechanisms, and start to adapt their existing production assets. For multinational companies, this includes developing technology transfer strategies to roll out processes across plants. International co operation would help to ensure a level playing field for all. Within countries, efforts focus on industrial hubs in order to accelerate emissions reductions across multiple industrial sectors by promoting economies of scale for new infrastructure (such as CO2 transport and storage) and supplies of low emissions energy.
Materials producers work with governments in the NZE to create an international certification system for near zero emission materials to differentiate them from conventional ones. This would enable buyers of materials such as vehicle manufacturers and construction companies to enter into commercial agreements to purchase near zero emissions materials at a price premium. In most cases, the premium would result in only a modest impact on the final price of the product price given that materials generally account for a small portion of manufacturing costs (Material Economics, 2019).
166 |
International Energy Agency | Special Report |
4.4Citizens
4.4.1Energy related Sustainable Development Goals
An inclusive and people centred transition is key to the world moving rapidly, collectively and consistently toward net zero emissions by mid century. The NZE achieves the United Nations energy related Sustainable Development Goals (SDGs) of universal access to clean modern energy by 2030 (SDG 7.1) and reducing premature deaths caused by air pollution (SDG 3.9). The technologies, options and measures used to achieve full access to low emissions electricity and clean cooking solutions by 2030 in the NZE also help to reduce
greenhouse gas (GHG) emissions from household energy use.
4
Energy access
About 790 million people worldwide did not have access to electricity in 2020, most of them living in sub Saharan Africa and developing Asia. Around 2.6 billion people did not have access to clean cooking options: 35% of them were in sub Saharan Africa, 25% in India and 15% in China. A lack of access to energy not only impedes economic development, but also causes serious harm to health and is a barrier to progress on gender equality and education.8
Figure 4.10 People gaining access to electricity by type of connection in emerging market and developing economies in the NZE
people |
1 000 |
|
|
|
|
|
|
|
|
|
|
|
|
Stand alone renewables |
|
|
|
|
|
|
|
|
|
|
|
|
|
|
|
|
|
Million |
800 |
|
|
|
|
|
Stand alone |
|
|
|
|
|
|||
|
|
|
|
|
|||
|
|
|
|
|
|
Mini grids renewables |
|
|
|
|
|
|
|
|
|
|
|
|
|
|
|
|
|
|
600 |
|
|
|
|
|
Mini grids |
|
|
|
|
|
|
||
|
|
|
|
|
|
||
|
|
|
|
|
|
Grid renewables |
|
|
|
|
|
|
|
||
|
|
|
|
|
|
|
|
|
|
|
|
|
|
|
Grid |
|
|
|
|
|
|
|
|
|
|
|
|
|
|
|
|
|
400 |
|
|
|
|
|
Without access |
|
|
|
|
|
|
||
|
|
|
|
|
|
||
|
200 |
|
|
|
|
|
|
|
|
|
|
|
|
|
|
|
2020 |
2025 |
2030 |
|
|||
|
|
|
|
|
|
|
IEA. All rights reserved. |
More than 80% of people gaining access to electricity by 2030 are supplied renewable power and just over half via off-grid systems
8 Households relying on the traditional use of biomass for cooking dedicate around 1.4 hours each day collecting firewood and several hours cooking with inefficient stoves, a burden largely borne by women (IEA, 2017).
Chapter 4 | Wider implications of achieving net-zero emissions |
167 |
IEA. All rights reserved.

Around 45% of those who lack access to electricity by 2030 gain it via a connection to a main grid, while the rest are served by mini grids (30%) and stand alone solutions (25%) (Figure 4.10). Almost all off grid or mini grid solutions are 100% renewable. Decentralised systems that rely on diesel generators, which are also deployed in some grid connected systems to compensate for low reliability, are phased out later and replaced with solar storage systems. Achieving full access does not lead to a significant increase in global emissions: in 2030 it adds less than 0.2% to CO2 emissions. Achieving full access to electricity also brings efficiency gains and accelerates the electrification of appliances, which become critical to emissions reductions in buildings after 2030 in emerging market and developing economies.
For clean cooking, 55% of those gaining access by 2030 in the NZE do so through improved biomass cookstoves (ICS) fuelled by modern biomass, biogas or ethanol, 25% through the use of liquefied petroleum gas (LPG) and 20% via electric cooking solutions (Figure 4.11). LPG is the main fuel adopted in urban areas and ICS is the main option in rural areas. The use of LPG results in a slight increase in CO2 emissions in 2030 but a net reduction in overall GHG emissions due to reduced methane, nitrous oxides and black carbon emissions from the traditional use of biomass. In addition, LPG is increasingly decarbonised after 2030 using bio sourced butane and propane (bioLPG) produced sustainably from municipal solid waste (MSW) and other renewable feedstocks. The technical potential of bioLPG production from MSW in 2050 in Africa could be enough to satisfy the cooking needs of more than 750 million people (GLPGP, 2020; Liquid Gas Europe, 2021).
Figure 4.11 Primary cooking fuel by share of population in emerging market and developing economies in the NZE
100% |
|
|
|
|
|
|
WithoutAccess |
||
80% |
|
|
|
|
|
|
|
|
Other polluting |
|
|
|
|
|
|
|
|
||
|
|
|
|
|
|
|
|
||
|
|
|
|
|
|
|
|
Traditional biomass |
|
|
|
|
|
|
|
|
|
||
|
|
|
|
|
|
|
|
||
60% |
|
|
|
|
|
|
WithAccess |
||
|
|
|
|
|
|
|
|
Modern bioenergy |
|
|
|
|
|
|
|
|
|
||
|
|
|
|
|
|
|
|
||
40% |
|
|
|
|
|
|
|
|
Natural gas |
|
|
|
|
|
|
|
|
||
|
|
|
|
|
|
|
|
||
|
|
|
|
|
|
|
|
LPG |
|
|
|
|
|
|
|
|
|
||
|
|
|
|
|
|
|
|
||
20% |
|
|
|
|
|
|
|
|
Electricity |
|
|
|
|
|
|
|
|
||
|
|
|
|
|
|
|
|
||
|
|
|
|
|
|
|
|
|
|
|
|
|
|
|
|
|
|
|
|
2020 |
2025 |
2030 |
2035 |
2040 |
2050 |
|
|
|
|
|
|
|
|
|
|
|
|
|
IEA. All rights reserved. |
Traditional biomass is entirely replaced with modern energy by 2030, mainly in the form of bioenergy and LPG; by 2050, electricity, bioenergy and bioLPG meet most cooking needs
Notes: Modern bioenergy includes improved cook stoves, biogas and ethanol. Liquefied petroleum gas (LPG) includes fossil and renewable fuel.
168 |
International Energy Agency | Special Report |
The achievement of universal access to clean energy by 2030 requires governments and donors to put expanding access at the heart of recovery plans and programmes. There would be multiple benefits: investing heavily in energy access would provide an immediate economic boost, create local jobs and bring durable improvements to social well being by modernising health services and food chains. In the NZE, around USD 35 billion is spent each year improving access to electricity and almost USD 7 billion each year on clean cooking solutions for people in low income countries from now to 2030.
Air pollution and health
More than 90% of people around the world are exposed to polluted air today. Such pollution
led to around 5.4 million premature deaths in 2020, undermining economic productivity and 4 placing extra stress on healthcare systems. Most of these deaths were in emerging market
and developing economies. Just over half were caused by exposure to outdoor air pollution; the remainder resulted from breathing polluted air indoors, caused mainly by the traditional use of biomass for cooking and heating.
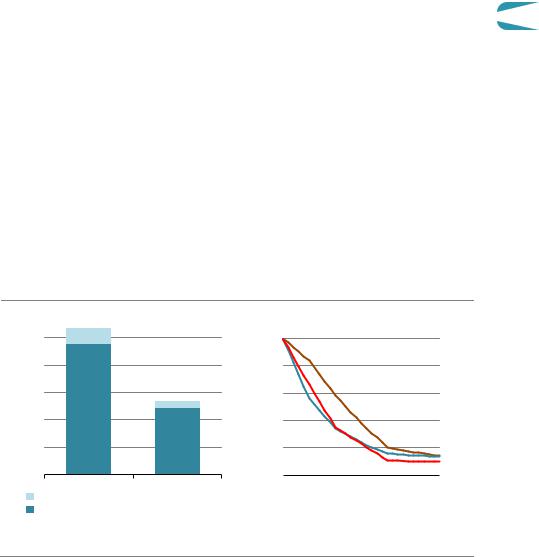
Energy related emissions of the three major air pollutants – sulphur dioxide (SO2), nitrogen oxides (NOX) and fine particulate matter (PM2.5) – fall rapidly in the NZE. SO2 emissions fall by 85% between 2020 and 2050, mainly as a result of the large scale phase out of coal fired power plants and industrial facilities. NOX emissions also drop by around 85% as a result of the increased use of electricity, hydrogen and ammonia in the transport sector. The increased uptake of clean cooking fuels in developing countries, together with air pollution control measures in industry and transport, results in a 90% drop in PM2.5 emissions (Figure 4.12). The reduction in air pollution in the NZE leads to roughly a halving in premature deaths in 2050 compared with 2020, saving the lives of about 2 million people per year, around 85% of them in emerging market and developing economies.
Figure 4.12 Global premature deaths and air pollutant emissions in the NZE
Prematuredeaths |
Changeinair pollutantemissions |
Millionpeople |
5 |
|
(2020Index= 100) |
100 |
|
|
|
4 |
|
80 |
|
|
|
||
|
|
|
|
|
|
||
|
3 |
|
|
60 |
|
|
|
|
2 |
|
|
40 |
|
|
|
|
1 |
|
|
20 |
|
|
NOx |
|
|
|
|
|
|
|
SO2 |
|
2020 |
2050 |
|
|
|
|
PM2.5 |
|
|
2020 |
2030 |
2040 |
2050 |
||
|
Advanced economies |
|
|
|
|
|
|
|
Emerging market and developing economies |
|
|
|
|
||
|
|
|
|
|
|
IEA. All rights reserved. |
|
Reductions in major air pollutants mean 2 million fewer premature deaths per year
Sources: IEA analysis based on IIASA.
Chapter 4 | Wider implications of achieving net-zero emissions |
169 |
IEA. All rights reserved.