

01 POWER ISLAND / 02 H2+NH3 / IEA 2022 NetZeroby2050-ARoadmapfortheGlobalEnergySector
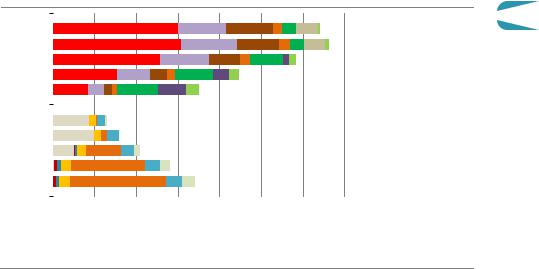
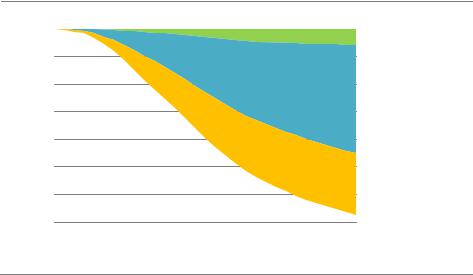
.pdfFigure 2.8 Solid, liquid and gaseous fuels in the NZE
EJ
|
|
|
|
Solids |
|
|
|
|
|
Liquids |
|
|
|
|
|
|
Gases |
|
|
||||
200 |
|
|
|
|
|
|
|
|
|
|
|
|
|
|
|
|
|
|
|
|
|
|
|
150 |
|
|
|
|
|
|
|
|
|
|
|
|
|
|
|
|
|
|
|
|
|
|
|
100 |
|
|
|
|
|
|
|
|
|
|
|
|
|
|
|
|
|
|
|
|
|
|
|
50 |
|
|
|
|
|
|
|
|
|
|
|
|
|
|
|
|
|
|
|
|
|
|
|
|
|
|
|
|
|
|
|
|
|
|
|
|
|
|
|
|
|
|
|
|
|
|
|
2000 |
2010 |
2020 |
2030 |
2040 |
2050 |
2000 |
2010 |
2020 |
2030 |
2040 |
2050 |
2000 |
2010 |
2020 |
2030 |
2040 |
2050 |
||||||
|
Coal |
|
|
|
|
Oil |
|
|
|
|
|
Natural gas |
|
|
|
Hydrogen conversion |
|||||||
|
|
|
|
|
|
|
|
|
|
|
|
||||||||||||
|
Traditional biomass |
|
|
Modern bioenergy |
|
|
Hydrogen based |
|
|
|
|
losses |
|
|
|
||||||||
|
|
|
|
|
|
|
|
|
|
|
|
||||||||||||
|
|
|
|
|
|
|
|
|
|
|
|
||||||||||||
IEA. All rights reserved.
Increases in low-emissions solids, liquids and gases from bioenergy, hydrogen and hydrogen-based fuels offset some of the declines in coal, oil and natural gas
Notes: Hydrogen conversion losses = consumption of natural gas when producing low carbon merchant hydrogen using steam methane reforming. Hydrogen based includes hydrogen, ammonia and synthetic fuels.
2.4.2Total final consumption
Total final consumption worldwide rebounds marginally following its 5% drop in 2020, but it never returns to 2019 levels in the NZE (435 EJ). It falls by just under 1% each year on average between 2025 and 2050 to 340 EJ. Energy efficiency measures and electrification are the two main contributing factors, with behavioural changes and materials efficiency also playing a role. Without these improvements, final energy consumption in 2050 would be around 640 EJ, around 90% higher than the level in the NZE. Final consumption of electricity increases by 25% from 2020 to 2030, and by 2050 it is more than double the level in 2020. The increase in electricity consumption from end uses sectors and from hydrogen production means that overall annual electricity demand growth is equivalent to adding an electricity market the size of India every year in the NZE. The share of electricity in global final energy consumption jumps from 20% in 2020 to 26% in 2030 and to around 50% in 2050 (Figure 2.9). The direct use of renewables in buildings and industry together with low emissions fuels such as bioenergy and hydrogen based fuels provide a further 28% of final energy consumption in 2050; fossil fuels comprise the remainder, most of which are used in non emitting processes or in facilities equipped with CCUS.
In industry, most of the global emissions reductions in the NZE during the period to 2030 are delivered through energy and materials efficiency improvements, electrification of heat, and fuel switching to solar thermal, geothermal and bioenergy. Thereafter, CCUS and hydrogen play an increasingly important role in reducing CO2 emissions, especially in heavy industries such as steel, cement and chemicals. Electricity consumption in industry more than doubles between 2020 and 2050, providing 45% of total industrial energy needs in 2050 (Figure 2.10).
60 |
International Energy Agency | Special Report |
The demand for merchant hydrogen in industry increases from less than 1 Mt today to around 40 Mt in 2050. A further 10% of industrial energy demand in 2050 is met by fossil fuels used in plants equipped with CCUS.
Figure 2.9 Global total final consumption by fuel in the NZE
other |
2010 |
|
|
|
|
|
|
|
|
|
Fuels and other |
|
|
|
|
|
|
|
|
|
|||||
|
|
|
|
|
|
|
|
|
|
Oil |
||
|
|
|
|
|
|
|
|
|
|
|||
2020 |
|
|
|
|
|
|
|
|
|
|
Natural gas |
|
|
|
|
|
|
|
|
|
|
|
|||
|
|
|
|
|
|
|
|
|
|
|||
and |
2030 |
|
|
|
|
|
|
|
|
|
|
Coal |
|
|
|
|
|
|
|
|
|
|
|||
|
|
|
|
|
|
|
|
|
|
Heat |
||
Fuels |
2050 |
|
|
|
|
|
|
|
|
|
|
|
|
|
|
|
|
|
|
|
|
|
Traditional use |
||
|
2040 |
|
|
|
|
|
|
|
|
|
|
Modern bioenergy |
|
|
|
|
|
|
|
|
|
|
|
|
of biomass |
|
|
|
|
|
|
|
|
|
|
|
|
|
use |
2010 |
|
|
|
|
|
|
|
|
|
|
Hydrogen based |
|
|
|
|
|
|
|
|
|
|
|||
|
|
|
|
|
|
|
|
|
|
Other renewables |
||
2020 |
|
|
|
|
|
|
|
|
|
|
||
|
|
|
|
|
|
|
|
Electricityuse |
||||
Electricity |
|
|
|
|
|
|
|
|
||||
2030 |
|
|
|
|
|
|
|
|
|
|
Fossil fuels unabated |
|
|
|
|
|
|
|
|
|
|
|
|||
|
2040 |
|
|
|
|
|
|
|
|
|
|
Fossil fuels with CCUS |
|
|
|
|
|
|
|
|
|
|
|
||
|
2050 |
|
|
|
|
|
|
|
|
|
|
Hydrogen based |
|
|
|
|
|
|
|
|
|
|
|
||
|
|
|
|
|
|
|
|
|
|
|
Nuclear |
|
|
|
|
|
|
|
|
|
|
|
|
||
|
|
|
|
|
|
|
|
|
|
|
|
Solar PV and wind |
|
|
|
|
|
|
|
|
|
|
|
|
|
|
50 |
100 |
150 |
200 |
250 |
300 |
EJ |
350 |
|
|
Hydro |
|
|
|
|
||||||||||
|
|
|
|
|
|
|
|
|
|
|
Other renewables |
|
|
|
|
|
|
|
|
|
|
|
|
||
|
|
|
|
|
|
|
|
|
|
|
||
IEA. All rights reserved.
The share of electricity in final energy use jumps from 20% in 2020 to 50% in 2050
Note: Hydrogen based includes hydrogen, ammonia and synthetic fuels.
In transport, there is a rapid transition away from oil worldwide, which provided more than 90% of fuel use in 2020. In road transport, electricity comes to dominate the sector, providing more than 60% of energy use in 2050, while hydrogen and hydrogen based fuels play a smaller role, mainly in fuelling long haul heavy duty trucks. In shipping, energy efficiency improvements significantly reduce energy needs (especially up to 2030), while advanced biofuels and hydrogen based fuels, such as ammonia, increasingly displace oil. In aviation, the use of synthetic liquids and advanced biofuels grows rapidly, and their share of total energy demand rises from almost zero today to almost 80% in 2050. Overall, electricity becomes the dominant fuel in the transport sector globally by the early 2040s, and it accounts for around 45% of energy consumption in the sector in 2050 (compared with 1.5% in 2020). Hydrogen and hydrogen based fuels account for nearly 30% of consumption (almost zero in 2020) and bioenergy for a further 15% (around 4% in 2020).
In buildings, the electrification of end uses including heating leads to demand for electricity increasing by around 35% between 2020 and 2050: it becomes the dominant fuel, reaching 16 000 terawatt hours (TWh) in 2050, and accounting for two thirds of total buildings sector energy consumption. By 2050, two thirds of residential buildings in advanced economies and around 40% of residential buildings in emerging market and developing economies are fitted with a heat pump. Onsite renewables based energy systems such as solar water heaters and biomass boilers provide a further quarter of final energy use in the buildings sector in 2050 (up from 6% in 2020). Low emissions district heating and hydrogen provide only 7% of energy use, but play a significant role in some regions.
Chapter 2 | A global pathway to net-zero CO emissions in 2050 |
61 |
2
IEA. All rights reserved.

Figure 2.10 Global final energy consumption by sector and fuel in the NZE
EJ
Industry |
Transport |
Buildings |
200 |
|
|
160
120
80
40
 Other
Other
 Hydrogen based
 Other renewables
 Modern bioenergy
 Traditional use of biomass
 Electricity
 Fossil fuels with CCUS
  Unabated fossil fuels
2010 |
2020 |
2030 |
2040 |
2050 |
2010 |
2020 |
2030 |
2040 |
2050 |
2010 |
2020 |
2030 |
2040 |
2050 |
IEA. All rights reserved.
There is a wholesale shift away from unabated fossil fuel use to electricity, renewables, hydrogen and hydrogen-based fuels, modern bioenergy and CCUS in end-use sectors
Note: Hydrogen based includes hydrogen, ammonia and synthetic fuels.
Buildings energy consumption falls by 25% between 2020 and 2030, largely as a result of a major push to improve efficiency and to phase out the traditional use of solid biomass for cooking: it is replaced by liquefied petroleum gas (LPG), biogas, electric cookers and improved bioenergy stoves. Universal access to electricity is achieved by 2030, and this adds less than 1% to global electricity demand in 2030. Energy consumption in the buildings sector contracts by around 15% between 2030 and 2050 given continued efficiency improvements and electrification. By 2050, energy use in buildings is 35% lower than in 2020. Energy efficiency measures – including improving building envelopes and ensuring that all new appliances brought to market are the most efficient models available – play a key role in limiting the rise in electricity demand in the NZE. Without these measures, electricity demand in buildings would be around 10 000 TWh higher in 2050, or around 70% higher than the level in the NZE.
S P O T L I G H T
How does the NZE compare with similar 1.5 °C scenarios assessed by the IPCC?
The IPCC SR1.5 includes 90 individual scenarios that have at least a 50% chance of limiting warming in 2100 to 1.5 °C (IPCC, 2018).9 Only 18 of these scenarios have net zero CO2 energy sector and industrial process emissions in 2050. In other words, only one in five of the 1.5 °C scenarios assessed by the IPCC have the same level of emissions reduction
9 Includes 53 scenarios with no or limited temperature overshoot and 37 scenarios with a higher temperature overshoot.
62 |
International Energy Agency | Special Report |
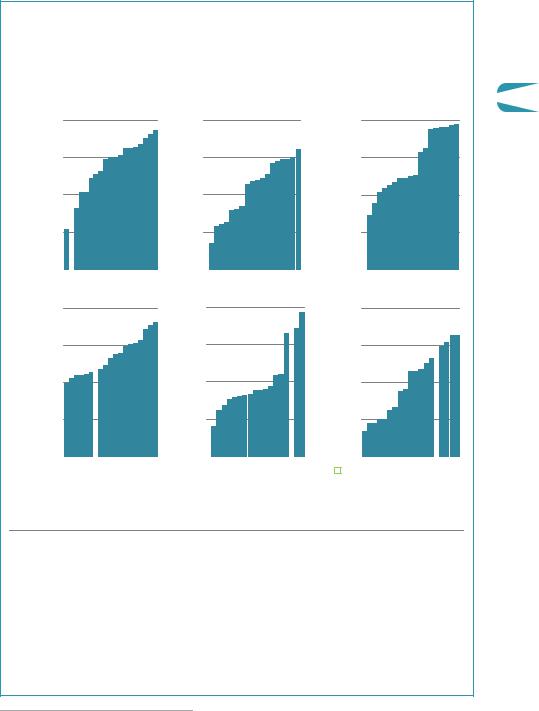
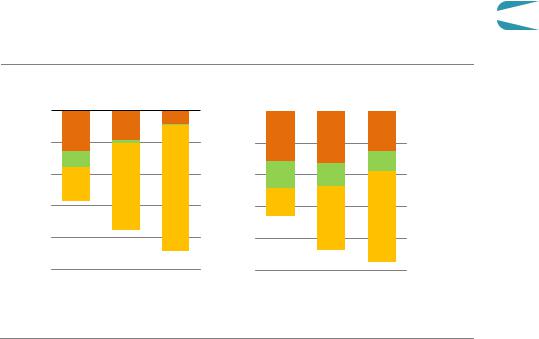
ambition for the energy and industrial process sectors to 2050 as the NZE.10 Some comparisons between these 18 scenarios and the NZE in 2050 (Figure 2.11):
Figure 2.11 Comparison of selected indicators of the IPCC scenarios and
|
|
|
|
|
the NZE in 2050 |
|
|
|
|
|
|
|
|
|
|
|
|
|
2 |
||||
|
|
|
|
|
|
|
|
|
|
|
|
|
|
|
|
|
|
|
|
|
|
|
|
2 |
20 |
|
|
CCUS |
|
|
|
20 |
Energy relatedCDR |
320 |
|
BioenergyTES |
|||||||||||
|
|
|
|
|
|
|
|||||||||||||||||
|
|
|
|
|
|
CO |
|
|
|
|
|
|
|
|
|
|
|
||||||
CO |
|
|
|
|
|
|
|
|
|
|
|
|
|
EJ |
|
|
|
|
|
|
|||
Gt |
15 |
|
|
|
|
|
|
Gt |
15 |
|
|
|
|
|
240 |
|
|
|
|
|
|
||
|
|
|
|
|
|
|
|
|
|
|
|
|
|
|
|
|
|
|
|||||
|
10 |
|
|
|
|
|
|
|
10 |
|
|
|
|
|
160 |
|
|
|
|
|
|
||
|
5 |
|
|
|
|
|
|
|
5 |
|
|
|
|
|
80 |
|
|
|
|
|
|
||
|
|
|
|
|
|
|
|
|
|
|
|
|
|
|
|
|
|
|
|||||
|
|
|
|
|
|
|
|
|
|
|
|
|
|
|
|
|
|
|
|||||
|
|
|
|
|
|
|
|
|
|
|
|
|
|
|
|
|
|
|
|
||||
|
|
|
|
|
|
|
|
|
|
|
|
|
|
|
|
|
|
|
|
|
|
|
|
EJ |
600 |
|
|
|
TFC |
|
|
EJ |
40 |
|
Hydrogenin TFC |
100% |
Wind and solar share |
|
|||||||||
|
|
|
|
|
|
|
|
|
|
|
|
|
|
|
|
|
|
|
|
|
|
||
|
450 |
|
|
|
|
|
|
|
30 |
|
|
|
|
|
75% |
|
|
|
|
|
|
||
|
|
|
|
|
|
|
|
|
|
|
|
|
|
|
|
|
|
|
|||||
|
300 |
|
|
|
|
|
|
|
20 |
|
|
|
|
|
50% |
|
|
|
|
|
|
||
|
|
|
|
|
|
|
|
|
|
|
|
|
|
|
|
|
|
|
|||||
|
|
|
|
|
|
|
|
|
|
|
|
|
|
|
|
|
|
|
|||||
|
150 |
|
|
|
|
|
|
|
10 |
|
|
|
|
|
25% |
|
|
|
|
|
|
||
|
|
|
|
|
|
|
|
|
|
|
|
|
|
|
|
|
|
|
|
|
|
||
|
|
|
|
|
|
|
Scenarios assessed by IPCC |
|
|
NZE |
|
||||||||||||
|
|
|
|
|
|
|
|
|
|||||||||||||||
|
|
|
|
|
|
|
|
|
|||||||||||||||
|
|
|
|
|
|
|
|
|
|
|
|
|
|
|
|
|
|
|
IEA. All rights reserved. |
|
|||
The NZE has the lowest level of energy-related CDR and bioenergy of any scenario that achieves net-zero energy sector and industrial process CO2 emissions in 2050
Notes: CCUS = carbon capture, utilisation and storage; CDR = carbon direct removal; TES = total energy supply; TFC = total final consumption. Energy related CDR includes CO2 captured through bioenergy with CCUS and direct air capture with CCUS and put into permanent storage. Wind and solar share are given as a percentage of total electricity generation. Only 17 of the 18 scenarios assessed by the IPCC report hydrogen use in TFC.
UseofCCUS.The scenarios assessed by the IPCC have a median of around 15 Gt CO2 captured using CCUS in 2050, more than double the level in the NZE.
Use of CDR. CO2 emissions captured and stored from BECCS and DACCS in the IPCC scenarios range from 3.5 16 Gt CO2 in 2050, compared with 1.9 Gt CO2 in the NZE.
10 The low energy demand scenario has around 4.5 Gt CO2 energy sector and industrial process emissions in 2050 and is not included in this comparison.
Chapter 2 | A global pathway to net-zero CO emissions in 2050 |
63 |
IEA. All rights reserved.
Bioenergy. The IPCC scenarios use a median of 200 EJ of primary bioenergy in 2050 (compared with 63 EJ today) and a number use more than 300 EJ. The NZE uses 100 EJ of primary bioenergy in 2050.
Energy efficiency. Total final consumption in the IPCC scenarios range from 300 550 EJ in 2050 (compared with around 410 EJ in 2020). The NZE has final energy consumption of 340 EJ in 2050.
Hydrogen. The IPCC scenarios have a median of 18 EJ hydrogen in total final consumption in 2050, compared with 33 EJ in the NZE.11
Electricity generation. The shares of wind and solar in total electricity generation in 2050 in the IPCC scenarios range from around 15 80% with a median value of 50%. In the NZE, wind and solar provide 70% of total generation in 2050.
2.5Key pillars of decarbonisation
Achieving the rapid reduction in CO2 emissions over the next 30 years in the NZE requires a broad range of policy approaches and technologies (Figure 2.12). The key pillars of decarbonisation of the global energy system are energy efficiency, behavioural changes, electrification, renewables, hydrogen and hydrogen based fuels, bioenergy and CCUS.
Figure 2.12
45
Gt CO
30
15
2020
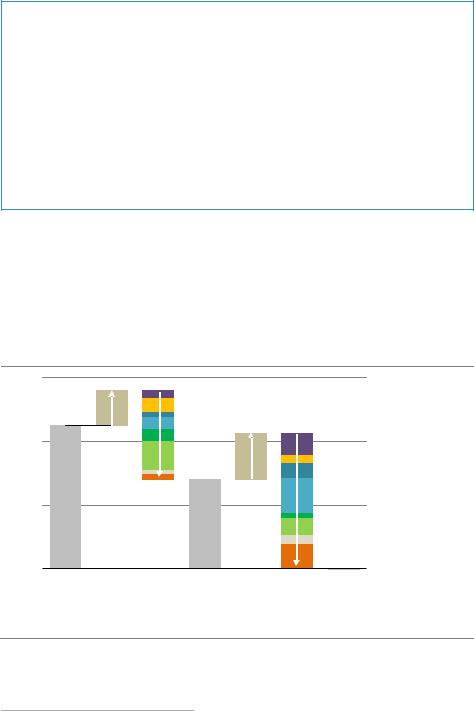
Emissions reductions by mitigation measure in the NZE, 2020-2050
+24% |
Measures |
+51% |
|
|
|
|
Activity |
||
|
|
|
|
||||||
|
|
|
|
||||||
|
|
|
|
|
|
avoided demand |
|||
|
|
|
|
|
|
|
Mitigationmeasures |
||
|
|
|
|
|
|
|
|
|
Behaviour and |
|
|
|
|
|
|
|
|
|
|
|
|
|
|
|
|
|
|
|
|
|
50% |
|
|
Measures |
|
|
Energy efficiency |
||
|
|
|
|
|
|||||
|
|
|
|
|
|||||
|
|
|
|
|
|||||
|
|
|
|
|
Hydrogen based |
||||
|
|
|
|
|
|
|
|
|
|
|
|
|
|
|
|
|
|
|
|
|
|
|
|
|
|
|
|
|
Electrification |
|
|
|
|
|
|
|
|
|
|
|
|
|
|
|
|
|
|||
|
|
|
|
|
|
|
|
|
|
|
|
|
|
|
|
|
|
|
Bioenergy |
|
|
|
|
|
|
|
|
|
|
|
|
|
|
|
|
|
|
|
|
|
|
|
|
|
|
|
|
|
Wind and solar |
|
|
|
|
|
|
|
|
|
|
|
|
|
|
|
|
|
|
|
|
|
|
|
|
|
|
|
|
|
Other fuel shifts |
|
|
|
|
|
|
|
|
|
|
|
|
|
|
|
|
|
|
|
|
|
|
|
|
|
100% |
|
|
CCUS |
|
|
|
|
|
|
|
|
|||
|
|
|
|
|
|
|
|||
|
|
|
|
|
|
|
|
||
|
|
|
|
|
|
|
|
|
|
|
|
|
2030 |
|
2050 |
|
|
|
|
|
|
|
|
|
|
|
|
|
IEA. All rights reserved. |
Solar, wind and energy efficiency deliver around half of emissions reductions to 2030 in the NZE, while electrification, CCUS and hydrogen ramp up thereafter
Notes: Activity = energy service demand changes from economic and population growth. Behaviour = energy service demand changes from user decisions, e.g. changing heating temperatures. Avoided demand = energy service demand changes from technology developments, e.g. digitalisation. Other fuel shifts = switching from coal and oil to natural gas, nuclear, hydropower, geothermal, concentrating solar power or marine.
11 The NZE value for hydrogen includes the total energy content of hydrogen and hydrogen based fuels consumed in final energy consumption.
64 |
International Energy Agency | Special Report |
2.5.1Energy efficiency
Minimising energy demand growth through improvements in energy efficiency makes a critical contribution in the NZE. Many efficiency measures in industry, buildings, appliances and transport can be put into effect and scaled up very quickly. As a result, energy efficiency measures are front loaded in the NZE, and they play their largest role in curbing energy
demand and emissions in the period to 2030. Although energy efficiency improves further 2 after 2030, its contribution to overall emissions reductions falls as other mitigation measures
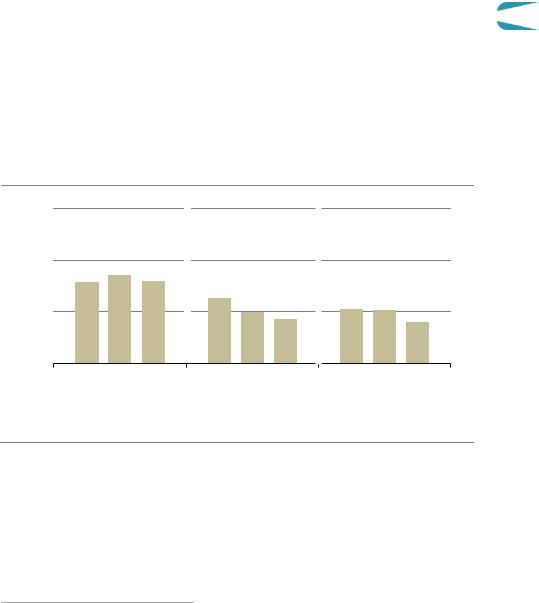
play an expanding role. Without the energy efficiency, behavioural changes and electrification measures deployed in the NZE, final energy consumption would be around 300 EJ higher in 2050, almost 90% above the 2050 level in the NZE (Figure 2.13). Efficiency improvements also help reduce the vulnerability of businesses and consumers to potential disruptions to electricity supplies.
Figure 2.13 Total final consumption and demand avoided by mitigation measure in the NZE
|
Industry |
Buildings |
Transport |
EJ |
300 |
|
|
200
100
2020 |
2030 |
2050 |
2020 |
2030 |
2050 |
2020 |
2030 |
2050 |
|
|
NZE demand Avoided dueto: |
Electricity |
Other fuel switch |
Efficiency |
Behaviour |
||||
|
|||||||||
|
|||||||||
IEA. All rights reserved.
Energy efficiency plays a key role in reducing energy consumption across end-use sectors
Notes: Other fuel switch includes switching to hydrogen related fuels, bioenergy, solar thermal, geothermal, or district heat.
In the buildings sector, many efficiency measures yield financial savings as well as reducing energy use and emissions. In the NZE, there are immediate and rapid improvements in energy efficiency in buildings, mainly from large scale retrofit programmes. Around 2.5% of existing residential buildings in advanced economies are retrofitted each year to 2050 in the NZE to comply with zero carbon ready building standards12 (compared with a current retrofit rate of less than 1%). In emerging market and developing economies, building replacement
12 A zero carbon ready building is highly energy efficient and uses either renewable energy directly or from an energy supply that will be fully decarbonised by 2050 in the NZE (such as electricity or district heat). A zero carbon ready building will become a zero carbon building by 2050, without further changes to the building or its equipment (see Chapter 3).
Chapter 2 | A global pathway to net-zero CO emissions in 2050 |
65 |
IEA. All rights reserved.

rates are higher and the annual rate of retrofits is around 2% through to 2050. By 2050, the vast majority of existing residential buildings are retrofitted to be zero carbon buildings. Energy related building codes are introduced in all regions by 2030 to ensure that virtually all new buildings constructed are zero carbon ready. Minimum energy performance standards and replacement schemes for low efficiency appliances are introduced or strengthened in the 2020s in all countries. By the mid 2030s, nearly all household appliances sold worldwide are as efficient as the most efficient models available today.
In the transport sector, stringent fuel economy standards and ensuring no new passenger cars running on internal combustion engines (ICEs) are sold globally from 2035 result in a rapid shift in vehicle sales toward much more efficient electric vehicles (EVs).13 The impact on efficiency is seen in the 2030s, as the composition of the vehicle stock changes: electric cars make up 20% of all cars on the road in 2030 and 60% in 2040 (compared with 1% today). Continuous improvements in the fuel economy of heavy road vehicles take place through to 2050 as they switch to electricity or fuel cells, while efficiency in shipping and aviation improves as more efficient planes and ships replace existing stock.
In the industry sector, most manufacturing stock is already quite efficient, but there are still opportunities for energy efficiency improvements. Energy management systems, best in class industrial equipment such as electric motors, variable speed drives, heaters and grinders are installed, and process integration options such as waste heat recovery are exploited to their maximum economic potentials in the period to 2030 in the NZE. After 2030, the rate of efficiency improvement slows because many of the technologies needed to reduce emissions in industry in the NZE require more energy than their equivalent conventional technologies. The use of CCUS, for example, increases energy consumption to operate the capture equipment, and producing electrolytic hydrogen on site requires additional energy than that needed for the main manufacturing process.
Table 2.3 Key global milestones for energy efficiency in the NZE
|
Sector |
|
2020 |
|
2030 |
|
2050 |
|
|
|
|
|
|
||||
|
Total energy supply |
|
2010 20 |
|
2020 30 |
|
2030 50 |
|
|
Annual energy intensity improvement (MJ per USD GDP) |
|
1.6% |
|
4.2% |
|
2.7% |
|
|
|
|
|
|
|
|
|
|
|
Industry |
|
|
|
|
|
|
|
|
Energy intensity of direct reduced iron from natural gas (GJ per tonne) |
12 |
11 |
10 |
|
|||
|
Process energy intensity of primary chemicals (GJ per tonne) |
17 |
16 |
15 |
|
|||
|
|
|
|
|
|
|
|
|
|
Transport |
|
|
|
|
|
|
|
|
Average fuel consumption of ICE heavy trucks fleet (index 2020=100) |
100 |
81 |
63 |
|
|||
|
|
|
|
|
|
|
|
|
|
Buildings |
|
|
|
|
|
|
|
|
Share of zero carbon ready buildings in total stock |
<1% |
25% |
>85% |
|
|||
|
New buildings: heating & cooling energy consumption (index 2020=100) |
100 |
50 |
20 |
|
|||
|
Appliances: unit energy consumption (index 2020=100) |
100 |
75 |
60 |
|
|||
Notes: ICE = internal combustion engine; zero carbon ready buildings = see description in section 3.7.
13 In 2020, the average battery electric car required around 30% of the energy of the average ICE car to provide the same level of activity.
66 |
International Energy Agency | Special Report |

2.5.2 Behavioural change
The wholescale transformation of the energy sector demonstrated in the NZE cannot be |
|
achieved without the active and willing participation of citizens. It is ultimately people who |
|
drive demand for energy related goods and services, and societal norms and personal |
|
choices will play a pivotal role in steering the energy system onto a sustainable path. Just |
2 |
under 40% of emissions reductions in the NZE result from the adoption of low carbon |
technologies that require massive policy support and investment but little direct engagement from citizens or consumers, e.g. technologies in electricity generation or steel production. A further 55% of emissions reductions require a mixture of the deployment of low carbon technologies and the active involvement or engagement of citizens and consumers, e.g. installing a solar water heater or buying an EV. A final 8% of emissions reductions stem from behavioural changes and materials efficiency gains that reduce energy demand, e.g. flying less for business purposes (Figure 2.14). Consumer attitudes can also impact investment decisions by businesses concerned about public image.
In the NZE, behavioural change refers to changes in ongoing or repeated behaviour on the part of consumers which impact energy service demand or the energy intensity of an energy related activity.14 Reductions in energy service demand in the NZE also come from advances in technology, but these are not counted as behavioural changes. For example, increased digitalisation and a growing market share of smart appliances, such as smart thermostats or space differentiated thermal controls reduce the necessity for people to play an active role in energy saving in homes over time in the NZE.
There are three main types of behavioural change included in the NZE. A wide range of government interventions could be used to motivate these changes (see section 2.7.1).
Reducing excessive or wasteful energy use. This includes reducing energy use in buildings and on roads, e.g. by reducing indoor temperature settings, adopting energy saving practices in homes and limiting driving speeds on motorways to 100 kilometres per hour.
Transportmodeswitching.This includes a shift to cycling, walking, ridesharing or taking buses for trips in cities that would otherwise be made by car, as well as replacing regional air travel by high speed rail in regions where this is feasible. Many of these types of behavioural changes would represent a break in familiar or habitual ways of life and as such would require a degree of public acceptance and even enthusiasm. Many would also require new infrastructure, such as cycle lanes and high speed rail networks, clear policy support and high quality urban planning.
Materialsefficiencygains.This includes reduced demand for materials, e.g. higher rates of recycling, and improved design and construction of buildings and vehicles. The scope for gains to some extent reflects societal preferences. For instance, in some places there
14 This means, for example, that purchasing an electric heat pump instead of a gas boiler is not considered as a behavioural change, as it is both an infrequent event and does not necessarily impact energy service demand.
Chapter 2 | A global pathway to net-zero CO emissions in 2050 |
67 |
IEA. All rights reserved.
has been a shift away from the use of single use plastics in recent years, a trend that accelerates in the NZE. Gains in materials efficiency depend on a mixture of technical innovation in manufacturing and buildings construction, standards and regulations to support best practice and ensure universal adoption of these innovations, and increased recycling in society at large.
Figure 2.14 Role of technology and behavioural change in emissions reductions in the NZE
Gt CO2
2020 |
2030 |
2040 |
2050 |
||
|
|
|
|
|
Behavioural changes |
|
|
|
|
|
|
5 |
|
|
|
and materials |
|
|
|
|
|
||
10 |
|
|
|
Low carbon |
|
15 |
|
|
|
technologieswiththe |
|
|
|
|
activeinvolvement |
||
20 |
of consumers |
|
|
||
25 |
|
|
30 |
Low carbon |
|
technologies |
||
|
||
35 |
|
|
|
IEA. All rights reserved. |
Around 8% of emissions reductions stem from behavioural changes and materials efficiency
Notes: Low carbon technologies include low carbon electricity generation, low carbon gases in end uses and biofuels. Low carbon technologies with the active involvement of citizens includes fuel switching, electrification and efficiency gains in end uses. Behavioural changes and materials efficiency includes transport mode switching, curbing excessive or wasteful energy use, and materials efficiency measures.
Three quarters of the emissions reductions from behavioural changes in the NZE are achieved through targeted government policies supported by infrastructure development, e.g. a shift to rail travel supported by high speed railways. The remainder come from adopting voluntary changes in energy saving habits, mainly in homes. Even in this case, public awareness campaigns can help shape day to day choices about how consumers use energy. (Details of what governments can do to help bring about behavioural changes are discussed in Chapter 4).
Behavioural changes reduce energy related activity by around 10 15% on average over the period to 2050 in the NZE, reducing overall global energy demand by over 37 EJ in 2050 (Figure 2.15). In 2030, around 1.7 Gt CO2 emissions are avoided, 45% of which come from transport, notably through measures to phase out car use in cities and to improve fuel economy. For example, reducing speed limits on motorways to 100 km/h reduces emissions from road transport by 3% or 140 Mt CO2 in 2030. A shift away from single occupancy car use towards ridesharing or cycling and walking in large cities saves a further 185 Mt CO2. Around
68 |
International Energy Agency | Special Report |
40% of emissions savings in 2030 occur in industry because of improvements in materials efficiency and increased recycling, with the biggest impacts coming from reducing waste and improving the design and construction of buildings. The remainder of emissions savings in 2030 are from behavioural changes in buildings, for example adjusting space heating and
cooling temperatures.
2
Figure 2.15 CO2 emissions and energy demand reductions from behavioural changes and materials efficiency in the NZE
Gt CO
0.6
1.2
1.8
2.4
3.0
Emissions
2030 2040 2050
EJ
|
Energydemand |
|
2030 |
2040 |
2050 |
|
|
|
|
Transport |
|
|
|
|
|
|
|
|
|
|
8 |
|
|
|
Buildings |
|
|
|
||
|
|
|
||
|
|
|
Industry |
|
|
|
|
||
16 |
|
|
|
|
|
|
|
|
|
24 |
|
|
|
|
32 |
|
|
|
|
40 |
|
|
|
|
|
IEA. All rights reserved. |
|||
By 2030, behaviour changes and materials efficiency gains reduce emissions by 1.7 Gt CO2, and energy demand by 27 EJ; reductions increase further through to 2050
In 2050, the growing importance of low emissions electricity and fuels in transport and buildings means that 90% of emissions reductions are in industry, predominantly in those sectors where it is most challenging to tackle emissions directly. Material efficiency alone reduces demand for cement and steel by 20%, saving around 1 700 Mt CO2. Of the emissions reductions in transport in 2050, nearly 80% come from measures to reduce passenger aviation demand, with the remainder from road transport.
The scope, scale and speed of adoption of the behavioural changes in the NZE varies widely between regions, depending on several factors including the ability of existing infrastructure to support such changes and differences in geography, climate, urbanisation, social norms and cultural values. For example, regions with high levels of private car use today see a more gradual shift than others towards public transport, shared car use, walking and cycling; air travel is assumed to switch to high speed rail on existing or potential routes only where trains could offer a similar journey time; and the potential for moderating air conditioning in buildings and vehicles takes into account seasonal effects and humidity. Wealthier regions generally have higher levels of per capita energy related activity, and behavioural changes play an especially important role in these regions in reducing excessive or wasteful energy consumption.
Chapter 2 | A global pathway to net-zero CO emissions in 2050 |
69 |
IEA. All rights reserved.