01 POWER ISLAND / 02 H2+NH3 / IEA 2022 NetZeroby2050-ARoadmapfortheGlobalEnergySector
.pdf4.5.2Infrastructure
Getting to net zero emissions will require huge amounts of new infrastructure and lots of modifications to existing assets. Energy infrastructure is transformed in the NZE as all countries and regions move from systems supporting the use of fossil fuels and the distribution of conventionally generated electricity to systems based largely on renewable electricity and low emissions fuels. In many emerging market and developing economies, the provision of large amounts of infrastructure would be necessary in the coming decades in any case, creating a window of opportunity to support the transition to a net zero emissions economy. In all countries, governments will play a central role in planning, financing and regulating the development of infrastructure. Some of the main infrastructure components
– electricity networks and EV charging, pipelines systems for low emissions fuels and CO2, and transport infrastructure – are discussed below.
The rapid increase in electricity demand in the NZE and the transition to renewable energy call for an expansion and modernisation of electricity networks (Figure 4.19). This would require a sharp reversal in the recent trend of declining investment: failure to achieve this would almost certainly make the energy transition for net zero emissions impossible. Tariff design and permitting procedures also need to be revised to reflect fundamental changes in the provision and uses of electricity. Some of the main considerations include:
Long distance transmission. Most of the growth in renewables in the NZE comes from centralised sources. Yet the best solar and wind resources are often in remote regions, requiring new transmission connections. Ultra high voltage direct current systems are likely to play an important role in supporting transmission over long distances.
Local distribution. Energy efficiency gains in households and wider use of rooftop solar PV mean surplus electricity will be available more often, while electric heat pumps and residential EV charging points will require electricity to be more widely available. Together these developments point to the need for substantial increases in distribution network capacity.
Grid substations. The massive expansion of solar PV and wind requires new grid substations: their capacity expands by more than 57 000 GW in the NZE by 2030, doubling current capacity globally.
EV charging. Major new public charging networks are built in the NZE, including in work places, highway service stations and residential complexes, to support EV expansion and long distance driving on highways.
Digitalisation of networks. With a large increase in the use of connected devices, the digitalisation of grid assets supports more flexible grid operations, better management of variable renewables and more efficient demand response.
180 |
International Energy Agency | Special Report |
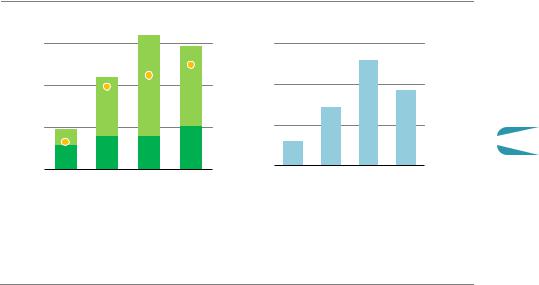
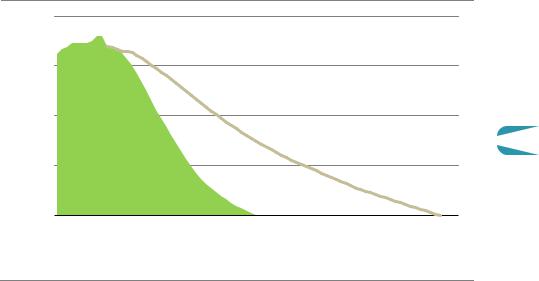
Figure 4.19 Annual average electricity grid expansion, replacement and substation capacity growth in the NZE
Gridexpansion and replacements |
Grid substationcapacitygrowth |
Million km |
6 |
60% |
4 |
40% |
|
|
2 |
20% |
|
2016 |
2021 |
2031 |
2041 |
||
20 |
30 |
|
|
40 |
50 |
|
|
Refurbishments |
|
|
Renewables and demand increase |
||
|
|
|||||
|
|
|||||
12 |
GW |
|
|
8 |
Thousand |
|
|
4 |
|
4
2016 |
2021 |
2031 |
2041 |
20 |
30 |
40 |
50 |
 Share of digitalisation (right axis)
IEA. All rights reserved.
Grid and substation expansion is driven largely by the massive deployment of renewables and electrification of end-uses, with a rising digital share of infrastructure
Note: Substation capacity here assumes active electricity is equal to apparent electricity.
Pipelines continue to play a key role in the transmission and distribution of energy in the NZE:
Given the rapid decline of fossil fuels, significant investment in new oil and gas pipelines are not needed in the NZE. However investment is needed to link the production of low emissions liquids and gases with consumption centres, and to convert existing pipelines and associated distribution infrastructure for the use of these low emissions fuels. Some low emissions fuels, such as biomethane and synthetic hydrogen based fuels, can make use of existing infrastructure without any modifications, but pure hydrogen requires a retrofit of existing pipelines. New dedicated hydrogen infrastructure is also needed in the NZE, for example to move hydrogen produced in remote areas with excellent renewable resources to demand centres.
The expansion of CCUS in the NZE requires investment in CO2 transport and storage capacity. By 2050, 7.6 Gt of CO2 is captured worldwide, requiring a large amount of pipeline and shipping infrastructure linking the facilities where CO2 is captured with storage sites. Industrial clusters, including ports, may offer the best near term opportunities to build CO2 pipeline and hydrogen infrastructure, as the various industries in those clusters using the new infrastructure would be able to share the upfront investment needs (Figure 4.20).
Chapter 4 | Wider implications of achieving net-zero emissions
181
IEA. All rights reserved.
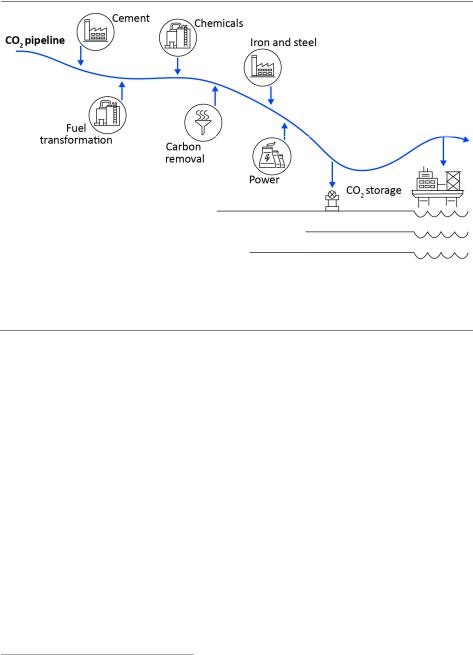
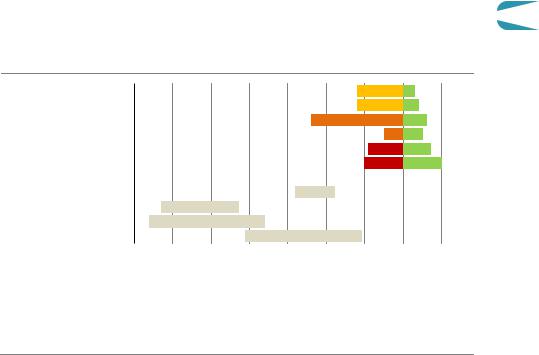
Figure 4.20 Illustrative example of a shared CO2 pipeline in an industrial cluster
IEA. All rights reserved.
Deployment of technologies like CCUS and hydrogen and their enabling infrastructure would benefit strongly from a cross-sectoral approach in industrial clusters
Transforming transport infrastructure represents both a challenge and an opportunity. The challenge arises from the potential increase in the energy and carbon intensity of economic growth during the infrastructure development phase.11 Steel and cement are the two main components of virtually all infrastructure projects, but they are also among the most challenging sectors to decarbonise. The opportunity comes from the scope that exists in some countries to develop infrastructure from scratch in a way that is compatible with the net zero goal. Countries undergoing rapid urbanisation today can design and steer new infrastructure development towards higher urban density and high capacity mass transit in tandem with EV charging and low emissions fuelling systems.
Rail has an important part to play as transport infrastructure is developed. The NZE sees large scale investment in all regions in high speed trains to replace both long distance car driving and short haul aviation. It also sees large scale investment in all regions in track, control systems, rolling stock modernisation and combined freight facilities to improve speed and flexibility for just in time logistical operations and thus support a shift of freight from road to rail, especially for container traffic.
11 The modelling for the NZE incorporates the increase in steel and cement that is required to build additional transport infrastructure (roads, cars and trucks) and energy infrastructure, e.g. power plants and wind turbines.
182 |
International Energy Agency | Special Report |
4.5.3Tax revenues from retail energy sales
The slump in the consumption of fossil fuels required to get to net zero emissions would result in the loss of a large amount of tax revenue in many countries, given that fuels such as oil based transport fuels and natural gas are often subject to high excise or other special taxes. In recent years, energy related taxes accounted for around 4% of total government tax revenues in advanced economies on average and 3.5% in emerging market and developing economies, but they provided as much as 10% in some countries (OECD, 2020).
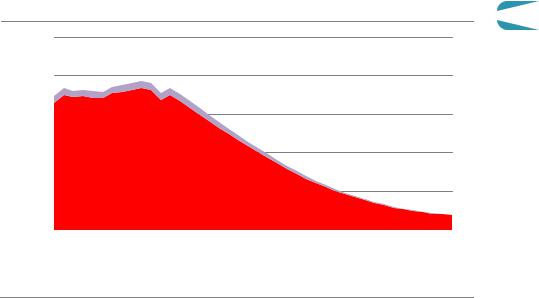
Figure 4.21
(2019) |
1 000 |
|
|
Billion USD |
800 |
600 |
Global revenues from taxes on retail sales of oil and gas in the
NZE |
4 |
|
Natural gas excise tax
400 |
|
Oilexcise tax |
|
|
|
|
200 |
|
|
|
|
|
|
|
|
|
|
|
|
|
2010 |
2020 |
2030 |
2040 |
2050 |
||
IEA. All rights reserved.
Tax revenues slump from retail sales of oil and gas
Tax revenue from oil and natural gas retail sales falls by close to 90% between 2020 and 2050 in the NZE (Figure 4.21). Governments are likely to need to rely on some combination of other tax revenues and public spending reforms to compensate. Some taxation measures focused on the energy sector could be useful. However, any such taxes would need to be carefully designed to minimise their impact on low income households, as poorer households spend a higher percentage of their disposable income on electricity and heating. Options for energy related taxes include:
CO2 prices. These are introduced in all regions in the NZE, albeit at different levels for countries and sectors, which provide additional revenue streams. The reduction in oil and natural gas excise taxes is more than compensated over the next 15 years by higher revenues from CO2 prices related to these fuels paid by end users and other sectors, but these too fall as the global energy system moves towards net zero emissions.
Roadfeesandcongestioncharges.These would have the added benefit of discouraging driving and encouraging switching to other less carbon intensive modes of transport.
Chapter 4 | Wider implications of achieving net-zero emissions |
183 |
IEA. All rights reserved.
Increasing taxation on electricity. Higher taxes on all electricity sales could generate substantial revenues, especially since large increases in price often have little effect on consumption. This might be counterproductive, however, as it would reduce the cost effectiveness of both EVs and heat pumps, which could slow their adoption, although this risk could be mitigated by the introduction of CO2 prices.
Natural gas is currently less taxed than transport fuels in most countries. Introducing and raising CO2 prices for natural gas used in buildings, mostly for heating, would accelerate energy efficiency improvements and boost government revenues, although care would be needed to avoid disproportionately impacting low income households. Taxing natural gas used in industry would improve the competitiveness of less carbon intensive fuels and technologies such as hydrogen, but would run the risk of undermining the international competitiveness of energy intensive sectors and carbon leakage in the absence of co ordinated global action or border carbon tax adjustments.
4.5.4Innovation
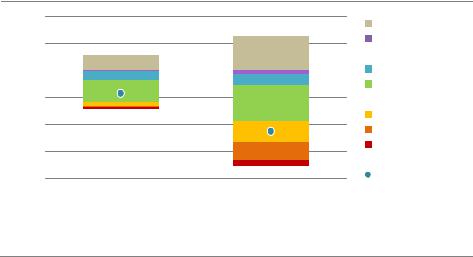
Without a major acceleration in clean energy innovation, reaching net zero emissions by 2050 will not be achievable. Technologies that are available on the market today provide nearly all of the emissions reductions required to 2030 in the NZE to put the world on track for net zero emissions by 2050. However, reaching net zero emissions will require the widespread use after 2030 of technologies that are still under development today. In 2050, almost 50% of CO2 emissions reductions in the NZE come from technologies currently at demonstration or prototype stage (Figure 4.22). This share is even higher in sectors such as heavy industry and long distance transport. Major innovation efforts are vital in this decade so that the technologies necessary for net zero emissions reach markets as soon as possible.
Figure 4.22 Global CO2 emissions changes by technology maturity category in the NZE
of demonstration projects before 2030: this is much more than the roughly USD 25 billion budgeted by governments to 2030. Most of these projects are concerned with the electrification of end uses, CCUS, hydrogen and sustainable bioenergy, mainly for long distance transport and heavy industrial applications.
Increased public funding helps to manage the risks of such first of a kind projects and to leverage private investment in research and development (R&D) in the NZE. This represents a reversal of recent trends: government spending on energy R&D worldwide, including demonstration projects, has fallen as a share of GDP from a peak of almost 0.1% in 1980 to just 0.03% in 2019. Public funding also becomes better aligned with the innovations needed to reach net zero emissions. In the NZE, electrification, CCUS, hydrogen and sustainable bioenergy account for nearly half of the cumulative emissions reductions to 2050. Just three technologies are critical in enabling around 15% of the cumulative emissions reductions in the NZE between 2030 and 2050: advanced high energy density batteries, hydrogen electrolysers and DAC.
Governments drive innovation in the NZE
Bringing new energy technologies to market can often take several decades, but the imperative of reaching net zero emissions globally by 2050 means that progress has to be much faster. Experience has shown that the role of government is crucial in shortening the time needed to bring new technology to market and to diffuse it widely (IEA, 2020i). The government role includes educating people, funding R&D, providing networks for knowledge exchange, protecting intellectual property, using public procurement to boost deployment, helping companies innovate, investing in enabling infrastructure and setting regulatory frameworks for markets and finance.
Knowledge transfer from first mover countries can also help in the acceleration needed, and is particularly important in the early phases of adoption when new technologies are typically not competitive with incumbent technologies. For example, in the case of solar PV, national laboratories played a key role in the early development phase in the United States, projects supported directly by government in Japan created market niches for initial deployment and government procurement and incentive policies in Germany, Italy, Spain, United States, China, Australia and India fostered a global market. Lithium ion (Li ion) batteries were initially developed through public and private research that took place mostly in Japan, their first energy related commercial operation was made possible in the United States, and mass manufacturing today is primarily in China.
Many of the biggest clean energy technology challenges could benefit from a more targeted approach to speed up progress (Diaz Anadon, 2012; Mazzucato, 2018). In the NZE, concerted government action leverages private sector investment and leads to advances in clean energy technologies that are currently at different stages of development.
To 2030, the focus of government action is on bringing new zero or low emissions technologies to market. For example, in the NZE, steel starts to be produced using low emissions hydrogen at the scale of a conventional steel plant, large ships start to be
186 |
International Energy Agency | Special Report |


standards. The development of such standards could accelerate energy technology development and deployment.
Innovation, demonstration and diffusion. Clean energy R&D and patenting is currently concentrated in a handful of places: United States, Europe, Japan, Korea and China accounted for more than 90% of clean energy patents in 2014 18. Progress towards net zero emissions would be increased by moving swiftly to extend experience and knowledge of clean energy technologies in countries that are not involved in their initial development, and by funding first of a kind demonstration projects in emerging market and developing economies. International programmes to fund demonstration projects, especially in sectors where technologies are large and complex, would accelerate the innovation process (IEA, 2020i).
Carbon dioxide removal (CDR) programmes. CDR technologies such as bioenergy and DAC equipped with CCUS are essential to provide emissions reductions at a global level. International co operation is needed to fund and certify these programmes, so as to make the most of suitable land, renewable energy potential and storage resources, wherever they may be. International emissions trading mechanisms could play a role in offsetting emissions in some sectors or areas with negative emissions, though any such mechanisms would require a high degree of co ordination to ensure market functioning and integrity.
The NZE assumes that international co operation policies, measures and efforts are introduced to overcome these hurdles. To explore the potential implications of a failure to do so, we have devised a Low InternationalCo operationCase (Box 4.2). This examines what would happen if national efforts to mitigate climate change ramp up in line with the level of effort in the NZE but co operation frameworks are not developed at the same speed. It shows that the lack of international co operation has a major impact on innovation, technology demonstration, market co ordination and ultimately on the emissions pathway.
Box 4.2 Framing the Low International Co-operation Case
To develop the LowInternationalCo operationCase, technologies and mitigation options were assessed and grouped based on their current degree of maturity and the importance of international co operation to their deployment. Mature technologies in markets that are firmly established and that have a low exposure to international co operation are assumed to have the same deployment pathways as in the NZE. Technologies and mitigation options where co operation is needed to achieve scale and avoid duplication, that have a large exposure to international trade and competitiveness, that depend on large and very capital intensive demonstration programmes, or that require support to create market pull and standardisation to ensure inter operability, are assumed to be deployed more slowly (Malhotra and Schmidt, 2020). Compared with the NZE, these technologies are delayed by 5 10 years in their initial deployment in advanced economies and by 10 15 years in emerging market and developing economies.
188 |
International Energy Agency | Special Report |