

01 POWER ISLAND / 02 H2+NH3 / IEA 2022 NetZeroby2050-ARoadmapfortheGlobalEnergySector
.pdf1.1Introduction
November 2021 will see the most important UN Framework Convention on Climate Change (UNFCCC) Conference of the Parties (COP 26) since the Paris Agreement was signed in 2015. As COP 26 approaches, an increasing number of countries have announced long term goals to achieve net zero greenhouse gas (GHG) emissions over the coming decades. On 31 March 2021, the International Energy Agency (IEA) hosted a Net Zero Summit to take stock of the growing list of commitments from countries and companies to reach the goals of the Paris Agreement, and to focus on the actions necessary to start turning those net zero goals into reality.
Achieving those goals will be demanding. The Covid 19 pandemic delivered a major shock to the world economy, resulting in an unprecedented 5.8% decline in CO2 emissions in 2020. However, our monthly data show that global energy related CO2 emissions started to climb again in December 2020, and we estimate that they will rebound to around 33 gigatonnes of carbon dioxide (Gt CO2) in 2021, only 1.2% below the level in 2019 (IEA, 2021). Sustainable economic recovery packages offered a unique opportunity to make 2019 the definitive peak in global emissions, but the evidence so far points to a rebound in emissions in parallel with renewed economic growth, at least in the near term (IEA, 2020a).
Recent IEA analyses examined the technologies and policies needed for countries and regions to achieve net zero emissions energy systems. The World Energy Outlook 2020 examined what would be needed over the period to 2030 to put the world on a path towards net zero emissions by 2050 in the context of the pandemic related economic recovery (IEA, 2020b). The Faster Innovation Case in Energy Technology Perspectives 2020 explored whether net zero emissions could be achieved globally by 2050 through accelerated energy technology development and deployment alone: it showed that, relative to baseline trends, almost half of the emissions savings needed in 2050 to reach net zero emissions rely on technologies that are not yet commercially available (IEA, 2020c).
This special report, prepared at the request of the UK President of the COP 26, incorporates the insights and lessons learned from both reports to create a comprehensive and detailed pathway, or roadmap, to achieve net zero energy related and industrial process CO2 emissions globally by 2050. It assesses the costs of achieving this goal, the likely impacts on employment and the economy, and the wider implications for the world. It also highlights the key milestones for technologies, infrastructure, investment and policy that are needed along the road to 2050.
This report is set out in four chapters:
Chapter 1 explores the outlook for global CO2 emissions and energy supply and use based on existing policies and pledges. It sets out projections of global energy use and emissions based on the Stated Policies Scenario (STEPS), which includes only the firm policies that are in place or have been announced by countries, including Nationally
30 |
International Energy Agency | Special Report |

Determined Contributions. It also examines the Announced Pledges Case (APC), a |
|
|
variant of the STEPS that assumes that all of the net zero targets announced by countries |
|
|
around the world to date are met in full. |
1 |
|
Chapter 2 presents the Net Zero Emissions by 2050 Scenario (NZE), which describes |
||
|
||
how energy demand and the energy mix will need to evolve if the world is to achieve |
|
|
net zero emissions by 2050. It also assesses the corresponding investment needs and |
|
|
explores key uncertainties surrounding technology and consumer behaviour. |
|
|
Chapter 3 examines the implications of the NZE for various sectors, covering fossil fuel |
|
|
supply, the supply of low emissions fuels (such as hydrogen, ammonia, biofuels, |
|
|
synthetic fuels and biomethane) and the electricity, transport, industry and buildings |
|
|
sectors. It highlights the key changes required to achieve net zero emissions in the NZE |
|
|
and the major milestones that are needed along the way. |
|
|
Chapter 4 explores the implications of the NZE for the economy, the energy industry, |
|
|
citizens and governments. |
|
1.2Emissions reduction targets and net zero pledges
1.2.1Nationally Determined Contributions
Under the Paris Agreement, Parties 1 are required to submit Nationally Determined Contributions (NDCs) to the UNFCCC and to implement policies with the aim of achieving their stated objectives. The process is dynamic; it requires Parties to update their NDCs every five years in a progressive manner to reflect the highest possible ambition. The first round of NDCs, submitted by 191 countries, covers more than 90% of global energy related and industrial process CO2 emissions. 2 The first NDCs included some targets that were unconditional and others that were conditional on international support for finance, technology and other means of implementation.
As of 23 April 2021, 80 countries have submitted new or updated NDCs to the UNFCCC, covering just over 40% of global CO2 emissions (Figure 1.1).3 Many of the updated NDCs include more stringent targets than in the initial round of NDCs, or targets for a larger number of sectors or for a broader coverage of GHGs. In addition, 27 countries and the European Union have communicated long term low GHG emissions development strategies to the UNFCCC, as requested by the Paris Agreement. Some of these strategies incorporate a net zero pledge.
1 Parties refers to the 197 members of the UNFCCC which includes all United Nations member states, United Nations General Assembly Observer State of Palestine, UN non member states Niue and the Cook Islands and the European Union.
2 Unless otherwise stated, CO2 emissions in this report refer to energy related and industrial process CO2 emissions.
3 Several countries have indicated that they intend to submit new or updated NDCs later in 2021 or in 2022.
Chapter 1 | Announced net zero pledges and the energy sector |
31 |
IEA. All rights reserved.

Figure 1.1
countries |
200 |
150 |
|
of |
|
Number |
100 |
|
|
|
50 |
Number of countries with NDCs, long-term strategies and net zero pledges, and their shares of 2020 global CO2 emissions
100%
75%
50%
25%
First |
New or updated NZE pledges |
Long term |
NZE targets in |
NDC |
NDC |
strategy |
law |
 Share of global 2020 CO emissions (right axis)
IEA. All rights reserved.
Around 40% of countries that have ratified the Paris Agreement have updated their NDCs, but net zero pledges cover around 70% of global CO2 emissions
1.2.2Net zero emissions pledges
There has been a rapid increase in the number of governments making pledges to reduce GHG emissions to net zero (Figure 1.2). In the Paris Agreement, countries agreed to “achieve a balance between anthropogenic emissions by sources and removals by sinks of greenhouse gases in the second half of the century”. The Intergovernmental Panel on Climate Change (IPCC) Special Report on Global Warming of 1.5 °C highlighted the importance of reaching net zero CO2 emissions globally by mid century or sooner to avoid the worst impacts of climate change (IPCC, 2018).
Net zero emissions pledges have been announced by national governments, subnational jurisdictions, coalitions4 and a large number of corporate entities (see Spotlight). As of 23 April 2021, 44 countries and the European Union have pledged to meet a net zero emissions target: in total they account for around 70% of global CO2 emissions and GDP (Figure 1.3). Of these, ten countries have made meeting their net zero target a legal obligation, eight are proposing to make it a legal obligation, and the remainder have made their pledges in official policy documents.
4 Examples include: the UN led Climate Ambition Alliance in which signatories signal they are working towards achieving net zero emissions by 2050; and the Carbon Neutrality Coalition launched at the UN Climate Summit in 2017, in which signatories commit to develop long term low GHG emissions strategies in line with limiting temperature rises to 1.5 °C.
32 |
International Energy Agency | Special Report |

Figure 1.2 Number of national net zero pledges and share of global CO2 emissions covered
withCountriespledges |
50 |
100% |
emissionsCOofShare |
|
40 |
80% |
|||
|
|
|||
|
30 |
60% |
|
|
|
20 |
40% |
|
|
|
10 |
20% |
|
2015 |
2016 |
2017 |
2018 |
2019 |
2020 |
2021 |
|||
|
|
|
|
|
|
|
|
|
Q1 |
|
In law |
|
Proposed |
|
|
In policy documents |
Global CO covered (right axis) |
||
|
|
|
|
||||||
|
|
|
|
||||||
IEA. All rights reserved.
There has been a significant acceleration in net-zero emissions pledges announced by governments, with an increasing number enshrined in law
Notes: In law = a net zero pledge has been approved by parliament and is legally binding. Proposed = a net zero pledge has been proposed to parliament to be voted into law. In policy document = a net zero pledge has been proposed but does not have legally binding status.
1
Figure 1.3 Coverage of announced national net zero pledges
Countries |
|
|
|
|
|
Population |
|
|
|
|
|
CO emissions |
|
|
|
|
|
GDP |
|
|
|
|
|
|
20% |
40% |
60% |
80% |
100% |
Advanced economies |
Emerging market and developing economies |
|
Not covered |
||
IEA. All rights reserved.
Countries accounting for around 70% of global CO2 emissions and GDP have set net zero pledges in law, or proposed legislation or in an official policy document
Note: GDP = gross domestic product at purchasing power parity.
Chapter 1 | Announced net zero pledges and the energy sector |
33 |
IEA. All rights reserved.

In contrast to some of the shorter term commitments contained within NDCs, few net zero pledges are supported by detailed policies and firm routes to implementation. Net zero emissions pledges also vary considerably in their timescale and scope. Some key differences include:
GHG coverage. Most pledges cover all GHG emissions, but some include exemptions or different rules for certain types of emissions. For example, New Zealand’s net zero pledge covers all GHGs except biogenic methane, which has a separate reduction target.
Sectoralboundaries. Some pledges exclude emissions from specific sectors or activities. For example, the Netherlands aims to achieve net zero GHG emissions only in its electricity sector (as part of an overall aim to reduce total GHG emissions by 95%), and some countries, including France, Portugal and Sweden, exclude international aviation and shipping.
Use of carbon dioxide removal (CDR). Pledges take varying approaches to account for CDR within a country’s sovereign territory. CDR options include natural CO2 sinks, such as forests and soils, as well as technological solutions, such as direct air capture or bioenergy with carbon capture and storage. For example, Uruguay has stated that natural CO2 sinks will be used to help it reach net zero emissions, while Switzerland plans to use CDR technologies to balance a part of its residual emissions in 2050.
Use of international mitigation transfers. Some pledges allow GHG mitigation that occurs outside a country’s borders to be counted towards the net zero target, such as through the transfer of carbon credits, while others do not. For example, Norway allows the potential use of international transfers, while France explicitly rules them out. Some countries, such as Sweden, allow such transfers but specify an upper limit to their use.
Timeframe. The majority of pledges, covering 35% of global CO2 emissions in 2020, target net zero emissions by 2050, but Finland aims to reach that goal by 2035, Austria and Iceland by 2040 and Sweden by 2045. Among others, the People’s Republic of China (hereafter China) and Ukraine have set a target date after 2050.
S P O T L I G H T
How are businesses responding to the need to reach net-zero emissions?
There has been a rapid rise in net zero emissions announcements from companies in recent years: as of February 2021, around 110 companies that consume large amounts of energy directly or produce energy consuming goods have announced net zero emissions goals or targets.
Around 60 70% of global production of heating and cooling equipment, road vehicles, electricity and cement is from companies that have announced net zero emissions targets (Figure 1.4). Nearly 60% of gross revenue in the technology sector is also generated by companies with net zero emission targets. In other sectors, net zero
34 |
International Energy Agency | Special Report |
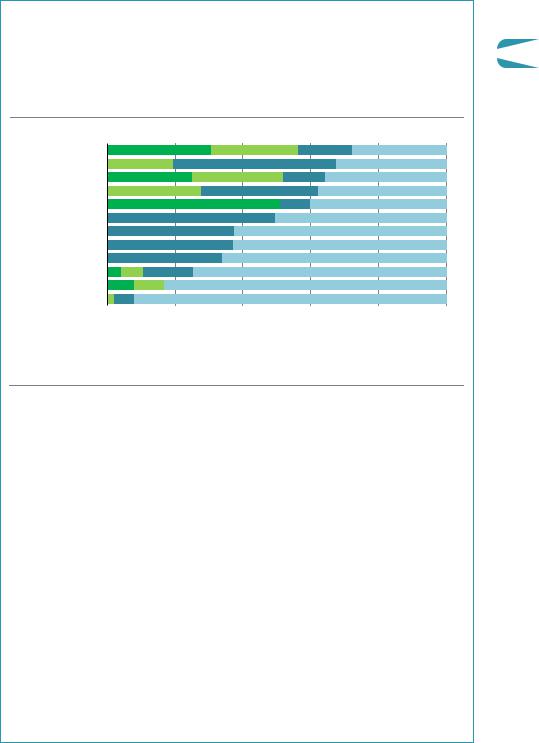
pledges cover 30 40% of air and shipping operations, 15% of transport logistics and 10% of construction. All these shares are likely to keep growing as more companies make pledges.
Figure 1.4 Sectoral activity of large energy-related companies with announced pledges to reach net-zero emissions by 2050
20% |
40% |
60% |
80% |
100% |
Heating and cooling
Cement
Road vehicles
Power
Technology
Steel
Passenger airlines
Aircraft
Shipping operations
Oil and gas
Transport logistics
Construction
|
Scope 1+2+3 |
|
Partial value chain |
|
Scope 1+2 |
|
|
No target |
|
|
|
|
|||||
|
|
|
|
|||||
|
|
|
|
|
|
IEA. All rights reserved. |
||
Some sectors are more advanced in terms of the extent of net zero targets by companies active in the sector
Notes: Scope 1 = direct emissions from energy and other sources owned or controlled. Scope 2 = indirect emissions from the production of electricity and heat, and fuels purchased and used. Scope 3 = indirect emissions from sources not owned or directly controlled but related to their activities (such as employee travel, extraction, transport and production of purchased materials and fuels, and end use of fuels, products and services). Partial value chain includes Scope 1 and 2 emissions and Scope 3 emissions in specific geographic locations or sections of a company’s value chain.
Source: IEA analysis based on company reports from the largest 10 25 companies within each sector.
Company pledges may not be readily comparable. Most companies account for emissions and set net zero pledges based on the GHG Protocol (WRI, WBCSD, 2004), but the coverage and timeframe of these pledges varies widely. Some cover only their own emissions, for example by shifting to the use of zero emissions electricity in offices and production facilities, and by eliminating the use of oil in transport or industrial operations, e.g. FedEx, ArcelorMittal and Maersk. Others also cover wider emissions from certain parts of their values chains, e.g. Renault in Europe, or all indirect emissions related to their activities, e.g. Daikin, Toyota, Shell, Eni and Heidelberg. Around 60% of pledges aim to achieve net zero emissions by 2050, but several companies have set an earlier deadline of 2030 or 2040.
Around 40% of companies that have announced net zero pledges have yet to set out how they aim to achieve them. For those with detailed plans, the main options include direct emissions reductions, use of CO2 removal technologies, such as afforestation, bioenergy
Chapter 1 | Announced net zero pledges and the energy sector |
35 |
1
IEA. All rights reserved.

with carbon capture, utilisation and storage (CCUS), or direct air capture with CO2 storage, and purchasing emissions (credits generated through emissions reductions that occur elsewhere). The use of offsets could be a cost effective mechanism to eliminate emissions from parts of value chains where emissions reductions are most challenging, provided that schemes to generate emissions credits result in permanent, additional and verified emissions reductions. However, there is likely to be a limited supply of emissions credits consistent with net zero emissions globally and the use of such credits could divert investment from options that enable direct emissions reductions.
1.3Outlook for emissions and energy in the STEPS
The IEA Stated Policies Scenario (STEPS) illustrates the consequences of existing and stated policies for the energy sector. It draws on the latest information regarding national energy and climate plans and the policies that underpin them. It takes account of all policies that are backed by robust implementing legislation or regulatory measures, including the NDCs that countries have put forward under the Paris Agreement up to September 2020 and the energy components of announced economic stimulus and recovery packages. So far, few net zero emissions pledges have been backed up by detailed policies, implementation plans or interim targets: most net zero pledges therefore are not included in the STEPS.
1.3.1CO2 emissions
Global CO2 emissions in the STEPS bring about only a marginal overall improvement in recent trends. Switching to renewables leads to an early peak in emissions in the electricity sector, but reductions across all sectors fall far short of what is required for net zero emissions in 2050. Annual CO2 emissions rebound quickly from the dip caused by the Covid 19 pandemic in 2020: they increase from 34 Gt in 2020 to 36 Gt in 2030 and then remain around this level until 2050 (Figure 1.5). If emissions trends were to continue along the same trajectory after 2050, and with commensurate changes in other sources of GHG emissions, the global average surface temperature rise would be around 2.7 °C in 2100 (with a 50% probability).
There is strong divergence between the outlook for emissions in advanced economies on one hand and the emerging market and developing economies on the other. In advanced economies, despite a small rebound in the early 2020s, CO2 emissions decline by about a third between 2020 and 2050, thanks to the impact of policies and technological progress in reducing energy demand and switching to cleaner fuels. In emerging market and developing economies, energy demand continues to grow strongly because of increased population, brisk economic growth, urbanisation and the expansion of infrastructure: these effects outweigh improvements in energy efficiency and the deployment of clean technologies, causing CO2 emissions to grow by almost 20% by the mid 2040s, before declining marginally to 2050.
36 |
International Energy Agency | Special Report |
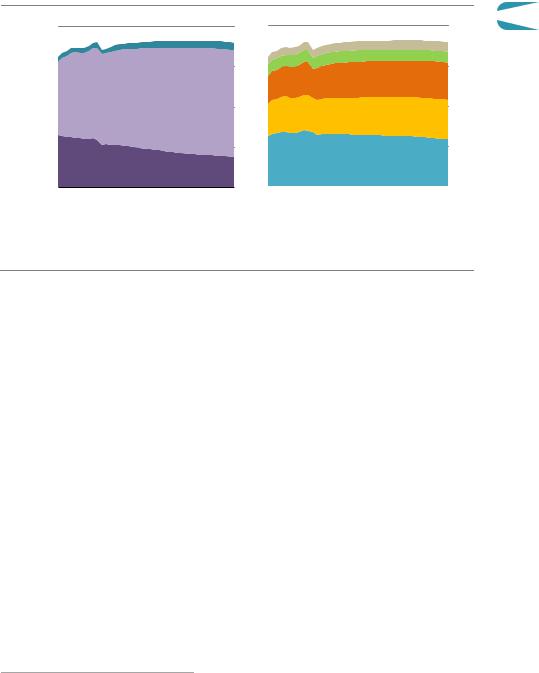
Figure 1.5
Gt CO |
40 |
|
30
20
10
2010
Energy-related and industrial process CO2 emissions by region and sector in the STEPS
Region |
|
|
|
Sector |
1 |
|
Internationalbunkers |
|
|
|
Other |
||
|
|
|
|
|
Buildings |
|
Emergingmarket and |
|
|
|
Transport |
||
|
|
|
|
|
||
developingeconomies |
|
|
|
Industry |
||
|
|
|
|
|
||
Advancedeconomies |
|
|
|
Electricity |
||
|
|
|
|
|
||
|
|
|
|
|
|
|
2030 |
2050 |
2010 |
2030 |
2050 |
||
|
|
|
|
|
IEA. All rights reserved. |
|
Global CO2 emissions rebound quickly after 2020 and then plateau, with declines in advanced economies offset by increases elsewhere
Note: Other = agriculture and own use in the energy sector.
1.3.2Total energy supply, total final consumption and electricity generation
The projected trends in CO2 emissions in the STEPS result from changes in the amount of energy used and the mix of fuels and technologies. Total energy supply (TES)5 worldwide rises by just over 30% between 2020 and 2050 in the STEPS (Figure 1.6). Without a projected annual average reduction of 2.2% in energy intensity, i.e. energy use per unit of GDP, TES in 2050 would be around 85% higher. In advanced economies, energy use falls by around 5% to 2050, despite a 75% increase in economic activity over the period. In emerging market and developing economies, energy use increases by 50% to 2050, reflecting a tripling of economic output between 2020 and 2050. Despite the increase in GDP and energy use in emerging market and developing economies, 750 million people still have no access to electricity in 2050, more than 95% of them in sub Saharan Africa, and 1.5 billion people continue to rely on the traditional use of bioenergy for cooking.
The global fuel mix changes significantly between 2020 and 2050. Coal use, which peaked in 2014, falls by around 15%. Having fallen sharply in 2020 due to the pandemic, oil demand rebounds quickly, returning to the 2019 level of 98 million barrels per day (mb/d) by 2023 and reaching a plateau of around 104 mb/d shortly after 2030. Natural gas demand increases from 3 900 billion cubic metres (bcm) in 2020 to 4 600 bcm in 2030 and 5 700 bcm in 2050. Nuclear energy grows by 15% between 2020 and 2030, mainly reflecting expansions in China.
5 Total primary energy supply (or total primary energy demand) has been renamed total energy supply in accordance with the International Recommendations for Energy Statistics (IEA, 2020d).
Chapter 1 | Announced net zero pledges and the energy sector |
37 |
IEA. All rights reserved.
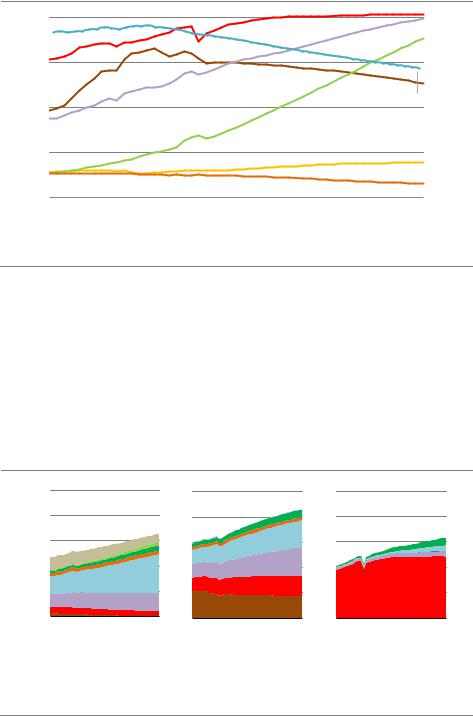
Figure 1.6 Total energy supply and CO2 emissions intensity in the STEPS
EJ |
200 |
|
150 Oil
Coal
100
Naturalgas
50
2000 2010
|
|
|
|
60 |
gCO/MJ |
|
|
|
|
45 |
|
|
|
|
|
|
|
|
|
CO intensityof TES |
30 |
|
|
|
Renewables |
|
(right axis) |
|
|
|
|
|
|
|
|
Nuclear |
|
|
|
15 |
|
|
|
|
|
|
|
Traditionaluse of biomass |
|
|
|
||
2020 |
2030 |
2040 |
2050 |
|
|
IEA. All rights reserved.
Coal use declines, oil plateaus and renewables and natural gas grow substantially to 2050
Note: EJ = exajoule; MJ = megajoule; TES = total energy supply.
Total final consumption increases in all sectors in the STEPS, led by electricity and natural gas (Figure 1.7). All the growth is in emerging market and developing economies. The biggest change in energy use is in the electricity sector (Figure 1.8). Global electricity demand increases by 80% between 2020 and 2050, around double the overall rate of growth in final energy consumption. More than 85% of the growth in global electricity demand comes from emerging market and developing economies. Coal continues to play an important role in electricity generation in those economies to 2050, despite strong growth in renewables: in advanced economies, the use of coal for electricity generation drops sharply.
Figure 1.7 Total final consumption by sector and fuel in the STEPS
EJ
250 |
Buildings |
Industry |
Transport |
|
|
|
200
150
100
50
2010 |
2050 |
2010 |
|
2050 |
2010 |
2050 |
||||||
|
Coal |
|
Oil |
|
|
|
Natural gas |
|
Hydrogen |
|
Electricity |
|
|
|
|
|
|
|
|
||||||
|
Heat |
|
Modern Bioenergy |
|
|
Other renewables |
|
Traditional use of biomass |
||||
|
|
|
|
|||||||||
|
|
|
|
|||||||||
IEA. All rights reserved.
Final energy consumption grows on average by 1% per year between 2020 and 2050, with electricity and natural gas meeting most of the increase
38 |
International Energy Agency | Special Report |

Figure 1.8 Electricity generation by fuel and share of coal in the STEPS
|
Advanced economies |
Emergingmarket and developingeconomies |
TWh |
30 |
60% |
|
|
|
Thousand |
20 |
40% |
|
||
|
10 |
20% |
|
|
2010 |
2020 |
2030 |
2040 |
2050 |
2010 |
2020 |
2030 |
2040 |
2050 |
|||||
|
Coal |
|
|
Oil |
|
|
Natural gas |
|
Nuclear |
|
Renewables |
Share of coal (right axis) |
||||
|
|
|
|
|
|
|||||||||||
|
|
|
|
|
|
|||||||||||
IEA. All rights reserved.
Emerging market and developing economies drive most of the increase in global electricity demand, met mainly by renewables and gas, though coal remains important
1.3.3Emissions from existing assets
The energy sector contains a large number of long lived and capital intensive assets. Urban infrastructure, pipelines, refineries, coal fired power plants, heavy industrial facilities, buildings and large hydro power plants can have technical and economic lifetimes of well over 50 years. If today’s energy infrastructure was to be operated until the end of the typical lifetime in a manner similar to the past, we estimate that this would lead to cumulative energy related and industrial process CO2 emissions between 2020 and 2050 of just under 650 Gt CO2. This is around 30% more than the remaining total CO2 budget consistent with limiting global warming to 1.5 °C with a 50% probability (see Chapter 2).
The electricity sector accounts for more than 50% of the total emissions that would come from existing assets; 40% of total emissions would come from coal fired power plants alone. Industry is the next largest sector, with steel, cement, chemicals and other industry accounting for around 30% total emissions from existing assets. The long lifetime of production facilities in these sub sectors (typically 30 40 years for a blast furnace or cement kiln) and the relatively young age of the global capital stock explain their large contribution. Transport accounts for just over 10% of emissions from existing assets and the buildings sector accounts for just under 5%. The lifetime of vehicles and equipment in the transport and buildings sectors is generally much shorter than is the case in electricity and industry – passenger cars, for example, are generally assumed to have a lifetime of around 17 years – but associated infrastructure networks such as roads, electricity networks and gas grids have very long lifetimes.
There are some large regional differences in emissions levels from existing assets (Figure 1.9). Advanced economies tend to have much older capital stocks than emerging market and developing economies, particularly in the electricity sector, and existing assets will reach the end of their lifetimes earlier. For example, the average age of coal fired power
Chapter 1 | Announced net zero pledges and the energy sector |
39 |
1
IEA. All rights reserved.